Real-Scale Integral Valorization of Waste Orange Peel via Hydrodynamic Cavitation

 ,
, 
 ,
,  , , ,
, , ,  , , ,
, , , 
Abstract
: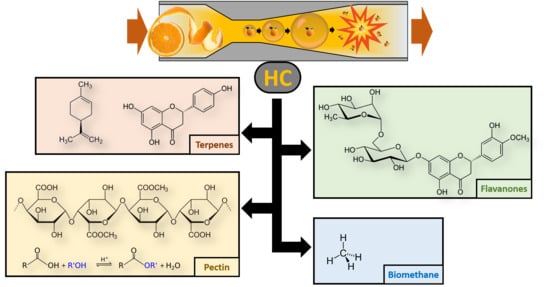
1. Introduction
2. Materials and Methods
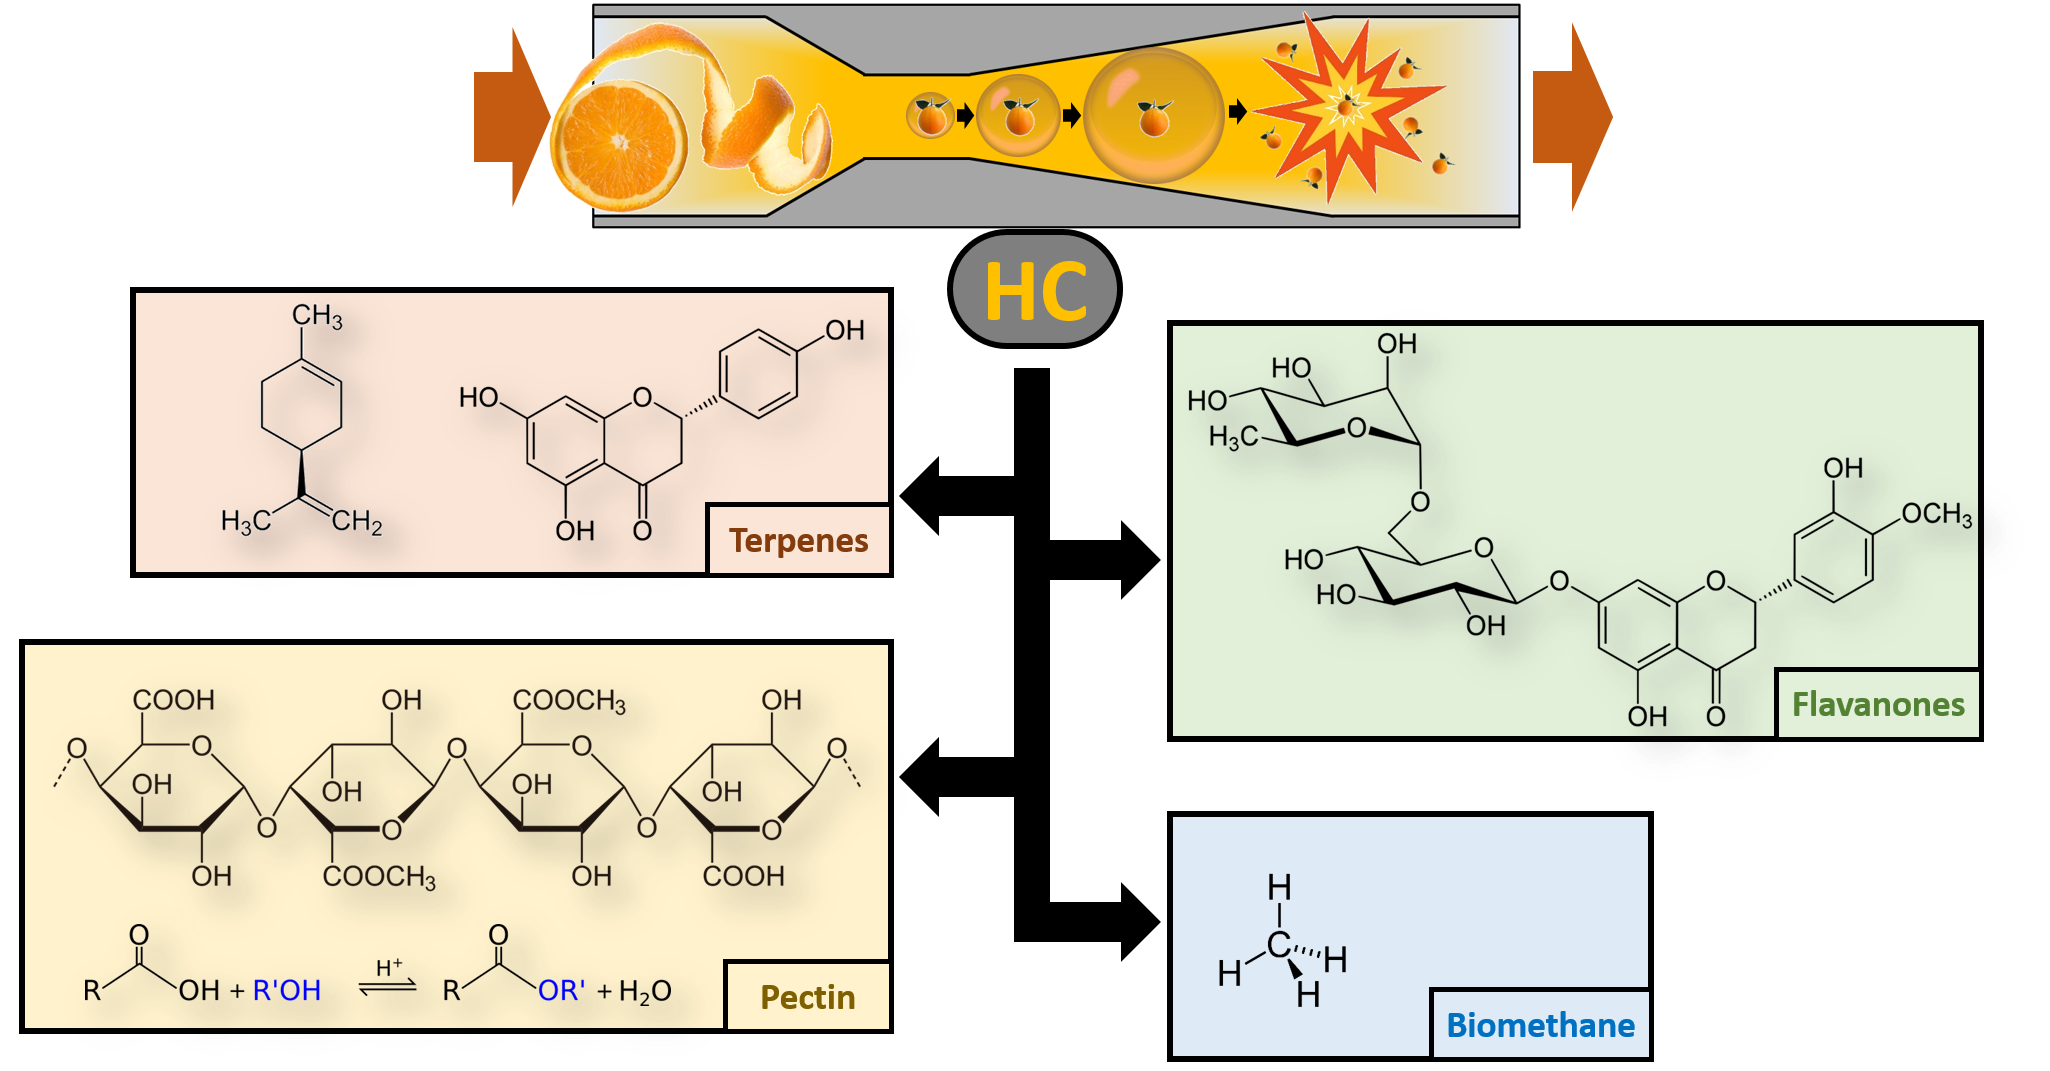
2.1. HC Device and Processes
2.2. Orange Waste Samples and Tests
2.3. Experimental and Analytical Procedures
2.3.1. Biochemical Methane Generation Potential
2.3.2. Pectin
2.3.3. Polyphenols Analysis by High Performance Liquid Chromatography with a Diode Array Detector (HPLC-DAD)
2.3.4. Analysis of Terpenes
3. Results
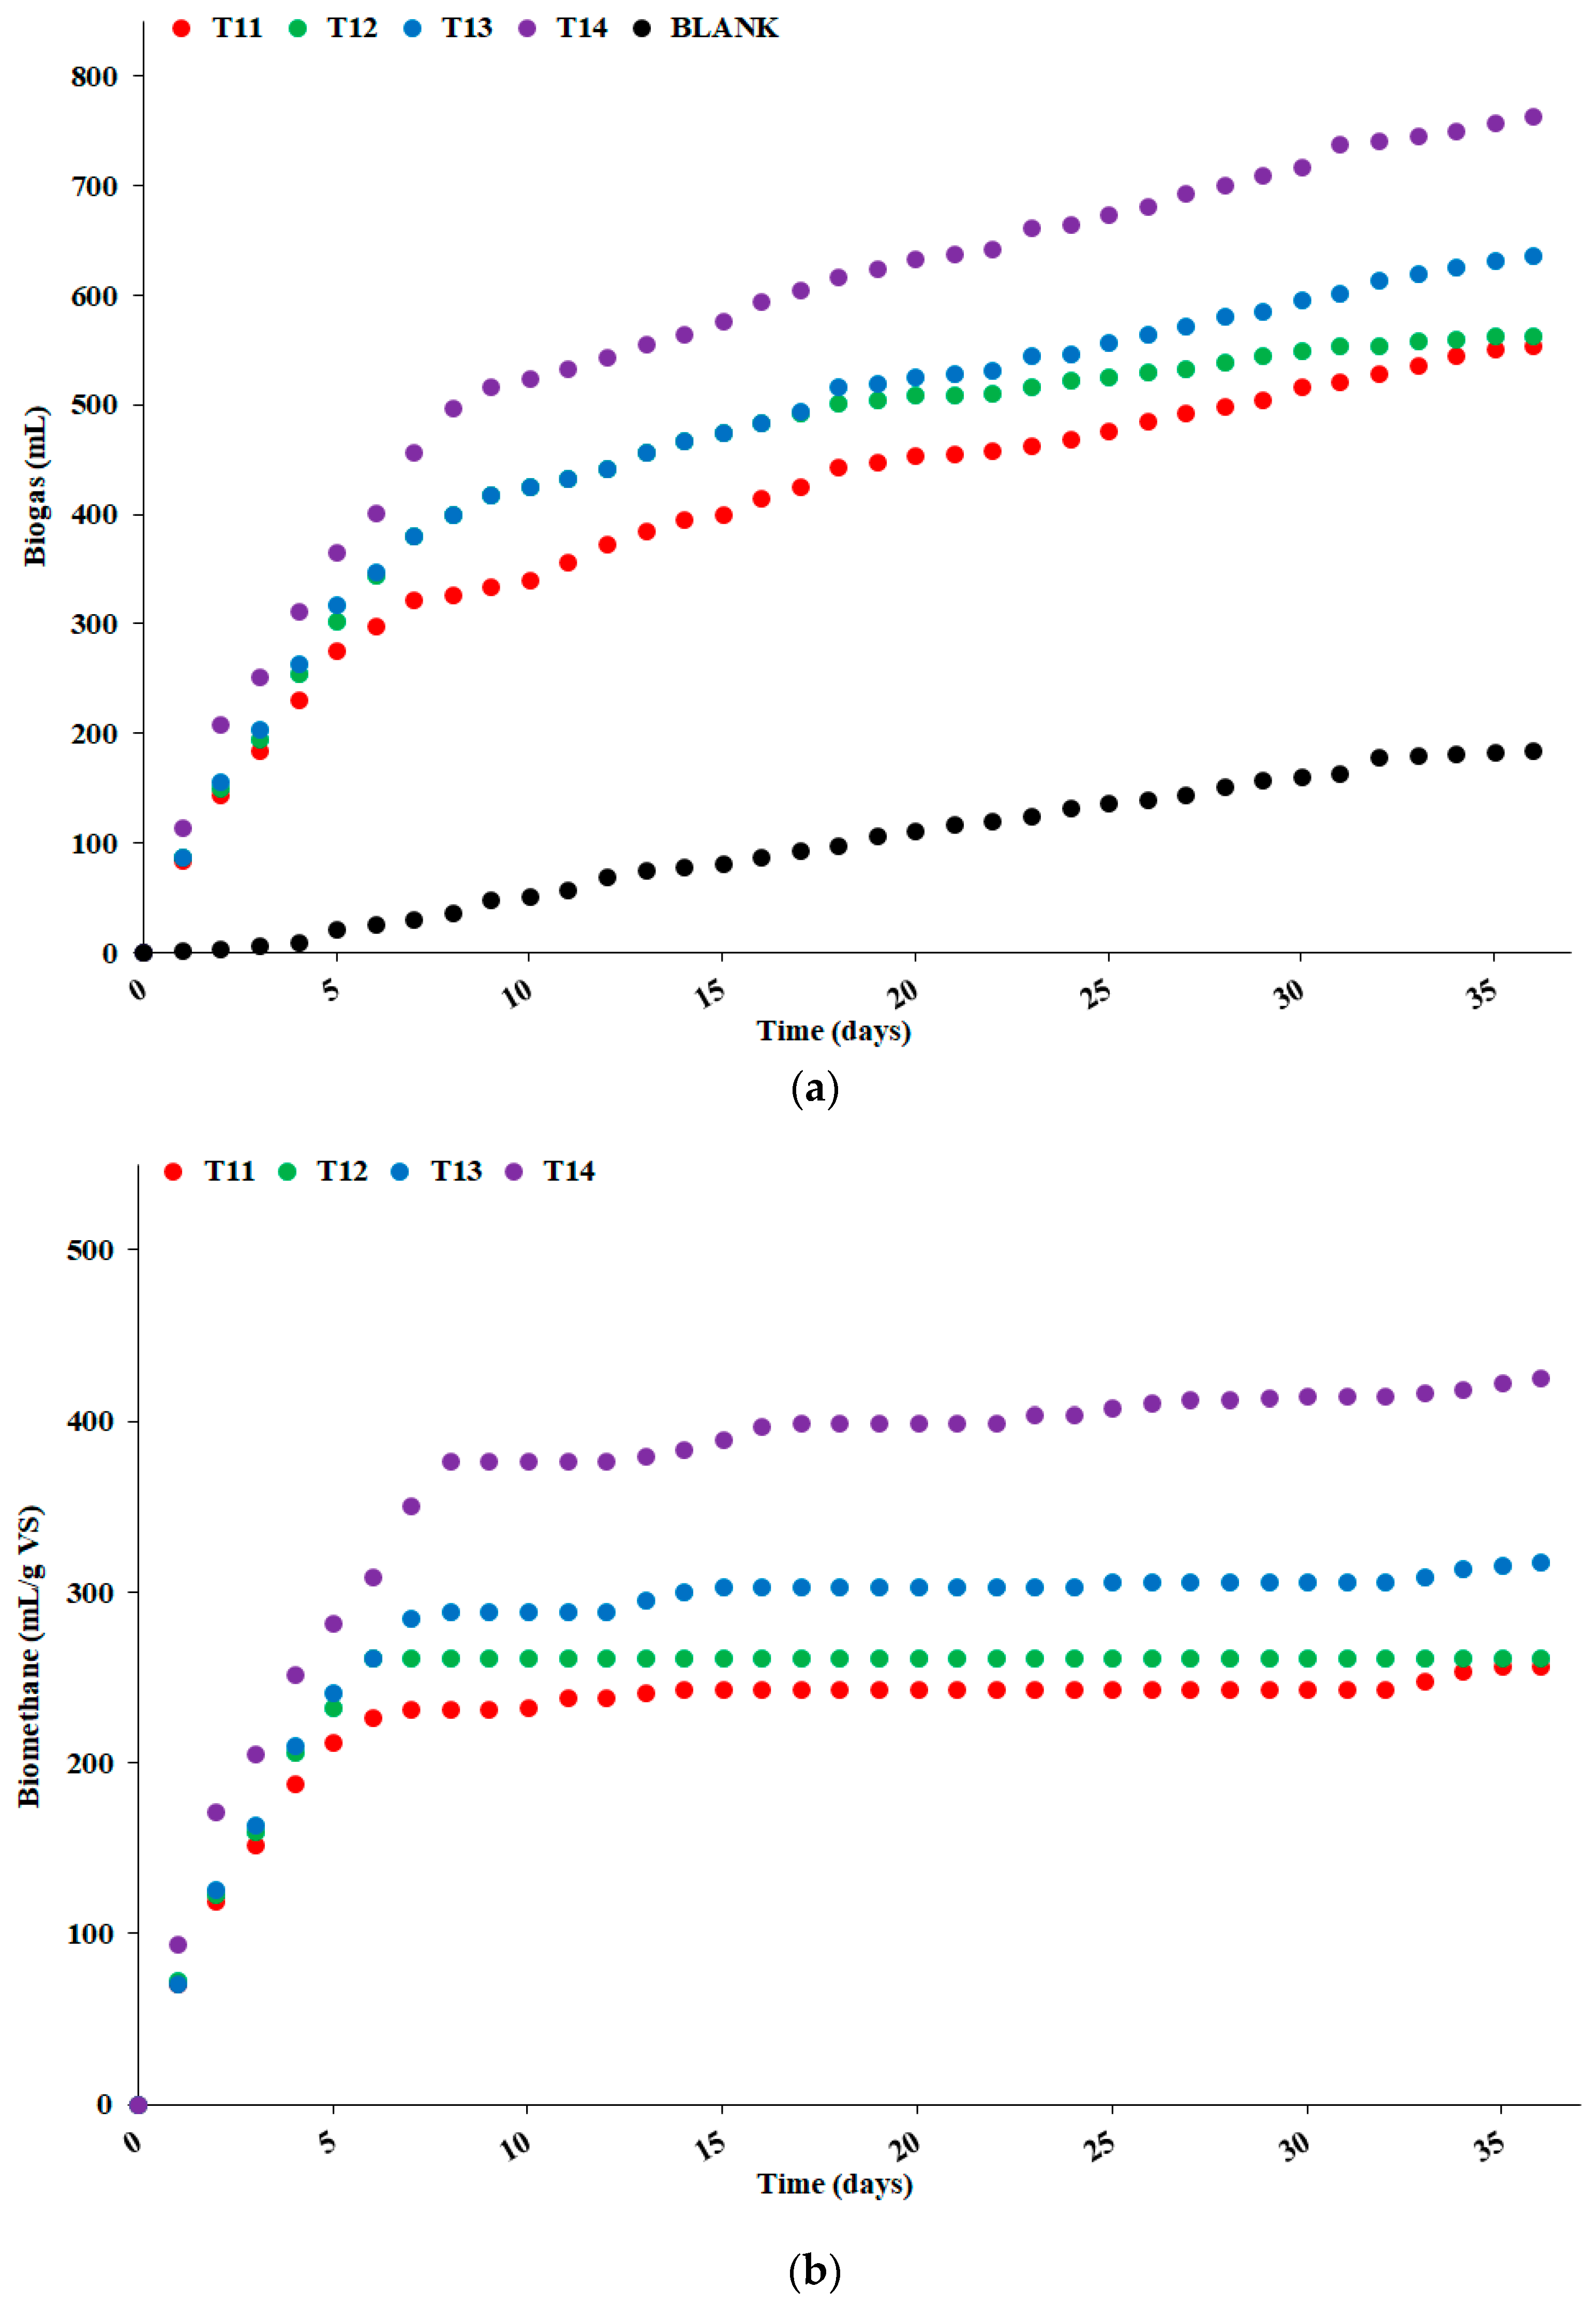
3.1. Biochemical Methane Generation Potential
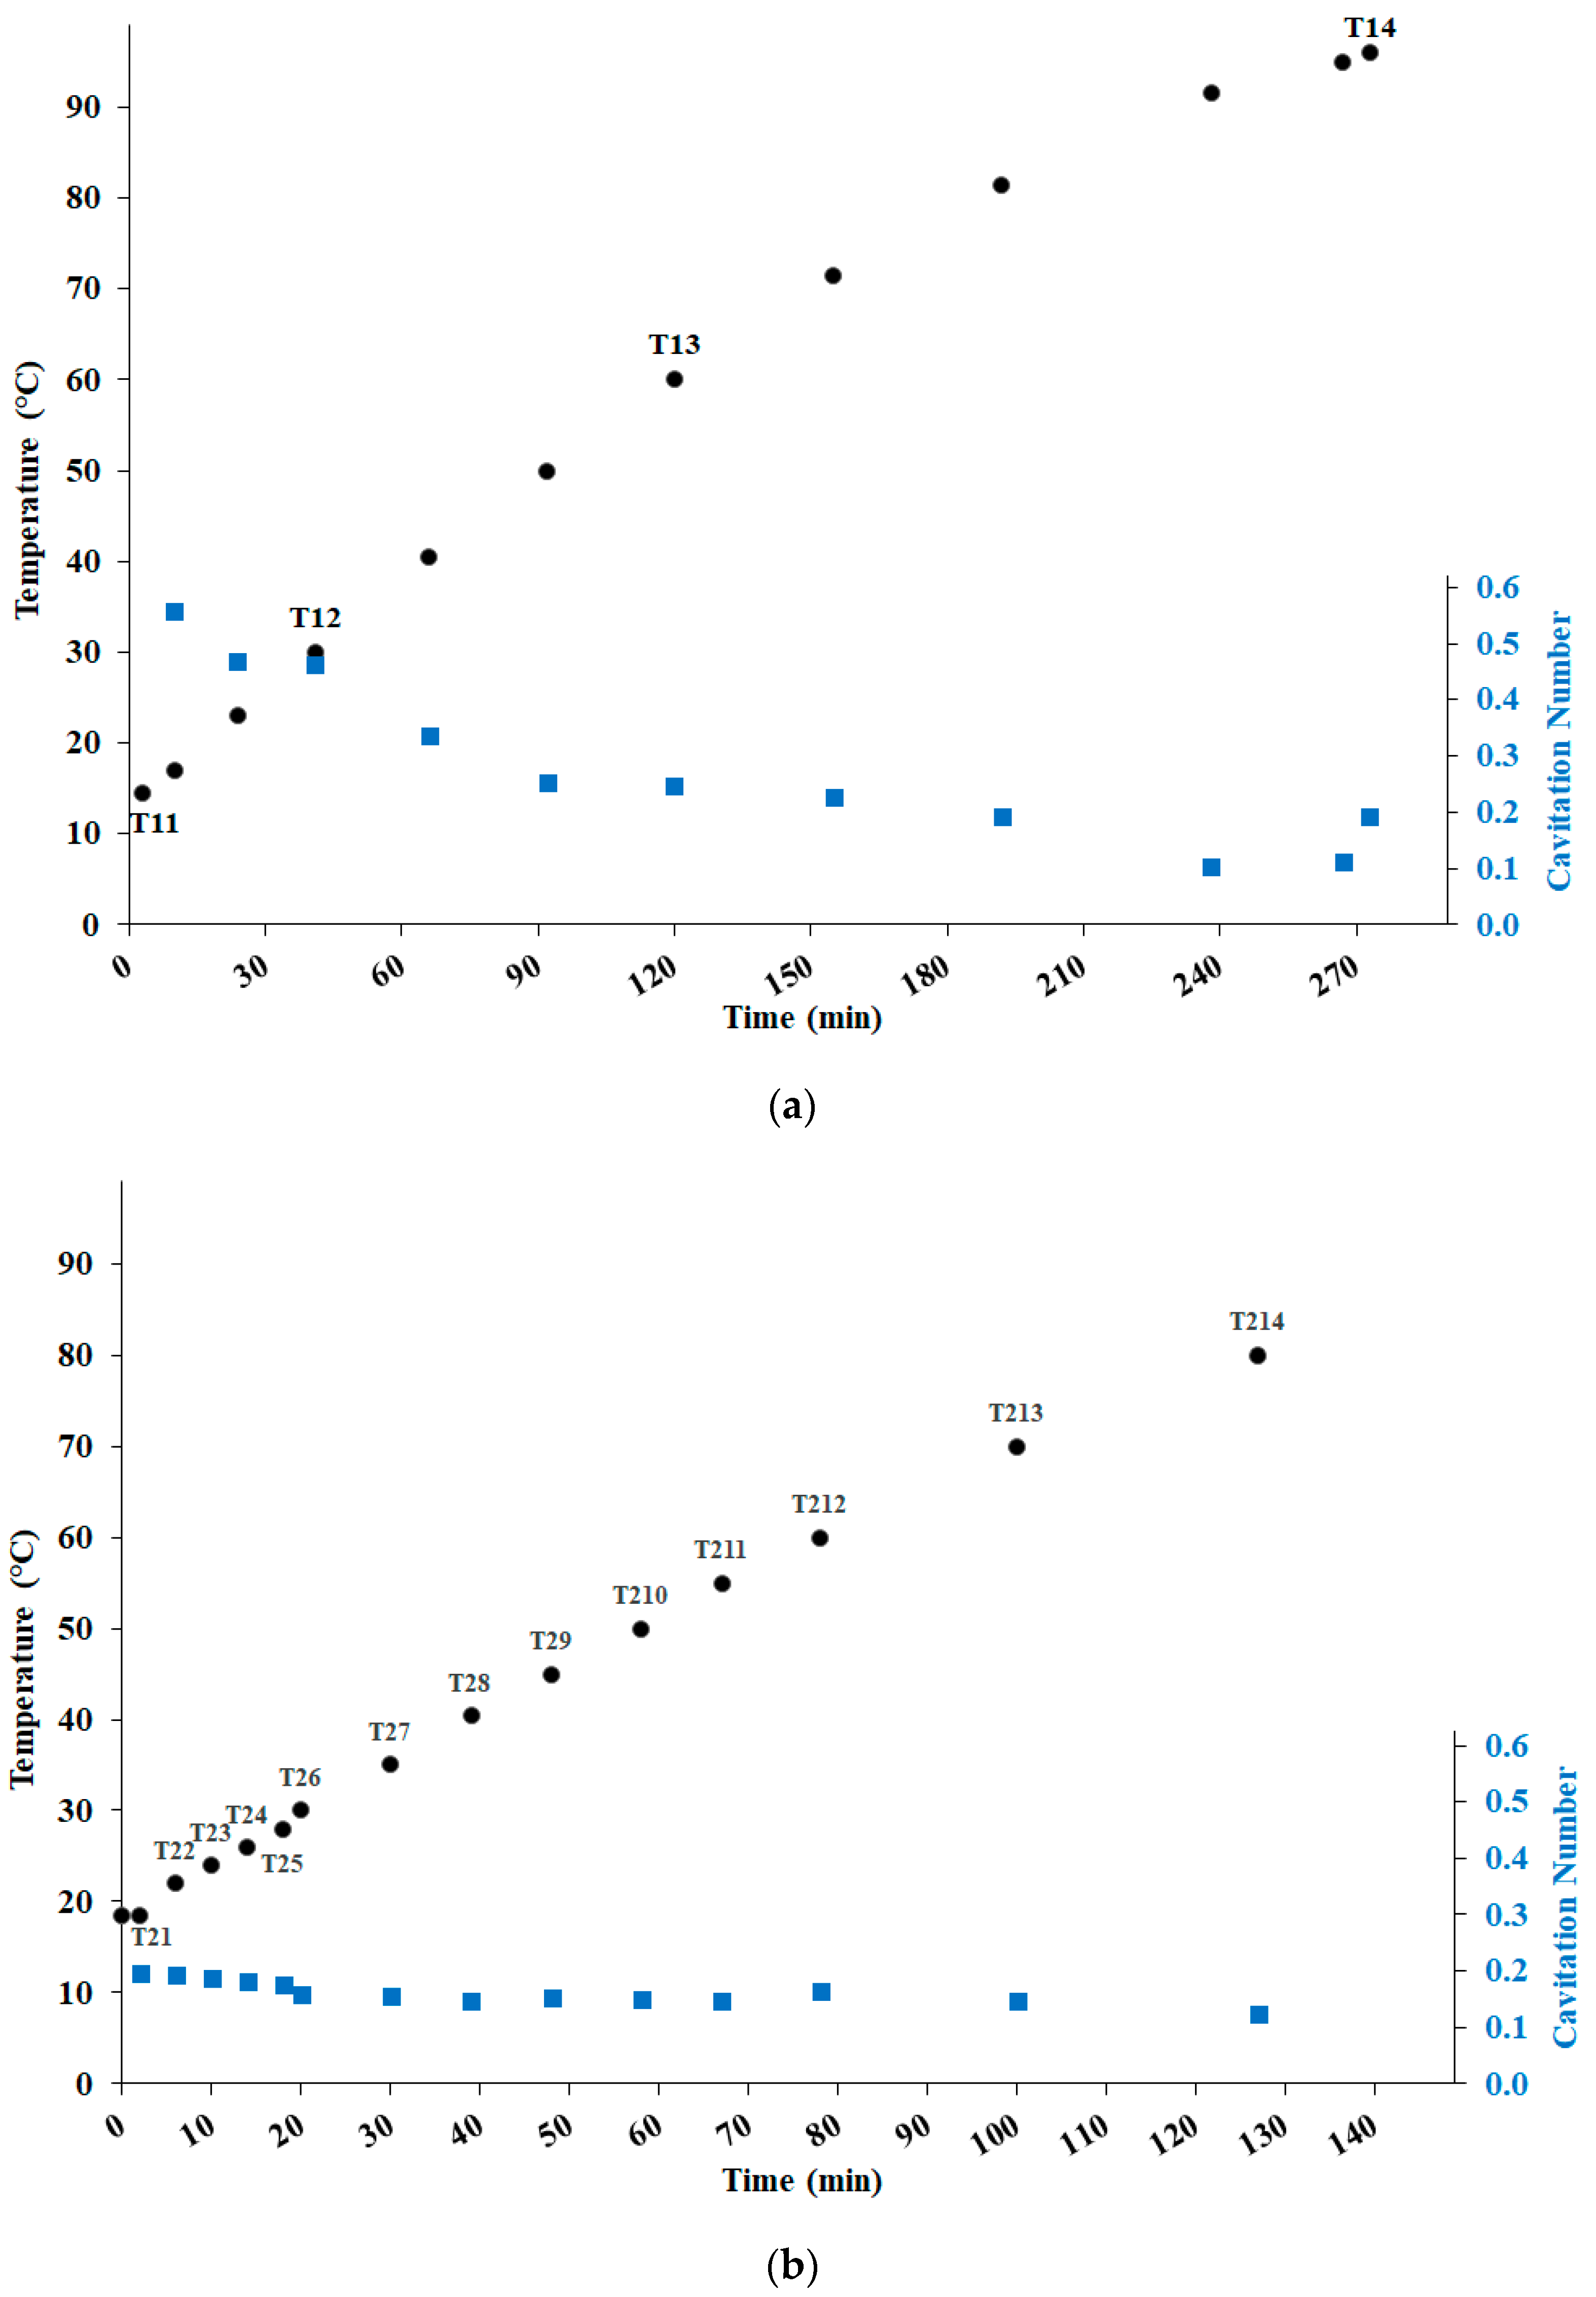
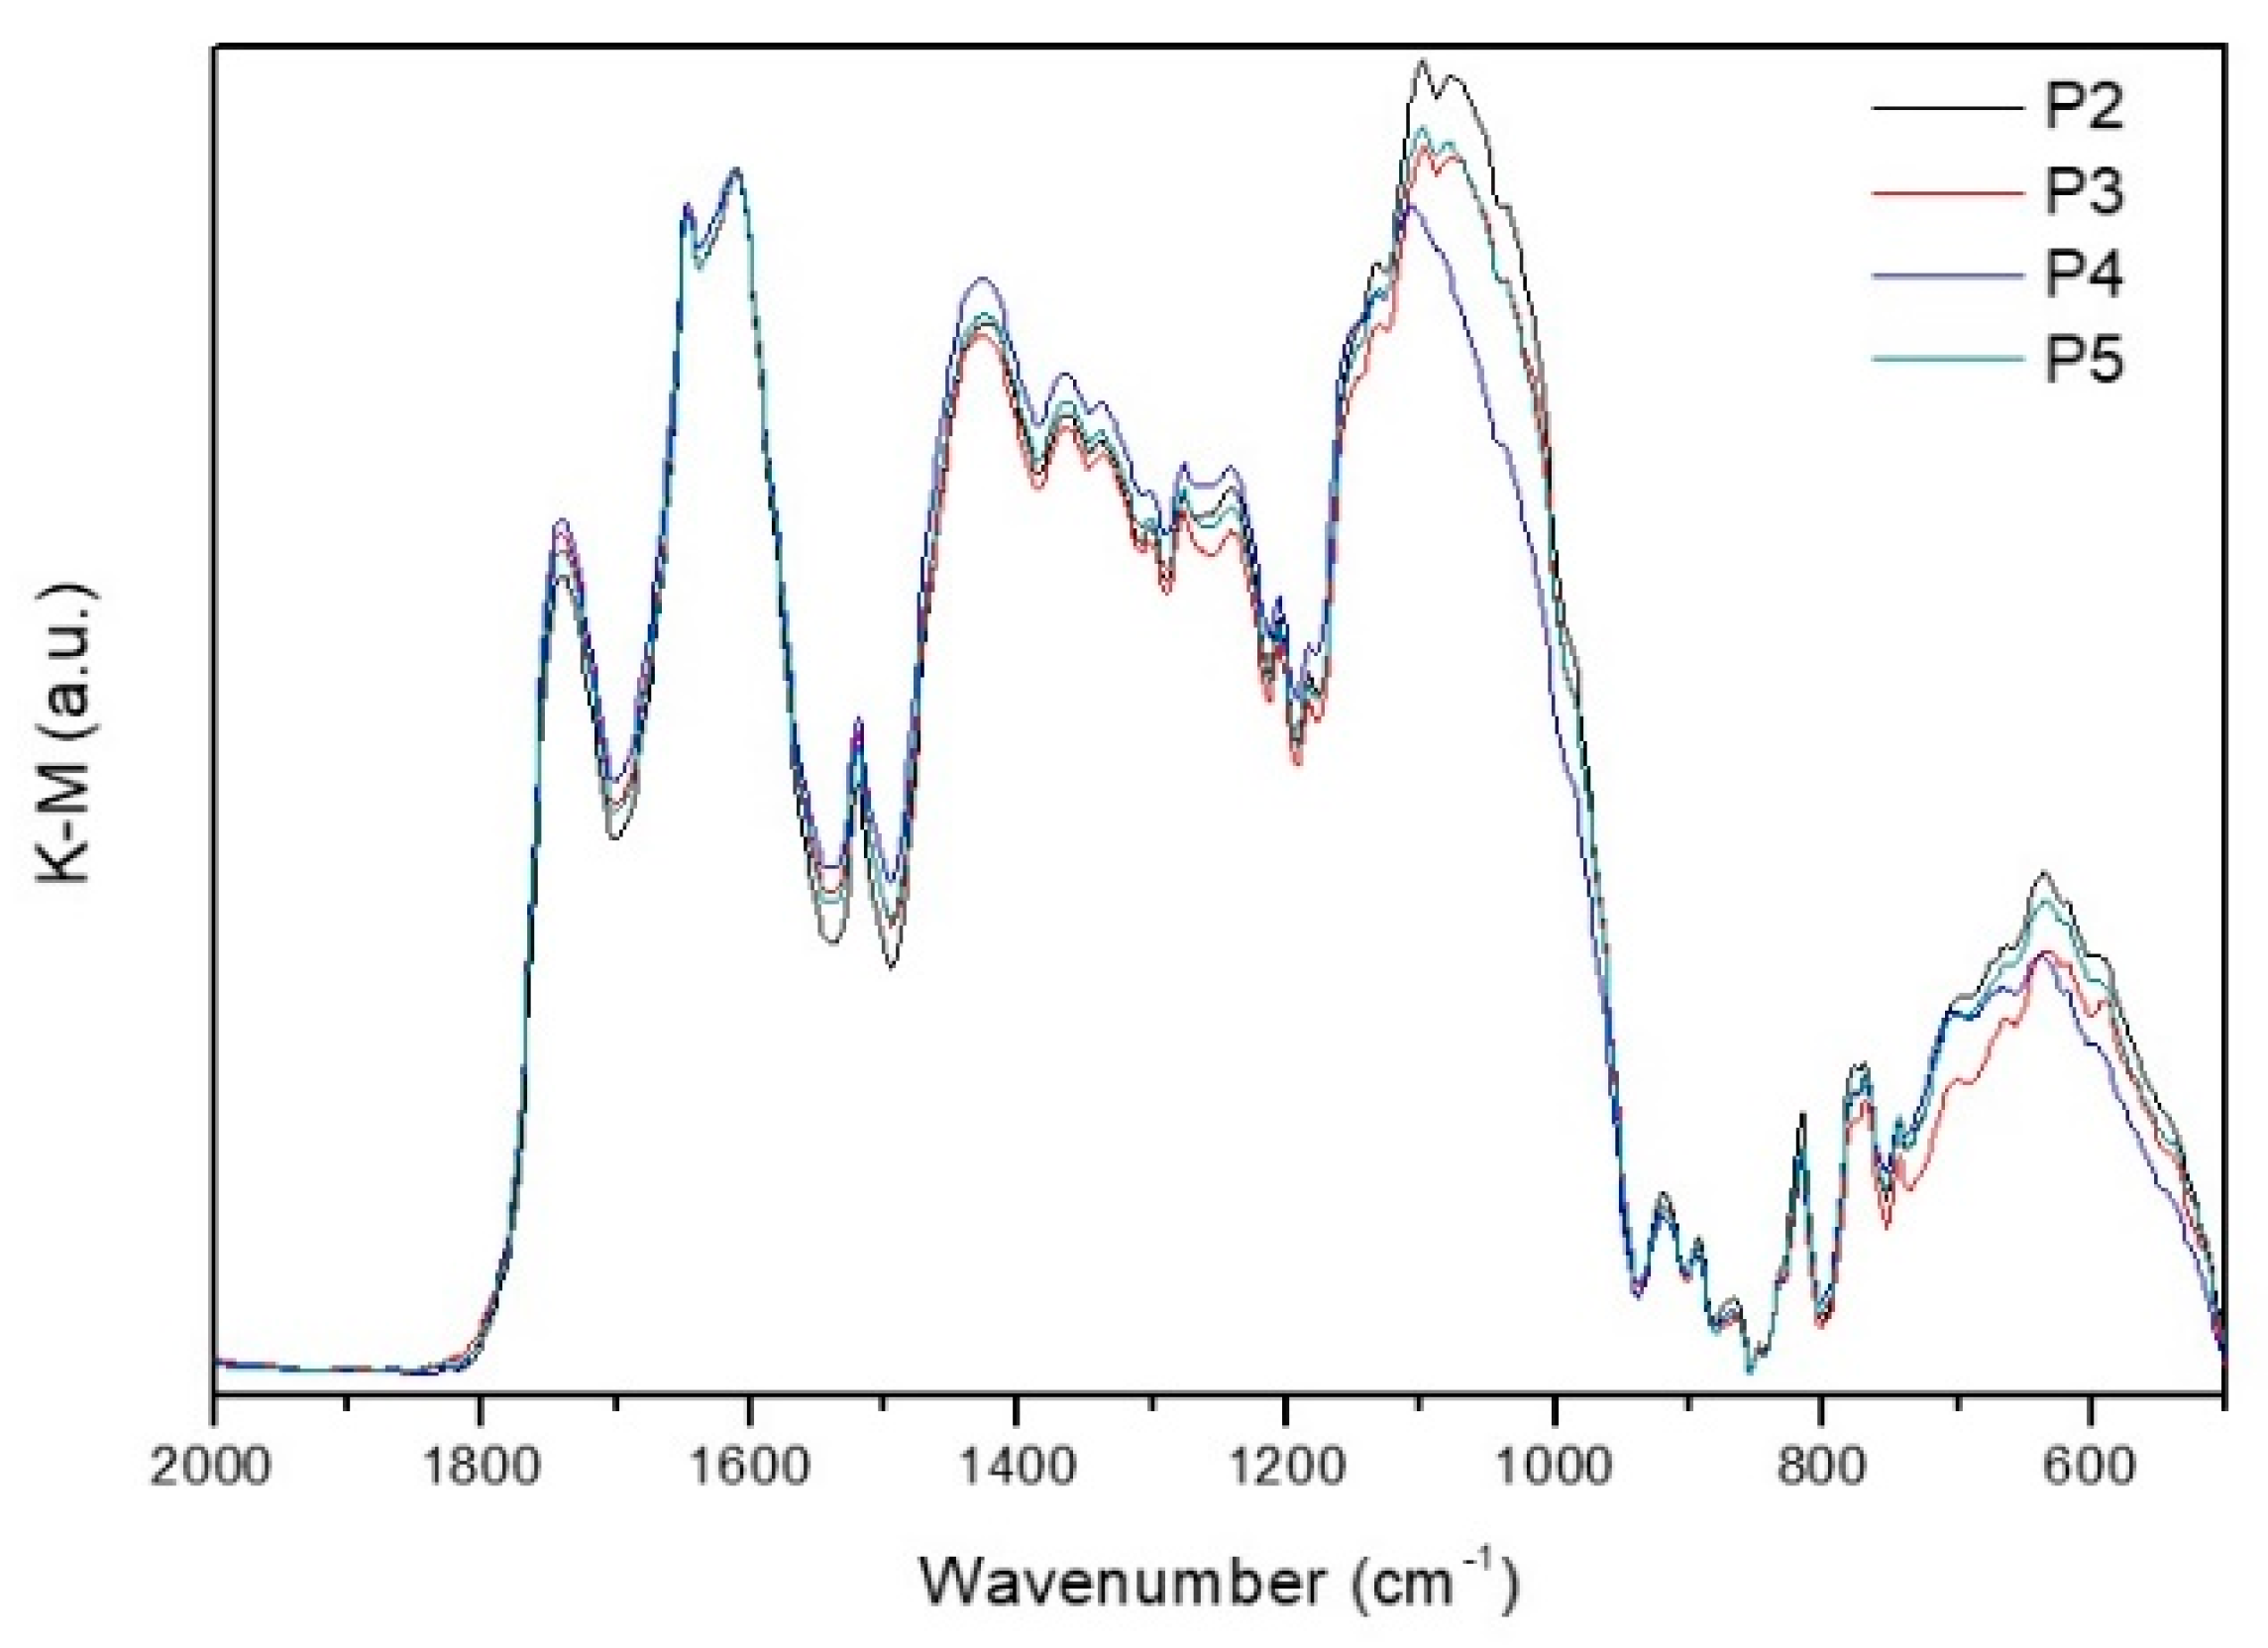
3.2. Pectin
- The δasCH3 and δsCH3 (from ester methyl groups in the galacturonic rings and rhamnose rings of the pectin backbone) at 1520 and 1365 cm−1;
- The νsCOO− at 1425 cm−1;
- The νC–O–Cester at 1277cm−1;
- The δipC–O–H (from alcohol hydroxyl groups in the pyranose rings of the pectin chain) at 1242 cm−1.
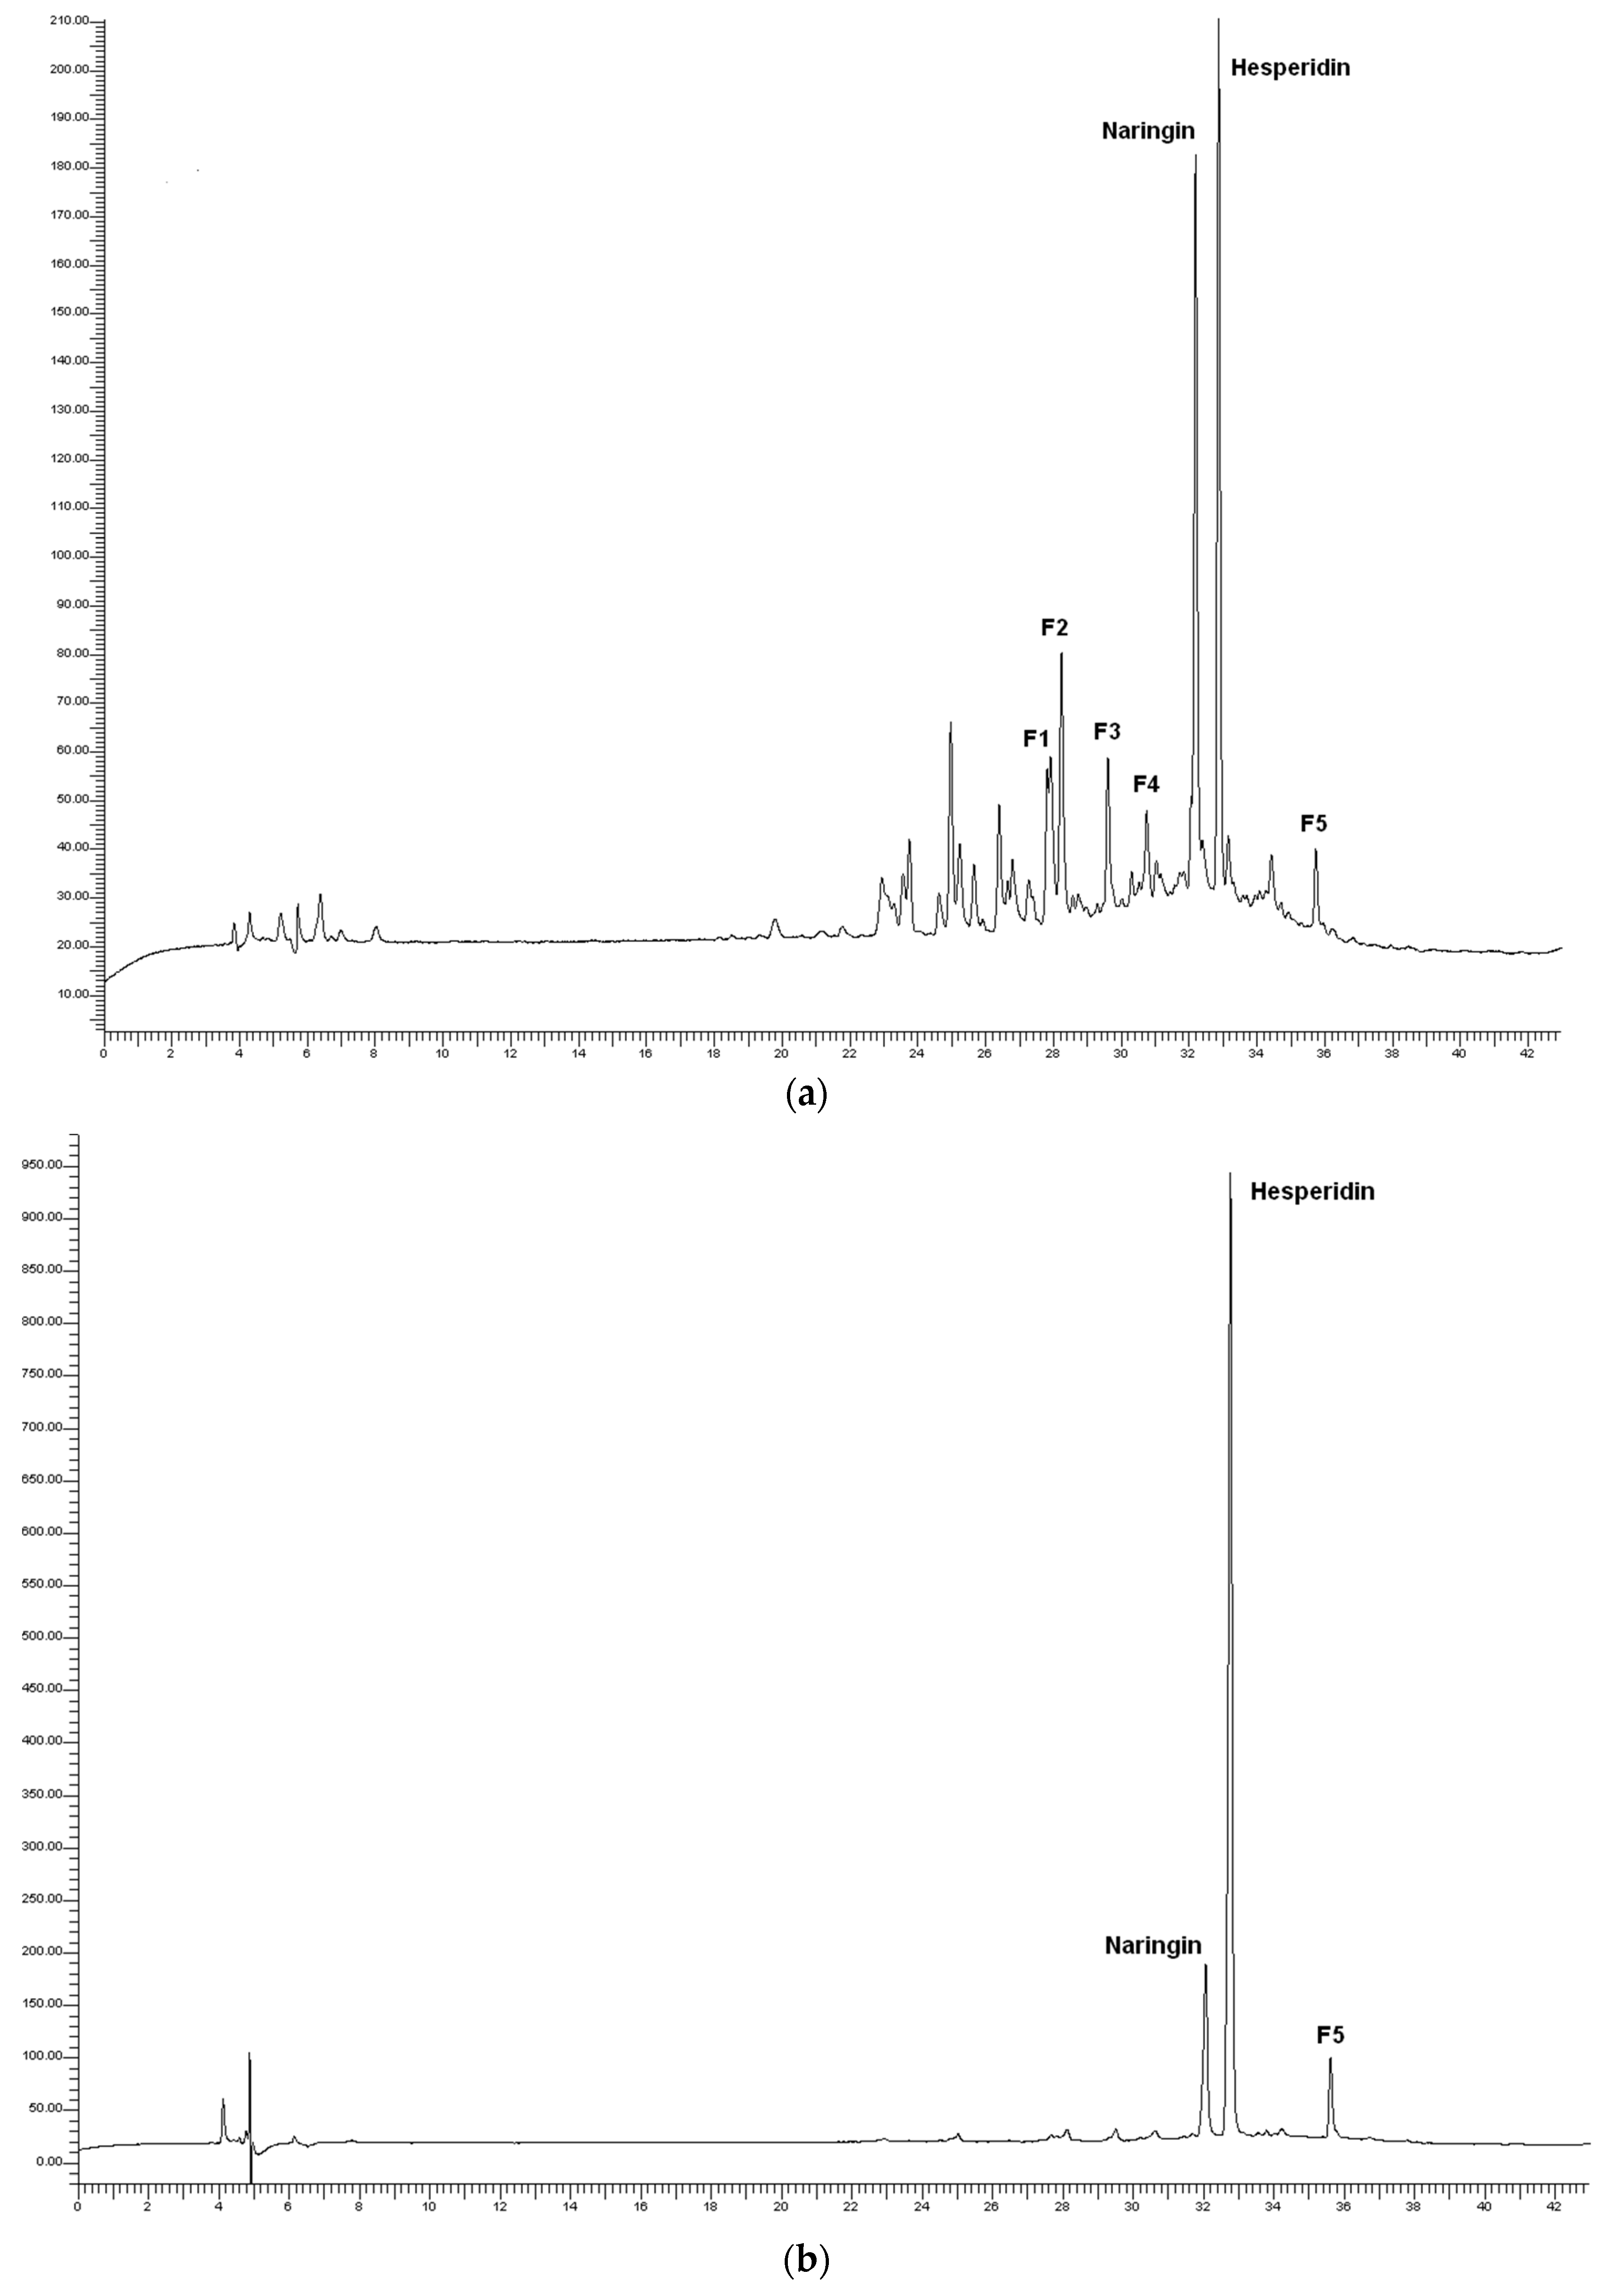
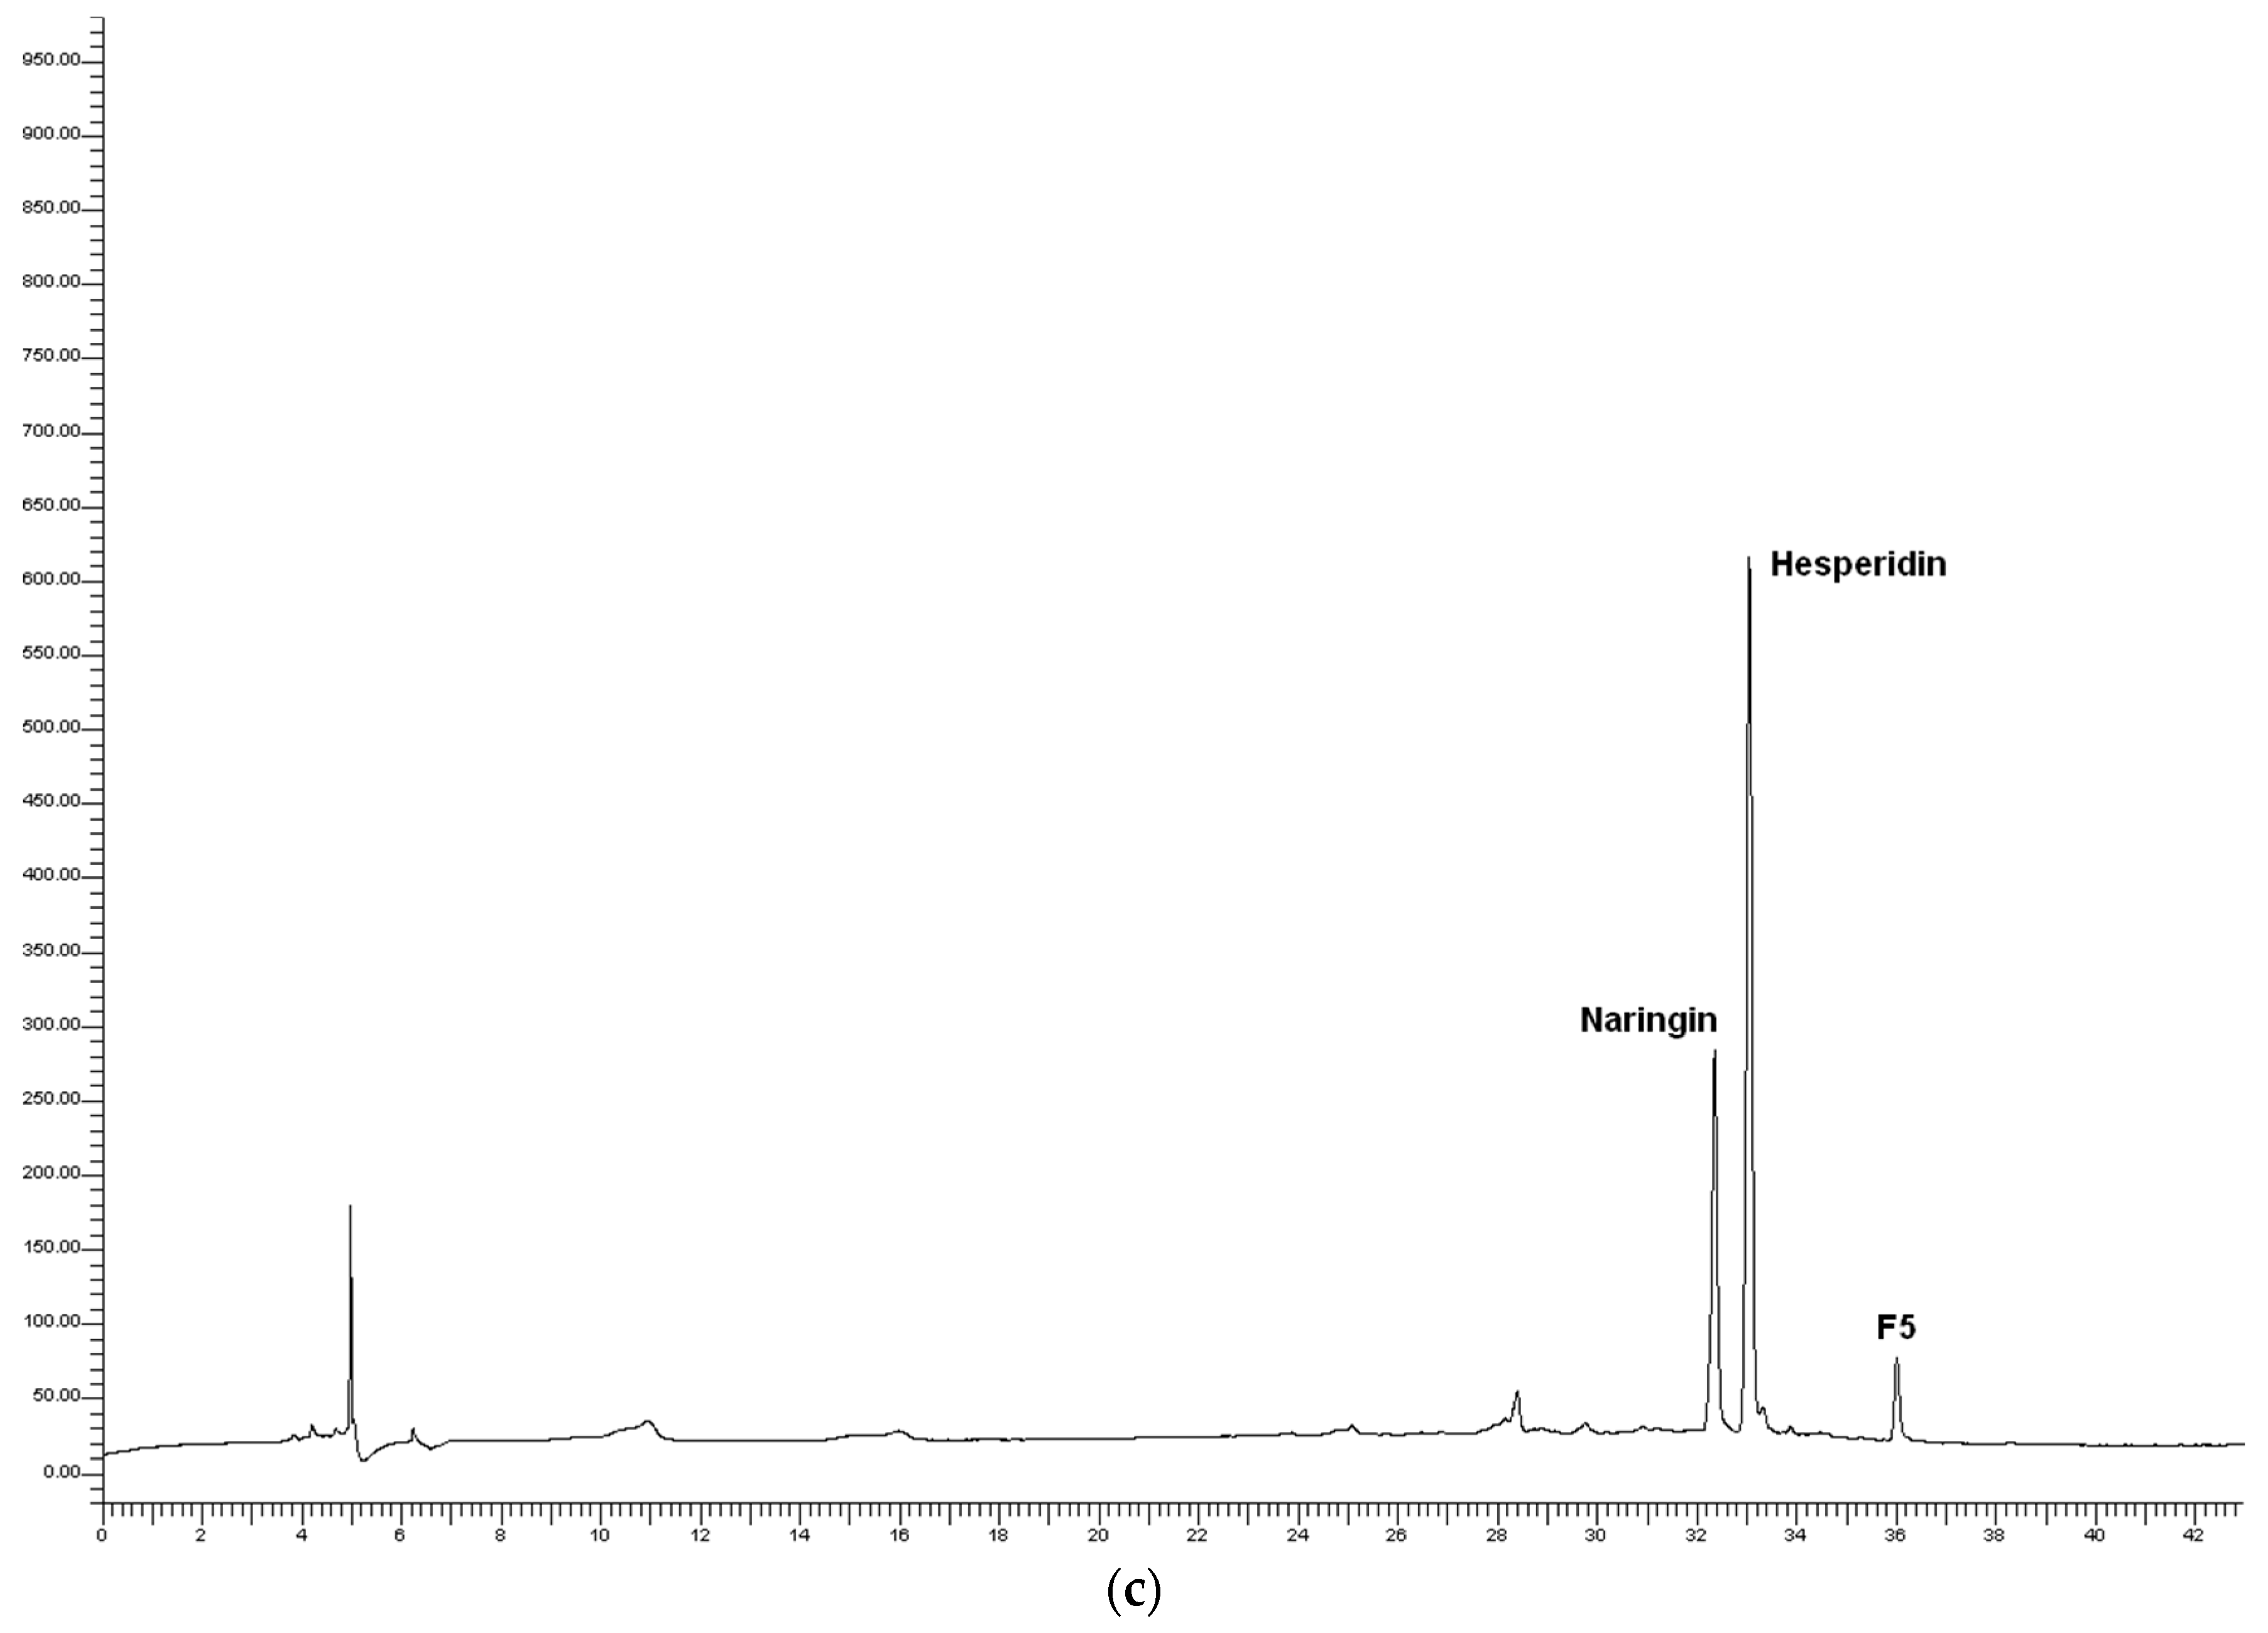
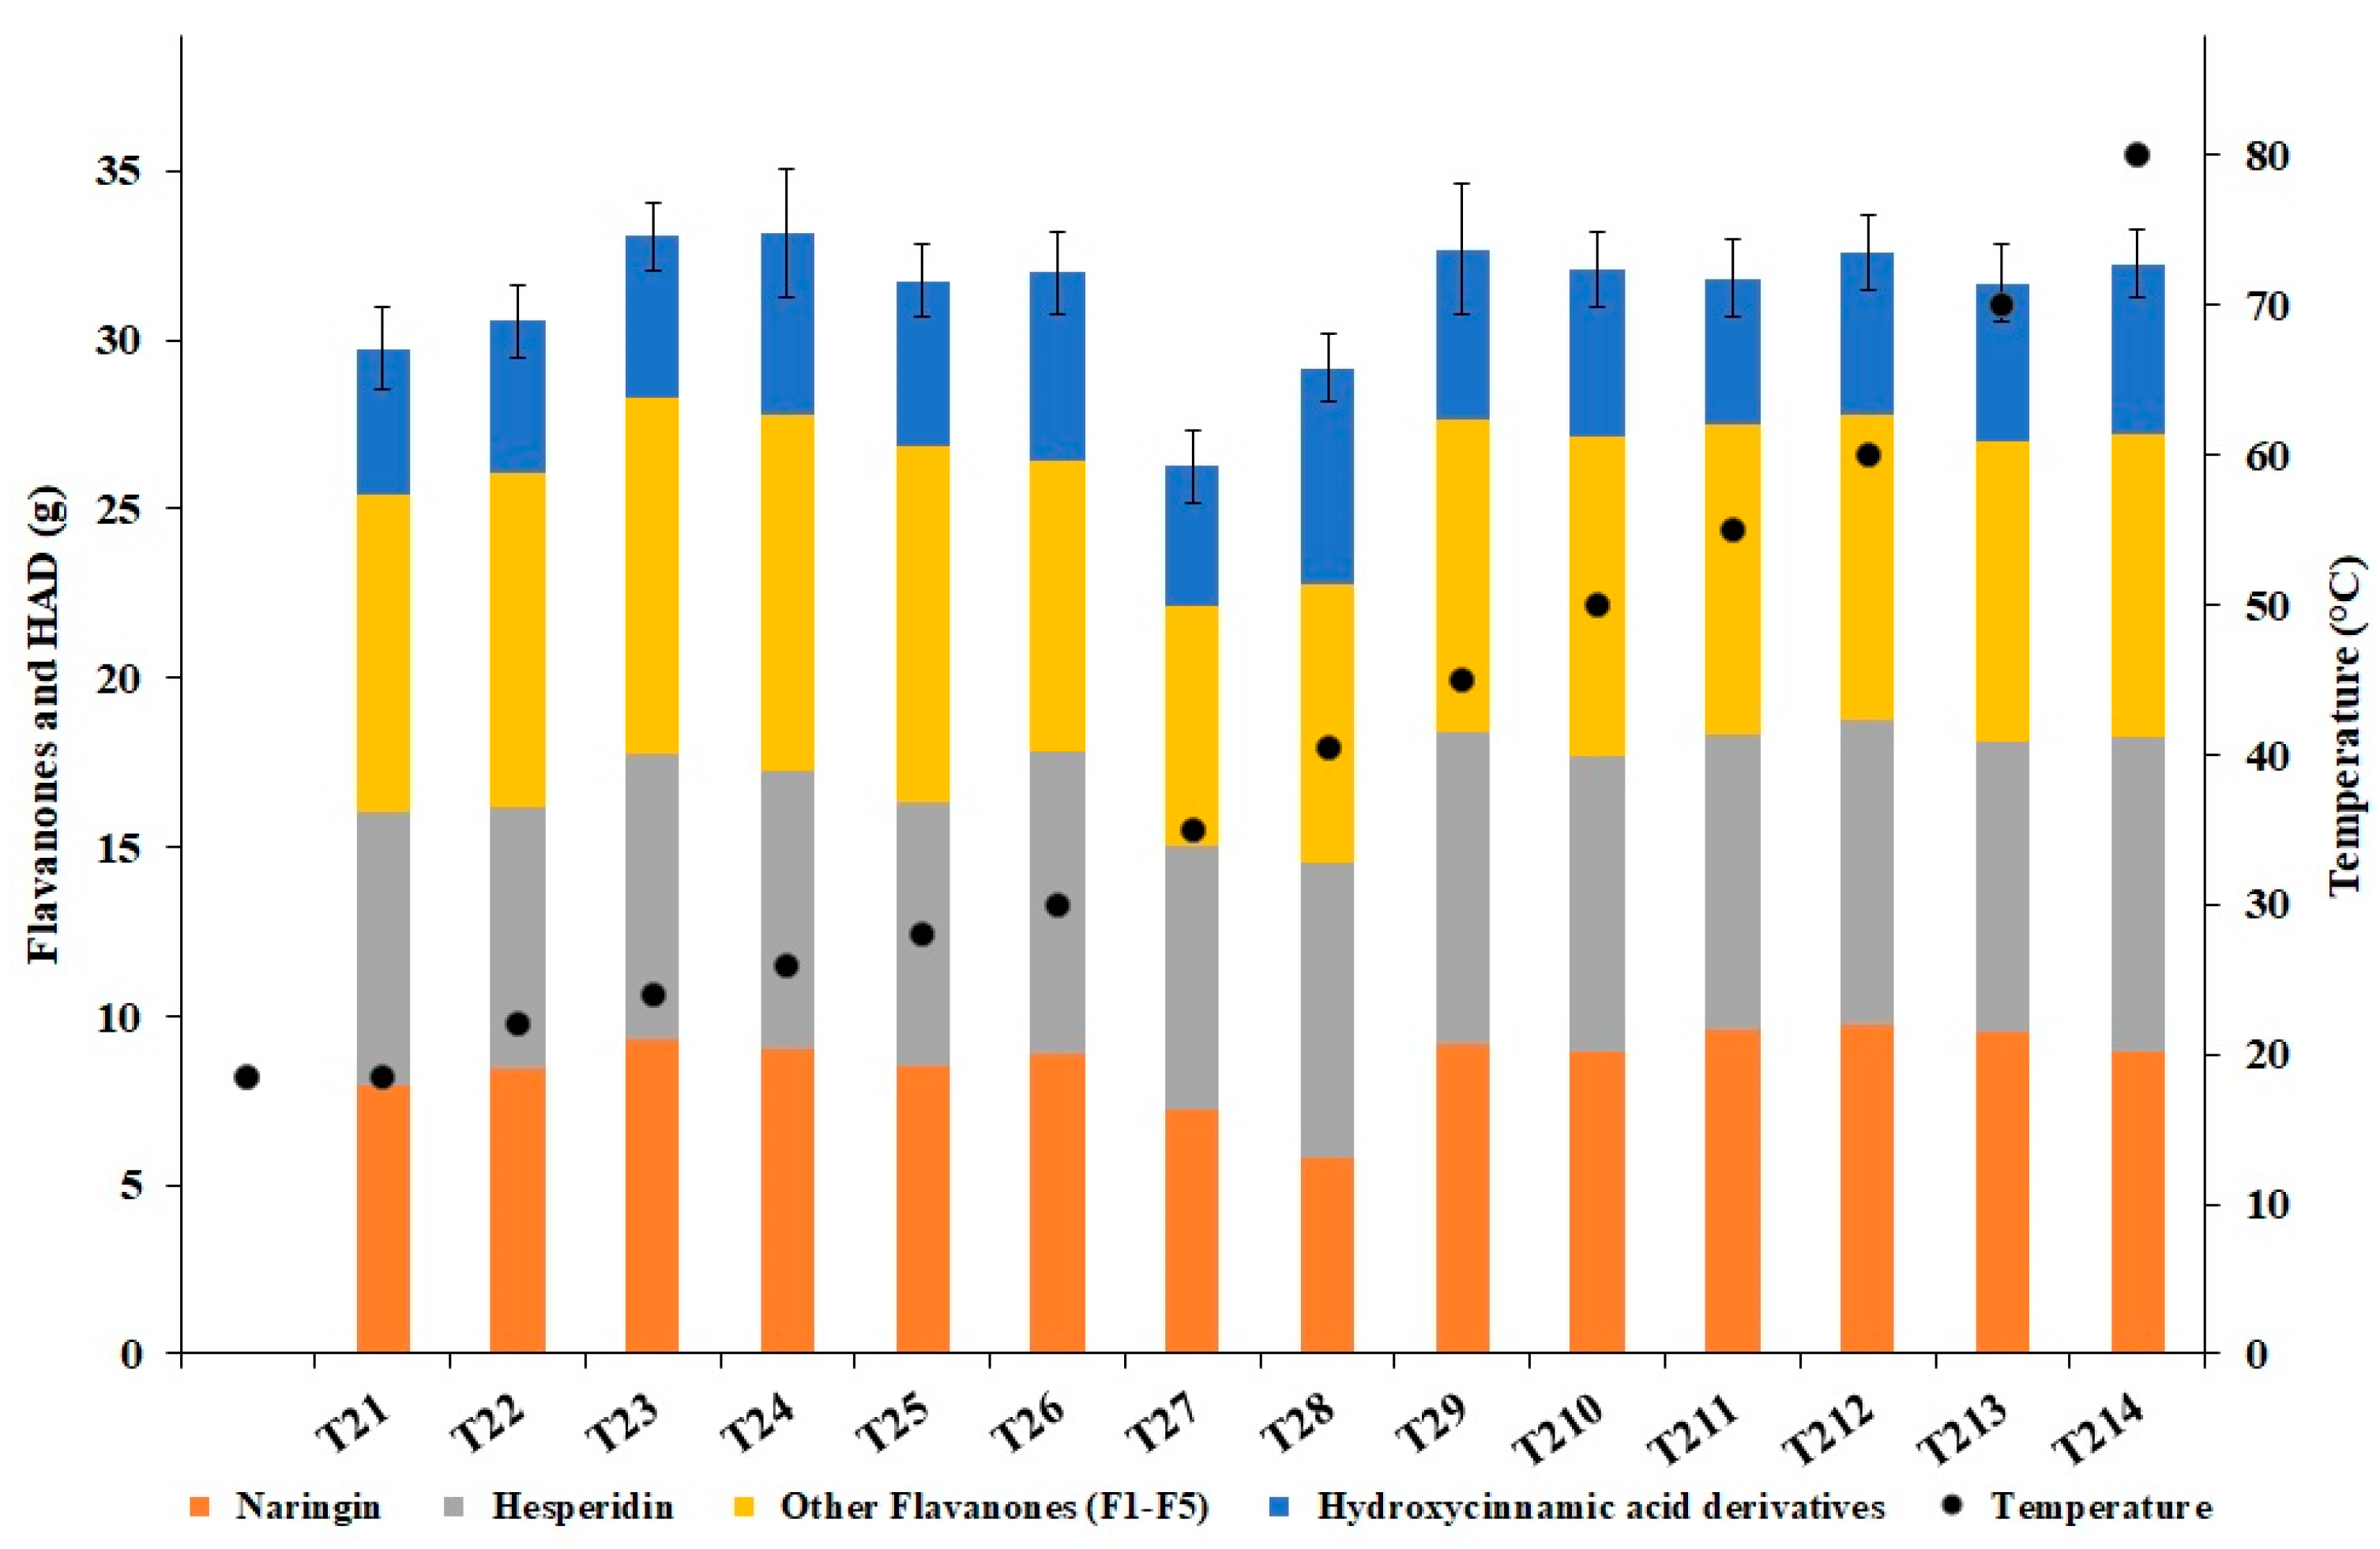
3.3. Polyphenols
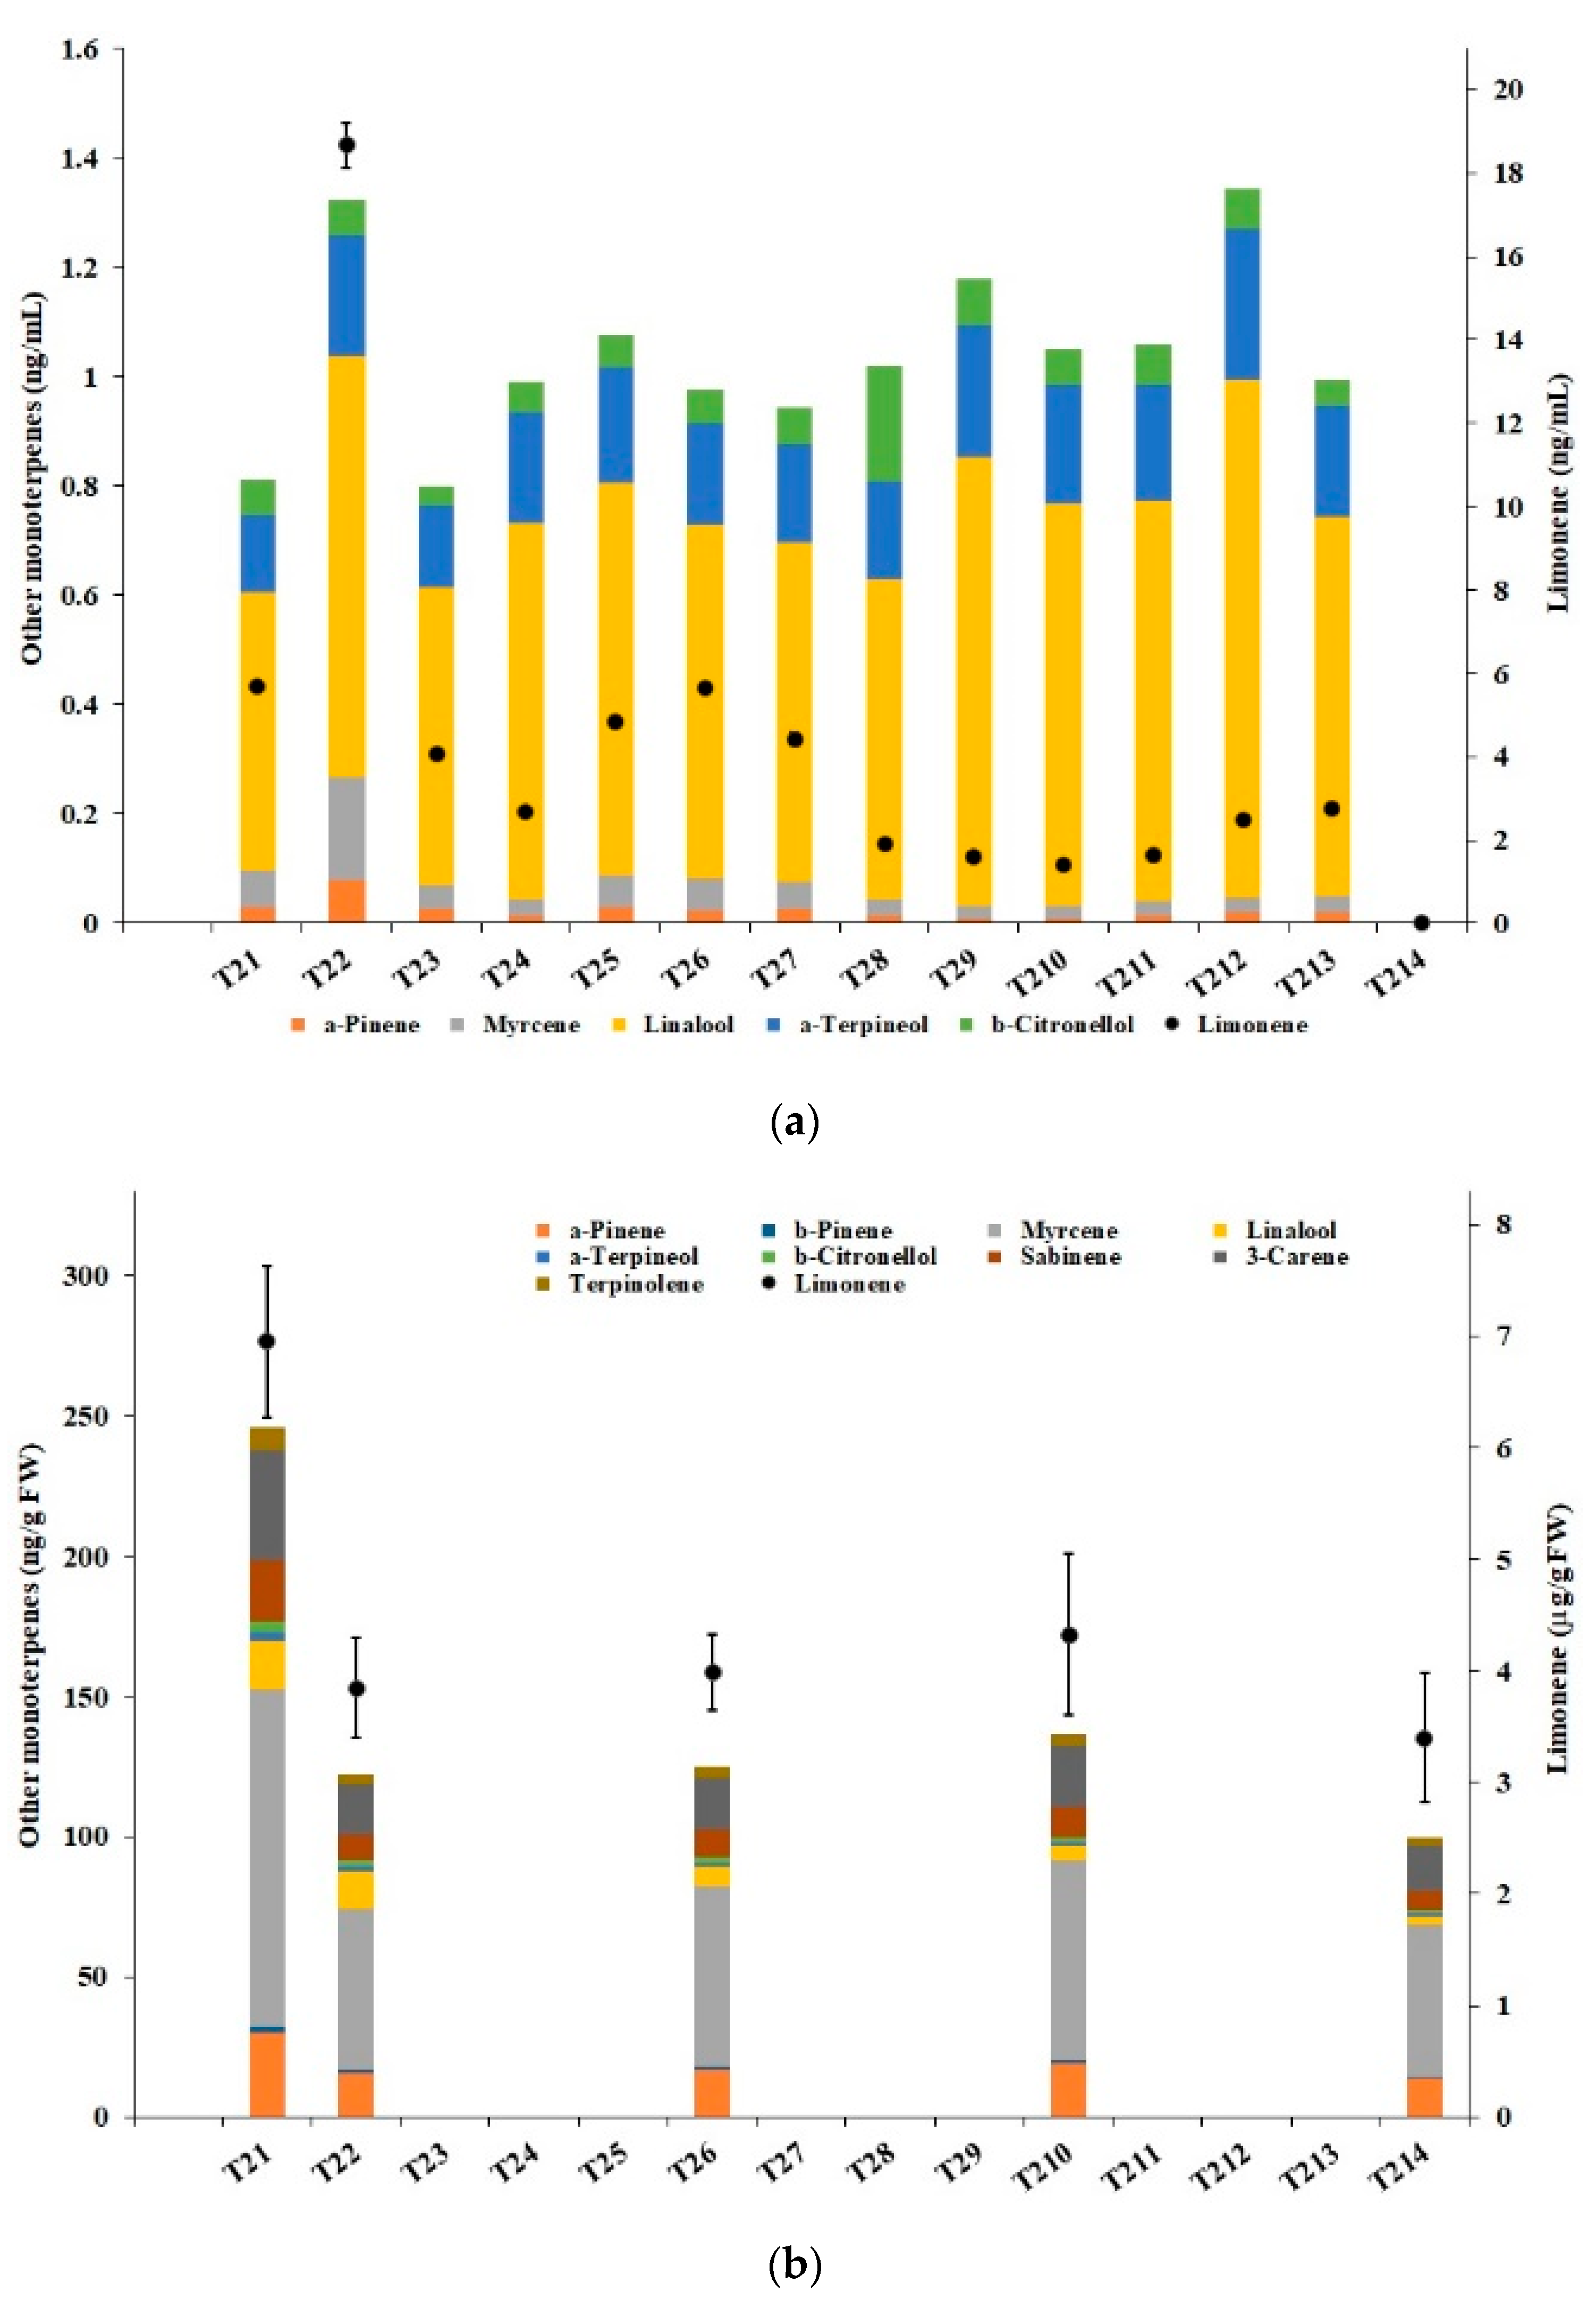
3.4. Terpenes
4. Discussion
5. Conclusions
Author Contributions
Funding
Acknowledgments
Conflicts of Interest
References
- Satari, B.; Karimi, K. Citrus processing wastes: Environmental impacts, recent advances, and future perspectives in total valorization. Resour. Conserv. Recycl. 2018, 129, 153–167. [Google Scholar] [CrossRef]
- USDA—United States Department of Agriculture. Foreign Agricultural Service. Citrus: World Markets and Trade. 2019; pp. 1–11. Available online: https://apps.fas.usda.gov/psdonline/circulars/citrus.pdf (accessed on 25 July 2019).
- Negro, V.; Ruggeri, B.; Fino, D.; Tonini, D. Life cycle assessment of orange peel waste management. Resour. Conserv. Recycl. 2017, 127, 148–158. [Google Scholar] [CrossRef]
- Ciriminna, R.; Fidalgo, A.; Delisi, R.; Carnaroglio, D.; Grillo, G.; Cravotto, G.; Tamburino, A.; Ilharco, L.M.; Pagliaro, M. High-Quality essential oils extracted by an eco-friendly process from different citrus fruits and fruit regions. ACS Sustain. Chem. Eng. 2017, 5, 5578–5587. [Google Scholar] [CrossRef]
- Pourbafrani, M.; Forgács, G.; Horváth, I.S.; Niklasson, C.; Taherzadeh, M.J. Production of biofuels, limonene and pectin from citrus wastes. Bioresour. Technol. 2010, 101, 4246–4250. [Google Scholar] [CrossRef] [PubMed]
- Ciriminna, R.; Lomeli-Rodriguez, M.; Demma Carà, P.; Lopez-Sanchez, J.A.; Pagliaro, M. Limonene: A versatile chemical of the bioeconomy. Chem. Commun. 2014, 50, 15288–15296. [Google Scholar] [CrossRef] [PubMed]
- Singh, G.; Upadhyay, R.K.; Narayanan, C.S.; Padmkumari, K.P.; Rao, G.P. Chemical and fungitoxic investigations on the essential oil of Citrus sinensis (L.) Pers. J. Plant Dis. Prot. 1993, 100, 69–74. [Google Scholar]
- Hollingsworth, R.G. Limonene, a citrus extract, for control of mealybugs and scale insects. J. Econ. Entomol. 2005, 98, 772–779. [Google Scholar] [CrossRef] [PubMed]
- Keinan, E.; Alt, A.; Amir, G.; Bentur, L.; Bibi, H.; Shoseyov, D. Natural ozone scavenger prevents asthma in sensitized rats. Bioorganic Med. Chem. 2005, 13, 557–562. [Google Scholar] [CrossRef] [PubMed]
- Fitzgerald, C.; Hossain, M.; Rai, D.K. Waste/By-Product Utilisations. In Innovative Technologies in Beverage Processing; Aguiló-Aguayoi, I., Plaza, L., Eds.; John Wiley & Sons, Ltd.: Chichester, UK, 2017; pp. 297–309. [Google Scholar]
- Pagliaro, M.; Rosaria, C.; Fidalgo, A.M.A.; Delisi, R.; Ilharco, L. Pectin production and global market. Agro Food Ind. Hi Tech 2016, 27, 17–20. [Google Scholar]
- Ciriminna, R.; Chavarría-Hernández, N.; Inés Rodríguez Hernández, A.; Pagliaro, M. Pectin: A new perspective from the biorefinery standpoint. Biofuels Bioprod. Biorefining 2015, 9, 368–377. [Google Scholar] [CrossRef]
- Fidalgo, A.; Ciriminna, R.; Carnaroglio, D.; Tamburino, A.; Cravotto, G.; Grillo, G.; Ilharco, L.M.; Pagliaro, M. Eco-Friendly extraction of pectin and essential oils from orange and lemon peels. ACS Sustain. Chem. Eng. 2016, 4, 2243–2251. [Google Scholar] [CrossRef]
- Leroux, J.; Langendorff, V.; Schick, G.; Vaishnav, V.; Mazoyer, J. Emulsion stabilizing properties of pectin. Food Hydrocoll. 2003, 17, 455–462. [Google Scholar] [CrossRef]
- Dickinson, E. Hydrocolloids acting as emulsifying agents—How do they do it? Food Hydrocoll. 2018, 78, 2–14. [Google Scholar] [CrossRef]
- Boukroufa, M.; Boutekedjiret, C.; Petigny, L.; Rakotomanomana, N.; Chemat, F. Bio-refinery of orange peels waste: A new concept based on integrated green and solvent free extraction processes using ultrasound and microwave techniques to obtain essential oil, polyphenols and pectin. Ultrason. Sonochem. 2015, 24, 72–79. [Google Scholar] [CrossRef] [PubMed]
- Hilali, S.; Fabiano-Tixier, A.S.; Ruiz, K.; Hejjaj, A.; Ait Nouh, F.; Idlimam, A.; Bily, A.; Mandi, L.; Chemat, F. Green extraction of essential oils, polyphenols, and pectins from orange peel employing solar energy: Toward a zero-waste biorefinery. ACS Sustain. Chem. Eng. 2019, 7, 11815–11822. [Google Scholar] [CrossRef]
- Holkar, C.R.; Jadhav, A.J.; Pinjari, D.V.; Pandit, A.B. Cavitationally driven transformations: A technique of process intensification. Ind. Eng. Chem. Res. 2019, 58, 5797–5819. [Google Scholar] [CrossRef]
- Gogate, P.R.; Pandit, A.B. Hydrodynamic cavitation reactors: A state of the art review. Rev. Chem. Eng. 2001, 17, 1–85. [Google Scholar] [CrossRef]
- Pawar, S.K.; Mahulkar, A.V.; Pandit, A.B.; Roy, K.; Moholkar, V.S. Sonochemical effect induced by hydrodynamic cavitation: Comparison of venturi/orifice flow geometries. AIChE J. 2017, 63, 4705–4716. [Google Scholar] [CrossRef]
- Yasui, K.; Tuziuti, T.; Sivakumar, M.; Iida, Y. Sonoluminescence. Appl. Spectrosc. Rev. 2004, 39, 399–436. [Google Scholar] [CrossRef]
- Dindar, E. An overview of the application of hydrodinamic cavitation for the intensification of wastewater treatment applications: A review. Innov. Energy Res. 2016, 5, 1–7. [Google Scholar] [CrossRef]
- Doltade, S.B.; Dastane, G.G.; Jadhav, N.L.; Pandit, A.B.; Pinjari, D.V.; Somkuwar, N.; Paswan, R. Hydrodynamic cavitation as an imperative technology for the treatment of petroleum refinery effluent. J. Water Process Eng. 2019, 29, 100768. [Google Scholar] [CrossRef]
- Ciriminna, R.; Albanese, L.; Meneguzzo, F.; Pagliaro, M. Wastewater remediation via controlled hydrocavitation. Environ. Rev. 2017, 25, 175–183. [Google Scholar] [CrossRef]
- Carpenter, J.; Badve, M.; Rajoriya, S.; George, S.; Saharan, V.K.; Pandit, A.B. Hydrodynamic cavitation: An emerging technology for the intensification of various chemical and physical processes in a chemical process industry. Rev. Chem. Eng. 2017, 33, 433–468. [Google Scholar] [CrossRef]
- Panda, D.; Manickam, S. Cavitation technology—The future of greener extraction method: A review on the extraction of natural products and process intensification mechanism and perspectives. Appl. Sci. 2019, 9, 766. [Google Scholar] [CrossRef]
- Cravotto, G.; Mariatti, F.; Gunjevic, V.; Secondo, M.; Villa, M.; Parolin, J.; Cavaglià, G. Pilot scale cavitational reactors and other enabling technologies to design the industrial recovery of polyphenols from agro-food by-products, a technical and economical overview. Foods 2018, 7, 130. [Google Scholar] [CrossRef] [PubMed]
- Sarvothaman, V.P.; Simpson, A.T.; Ranade, V.V. Modelling of vortex based hydrodynamic cavitation reactors. Chem. Eng. J. 2018. [Google Scholar] [CrossRef]
- Asaithambi, N.; Singha, P.; Dwivedi, M.; Singh, S.K. Hydrodynamic cavitation and its application in food and beverage industry: A review. J. Food Process Eng. 2019, e13144. [Google Scholar] [CrossRef]
- Albanese, L.; Ciriminna, R.; Meneguzzo, F.; Pagliaro, M. Beer-brewing powered by controlled hydrodynamic cavitation: Theory and real-scale experiments. J. Clean. Prod. 2017, 142, 1457–1470. [Google Scholar] [CrossRef] [Green Version]
- Albanese, L.; Ciriminna, R.; Meneguzzo, F.; Pagliaro, M. Innovative beer-brewing of typical, old and healthy wheat varieties to boost their spreading. J. Clean. Prod. 2018, 171, 297–311. [Google Scholar] [CrossRef]
- Albanese, L.; Bonetti, A.; D’Acqui, L.P.; Meneguzzo, F.; Zabini, F. Affordable production of antioxidant aqueous solutions by hydrodynamic cavitation processing of silver fir (Abies Alba Mill.) needles. Foods 2019, 8, 65. [Google Scholar] [CrossRef]
- Albanese, L.; Meneguzzo, F. 10—Hydrodynamic cavitation technologies: A pathway to more sustainable, healthier beverages, and food supply chains. In Processing and Sustainability of Beverages; Grumezescu, A.M., Holban, A.M., Eds.; Woodhead Publishing: Sawston, Cambridge, UK, 2019; pp. 319–372. ISBN 978-0-12-815259-1. [Google Scholar]
- Fernandez, M.E.; Ledesma, B.; Román, S.; Bonelli, P.R.; Cukierman, A.L. Development and characterization of activated hydrochars from orange peels as potential adsorbents for emerging organic contaminants. Bioresour. Technol. 2015, 183, 221–228. [Google Scholar] [CrossRef] [PubMed]
- Lam, S.S.; Liew, R.K.; Lim, X.Y.; Ani, F.N.; Jusoh, A. Fruit waste as feedstock for recovery by pyrolysis technique. Int. Biodeterior. Biodegrad. 2016, 113, 325–333. [Google Scholar] [CrossRef]
- Ciriminna, R.; Albanese, L.; Di Stefano, V.; Delisi, R.; Avellone, G.; Meneguzzo, F.; Pagliaro, M. Beer produced via hydrodynamic cavitation retains higher amounts of xanthohumol and other hops prenylflavonoids. LWT Food Sci. Technol. 2018, 91, 160–167. [Google Scholar] [CrossRef]
- Albanese, L.; Ciriminna, R.; Meneguzzo, F.; Pagliaro, M. Gluten reduction in beer by hydrodynamic cavitation assisted brewing of barley malts. LWT Food Sci. Technol. 2017, 82, 342–353. [Google Scholar] [CrossRef]
- CAVIBEER | CNR & Bysea S.r.l. Cavibeer. Available online: http://www.cavibeer.com/ (accessed on 25 July 2019).
- Albanese, L.; Baronti, S.; Liguori, F.; Meneguzzo, F.; Barbaro, P.; Vaccari, F.P. Hydrodynamic cavitation as an energy efficient process to increase biochar surface area and porosity: A case study. J. Clean. Prod. 2019, 210, 159–169. [Google Scholar] [CrossRef]
- Albanese, L.; Ciriminna, R.; Meneguzzo, F.; Pagliaro, M. Energy efficient inactivation of Saccharomyces cerevisiae via controlled hydrodynamic cavitation. Energy Sci. Eng. 2015, 3, 221–238. [Google Scholar] [CrossRef]
- Carpenter, J.; George, S.; Saharan, V.K. Low pressure hydrodynamic cavitating device for producing highly stable oil in water emulsion: Effect of geometry and cavitation number. Chem. Eng. Process. Process Intensif. 2017, 116, 97–104. [Google Scholar] [CrossRef]
- Ciriminna, R.; Albanese, L.; Meneguzzo, F.; Pagliaro, M. Hydrogen Peroxide: A key chemical for today’s sustainable development. ChemSusChem 2016, 9, 3374–3381. [Google Scholar] [CrossRef]
- Yusaf, T.; Al-Juboori, R.A. Alternative methods of microorganism disruption for agricultural applications. Appl. Energy 2014, 114, 909–923. [Google Scholar] [CrossRef]
- Yan, Y.; Thorpe, R.B. Flow regime transitions due to cavitation in the flow through an orifice. Int. J. Multiph. Flow 1990, 16, 1023–1045. [Google Scholar] [CrossRef]
- Bagal, M.V.; Gogate, P.R. Wastewater treatment using hybrid treatment schemes based on cavitation and Fenton chemistry: A review. Ultrason. Sonochem. 2014, 21, 1–14. [Google Scholar] [CrossRef] [PubMed]
- Gogate, P.R. Cavitation: An auxiliary technique in wastewater treatment schemes. Adv. Environ. Res. 2002, 6, 335–358. [Google Scholar] [CrossRef]
- Šarc, A.; Kosel, J.; Stopar, D.; Oder, M.; Dular, M. Removal of bacteria Legionella pneumophila, Escherichia coli, and Bacillus subtilis by (super)cavitation. Ultrason. Sonochem. 2018, 42, 228–236. [Google Scholar] [CrossRef] [PubMed]
- King, A.J.; Dickinson, J.R. Biotransformation of hop aroma terpenoids by ale and lager yeasts. FEMS Yeast Res. 2003, 3, 53–62. [Google Scholar] [CrossRef] [PubMed] [Green Version]
- Dickinson, J.R. Terpenoids in Beer. In Beer in Health and Disease Prevention; Preedy, V.R., Ed.; Academic Press: San Diego, CA, USA, 2009; pp. 327–332. ISBN 9780123738912. [Google Scholar]
- Angelidaki, I.; Alves, M.; Bolzonella, D.; Borzacconi, L.; Campos, J.L.; Guwy, A.J.; Kalyuzhnyi, S.; Jenicek, P.; Van Lier, J.B. Defining the biomethane potential (BMP) of solid organic wastes and energy crops: A proposed protocol for batch assays. Water Sci. Technol. 2009, 59, 927–934. [Google Scholar] [CrossRef] [PubMed]
- Buswell, A.M.; Mueller, H.F. Mechanism of methane fermentation. Ind. Eng. Chem. 1952, 44, 550–552. [Google Scholar] [CrossRef]
- Mohnen, D. Pectin structure and biosynthesis. Curr. Opin. Plant Biol. 2008, 11, 266–277. [Google Scholar] [CrossRef]
- Morra, M.; Cassinelli, C.; Cascardo, G.; Nagel, M.D.; Della Volpe, C.; Siboni, S.; Maniglio, D.; Brugnara, M.; Ceccone, G.; Schols, H.A.; Ulvskov, P. Effects on interfacial properties and cell adhesion of surface modification by pectic hairy regions. Biomacromolecules 2004, 5, 2094–2104. [Google Scholar] [CrossRef]
- Morris, G.A.; Foster, T.J.; Harding, S.E. The effect of the degree of esterification on the hydrodynamic properties of citrus pectin. Food Hydrocoll. 2000, 14, 227–235. [Google Scholar] [CrossRef]
- McConaughy, S.D.; Stroud, P.A.; Boudreaux, B.; Hester, R.D.; McCormick, C.L. Structural characterization and solution properties of a galacturonate polysaccharide derived from Aloe vera capable of in situ gelation. Biomacromolecules 2008, 9, 472–480. [Google Scholar] [CrossRef]
- Zhao, S.; Yang, F.; Liu, Y.; Sun, D.; Xiu, Z.; Ma, X.; Zhang, Y.; Sun, G. Study of chemical characteristics, gelation properties and biological application of calcium pectate prepared using apple or citrus pectin. Int. J. Biol. Macromol. 2018, 109, 180–187. [Google Scholar] [CrossRef] [PubMed]
- Yang, L.; Kruse, B. Revised Kubelka–Munk theory I theory and application. J. Opt. Soc. Am. A 2004, 21, 1933. [Google Scholar] [CrossRef]
- Khan, M.K.; Abert-Vian, M.; Fabiano-Tixier, A.S.; Dangles, O.; Chemat, F. Ultrasound-assisted extraction of polyphenols (flavanone glycosides) from orange (Citrus sinensis L.) peel. Food Chem. 2010, 119, 851–858. [Google Scholar] [CrossRef]
- Raffa, K.F.; Smalley, E.B. Interaction of pre-attack and induced monoterpene concentrations in host conifer defense against bark beetle-fungal complexes. Oecologia 1995, 102, 285–295. [Google Scholar] [CrossRef] [PubMed]
- Filippov, M.P. IR spectra of pectin films. J. Appl. Spectrosc. 1974, 17, 1052–1054. [Google Scholar] [CrossRef]
- Synytsya, A.; Čopíková, J.; Matějka, P.; Machovič, V. Fourier transform Raman and infrared spectroscopy of pectins. Carbohydr. Polym. 2003, 54, 97–106. [Google Scholar] [CrossRef]
- Chatjigakis, A.K.; Pappas, C.; Proxenia, N.; Kalantzi, O.; Rodis, P.; Polissiou, M. FT-IR spectroscopic determination of the degree of esterification of cell wall pectins from stored peaches and correlation to textural changes. Carbohydr. Polym. 1998, 37, 395–408. [Google Scholar] [CrossRef]
- Assifaoui, A.; Loupiac, C.; Chambin, O.; Cayot, P. Structure of calcium and zinc pectinate films investigated by FTIR spectroscopy. Carbohydr. Res. 2010, 345, 929–933. [Google Scholar] [CrossRef]
- Monsoor, M.A.; Kalapathy, U.; Proctor, A. Improved method for determination of pectin degree of esterification by diffuse reflectance Fourier transform infrared spectroscopy. J. Agric. Food Chem. 2001, 49, 2756–2760. [Google Scholar] [CrossRef]
- Nkhili, E.; Tomao, V.; El Hajji, H.; El Boustani, E.S.; Chemat, F.; Dangles, O. Microwave-assisted water extraction of green tea polyphenols. Phytochem. Anal. 2009, 20, 408–415. [Google Scholar] [CrossRef]
- Albanese, L.; Meneguzzo, F. 7—Hydrodynamic cavitation-assisted processing of vegetable beverages: Review and the case of beer-brewing. In Production and Management of Beverages; Grumezescu, A.M., Holban, A.M., Eds.; Woodhead Publishing: Sawston, Cambridge, 2019; pp. 211–257. ISBN 978-0-12-815260-7. [Google Scholar]
- Ciriminna, R.; Fidalgo, A.; Delisi, R.; Tamburino, A.; Carnaroglio, D.; Cravotto, G.; Ilharco, L.M.; Pagliaro, M. Controlling the degree of esterification of citrus pectin for demanding applications by selection of the source. ACS Omega 2017, 2, 7991–7995. [Google Scholar] [CrossRef] [PubMed]
- Ciriminna, R.; Meneguzzo, F.; Pagliaro, M. Orange oil. In Green Pesticides Handbook: Essential Oils for Pest Control; Nollet, L.M.L., Rathore, H.S., Eds.; CRC Press: Boca Raton, FL, USA, 2017; pp. 291–303. ISBN 978-1-49-875938-0. [Google Scholar]
- Maté, J.; Periago, P.M.; Palop, A. When nanoemulsified, d-limonene reduces Listeria monocytogenes heat resistance about one hundred times. Food Control 2016, 59, 824–828. [Google Scholar] [CrossRef] [Green Version]
- Ghasemi, S.; Jafari, S.M.; Assadpour, E.; Khomeiri, M. Production of pectin-whey protein nano-complexes as carriers of orange peel oil. Carbohydr. Polym. 2017, 177, 369–377. [Google Scholar] [CrossRef] [PubMed]
- Ghasemi, S.; Jafari, S.M.; Assadpour, E.; Khomeiri, M. Nanoencapsulation of D-limonene within nanocarriers produced by pectin-whey protein complexes. Food Hydrocoll. 2018, 77, 152–162. [Google Scholar] [CrossRef]
- Wu, Z.; Tagliapietra, S.; Giraudo, A.; Martina, K.; Cravotto, G. Harnessing cavitational effects for green process intensification. Ultrason. Sonochem. 2019, 52, 530–546. [Google Scholar] [CrossRef]
- Razzaghi, S.E.; Arabhosseini, A.; Turk, M.; Soubrat, T.; Cendres, A.; Kianmehr, M.H.; Perino, S.; Chemat, F. Operational efficiencies of six microwave based extraction methods for orange peel oil. J. Food Eng. 2019, 241, 26–32. [Google Scholar] [CrossRef]
- Chemat, F.; Vian, M.A.; Cravotto, G. Green extraction of natural products: Concept and principles. Int. J. Mol. Sci. 2012, 13, 8615–8627. [Google Scholar] [CrossRef]


| Test | Water Volume (L) | WOP Mass (kg) | Test Duration (min) | Temperature (°C) |
|---|---|---|---|---|
| WOP1 | 120 | 42 | 270 | 14.5–96 |
| WOP2 | 147 | 6.38 | 127 | 18.5–80 |
| Sample | Moisture 1 | Ash | VS | C | H | N | S | Th-BMP 2 | CH4 3 | BMP 4 |
|---|---|---|---|---|---|---|---|---|---|---|
| T11 | 95.6 | 3.8 | 96.2 | 42.7 | 6.2 | 0.7 | 0.1 | 421.3 | 50.0 | 256 |
| T12 | 96.6 | 3.5 | 96.5 | 42.2 | 6.3 | 0.7 | 0.1 | 415.6 | 49.6 | 261 |
| T13 | 97.0 | 3.2 | 96.8 | 42.6 | 6.2 | 0.9 | 0.1 | 408.9 | 48.9 | 318 |
| T14 | 96.6 | 2.8 | 97.2 | 41.1 | 6.4 | 0.7 | 0.1 | 392.5 | 49.3 | 763 |
| Sample | Consumed Specific Energy | Specific Energy in the Generated Methane |
|---|---|---|
| T11 | 0.01 | 0.28 |
| T12 | 0.09 | 0.28 |
| T13 | 0.27 | 0.34 |
| T14 | 0.62 | 0.45 |
| Sample | Band Areas | C (cm−1) | FWHM (cm−1) | A(a.u.) | DE |
|---|---|---|---|---|---|
| P2 | νC = Oester νC = Oacid νasCOO− | 1741 1648 1608 | 47 18 137 | 28.03 3.37 125.50 | 0.1786 |
| P3 | νC = Oester νC = Oacid νasCOO− | 1740 1649 1609 | 50 19 143 | 28.67 3.04 135.42 | 0.1715 |
| P4 | νC = Oester νC = Oacid νasCOO− | 1741 1648 1610 | 48 18 148 | 28.66 3.05 140.55 | 0.1664 |
| P5 | νC = Oester νC = Oacid νasCOO− | 1741 1648 1610 | 47 19 149 | 28.55 3.09 140.87 | 0.1655 |
© 2019 by the authors. Licensee MDPI, Basel, Switzerland. This article is an open access article distributed under the terms and conditions of the Creative Commons Attribution (CC BY) license (http://creativecommons.org/licenses/by/4.0/).
Share and Cite
Meneguzzo, F.; Brunetti, C.; Fidalgo, A.; Ciriminna, R.; Delisi, R.; Albanese, L.; Zabini, F.; Gori, A.; dos Santos Nascimento, L.B.; De Carlo, A.; et al. Real-Scale Integral Valorization of Waste Orange Peel via Hydrodynamic Cavitation. Processes 2019, 7, 581. https://doi.org/10.3390/pr7090581
Meneguzzo F, Brunetti C, Fidalgo A, Ciriminna R, Delisi R, Albanese L, Zabini F, Gori A, dos Santos Nascimento LB, De Carlo A, et al. Real-Scale Integral Valorization of Waste Orange Peel via Hydrodynamic Cavitation. Processes. 2019; 7(9):581. https://doi.org/10.3390/pr7090581
Chicago/Turabian StyleMeneguzzo, Francesco, Cecilia Brunetti, Alexandra Fidalgo, Rosaria Ciriminna, Riccardo Delisi, Lorenzo Albanese, Federica Zabini, Antonella Gori, Luana Beatriz dos Santos Nascimento, Anna De Carlo, and et al. 2019. "Real-Scale Integral Valorization of Waste Orange Peel via Hydrodynamic Cavitation" Processes 7, no. 9: 581. https://doi.org/10.3390/pr7090581