A Feature Extraction Method Based on Differential Entropy and Linear Discriminant Analysis for Emotion Recognition

Abstract
:1. Introduction
2. Related Works
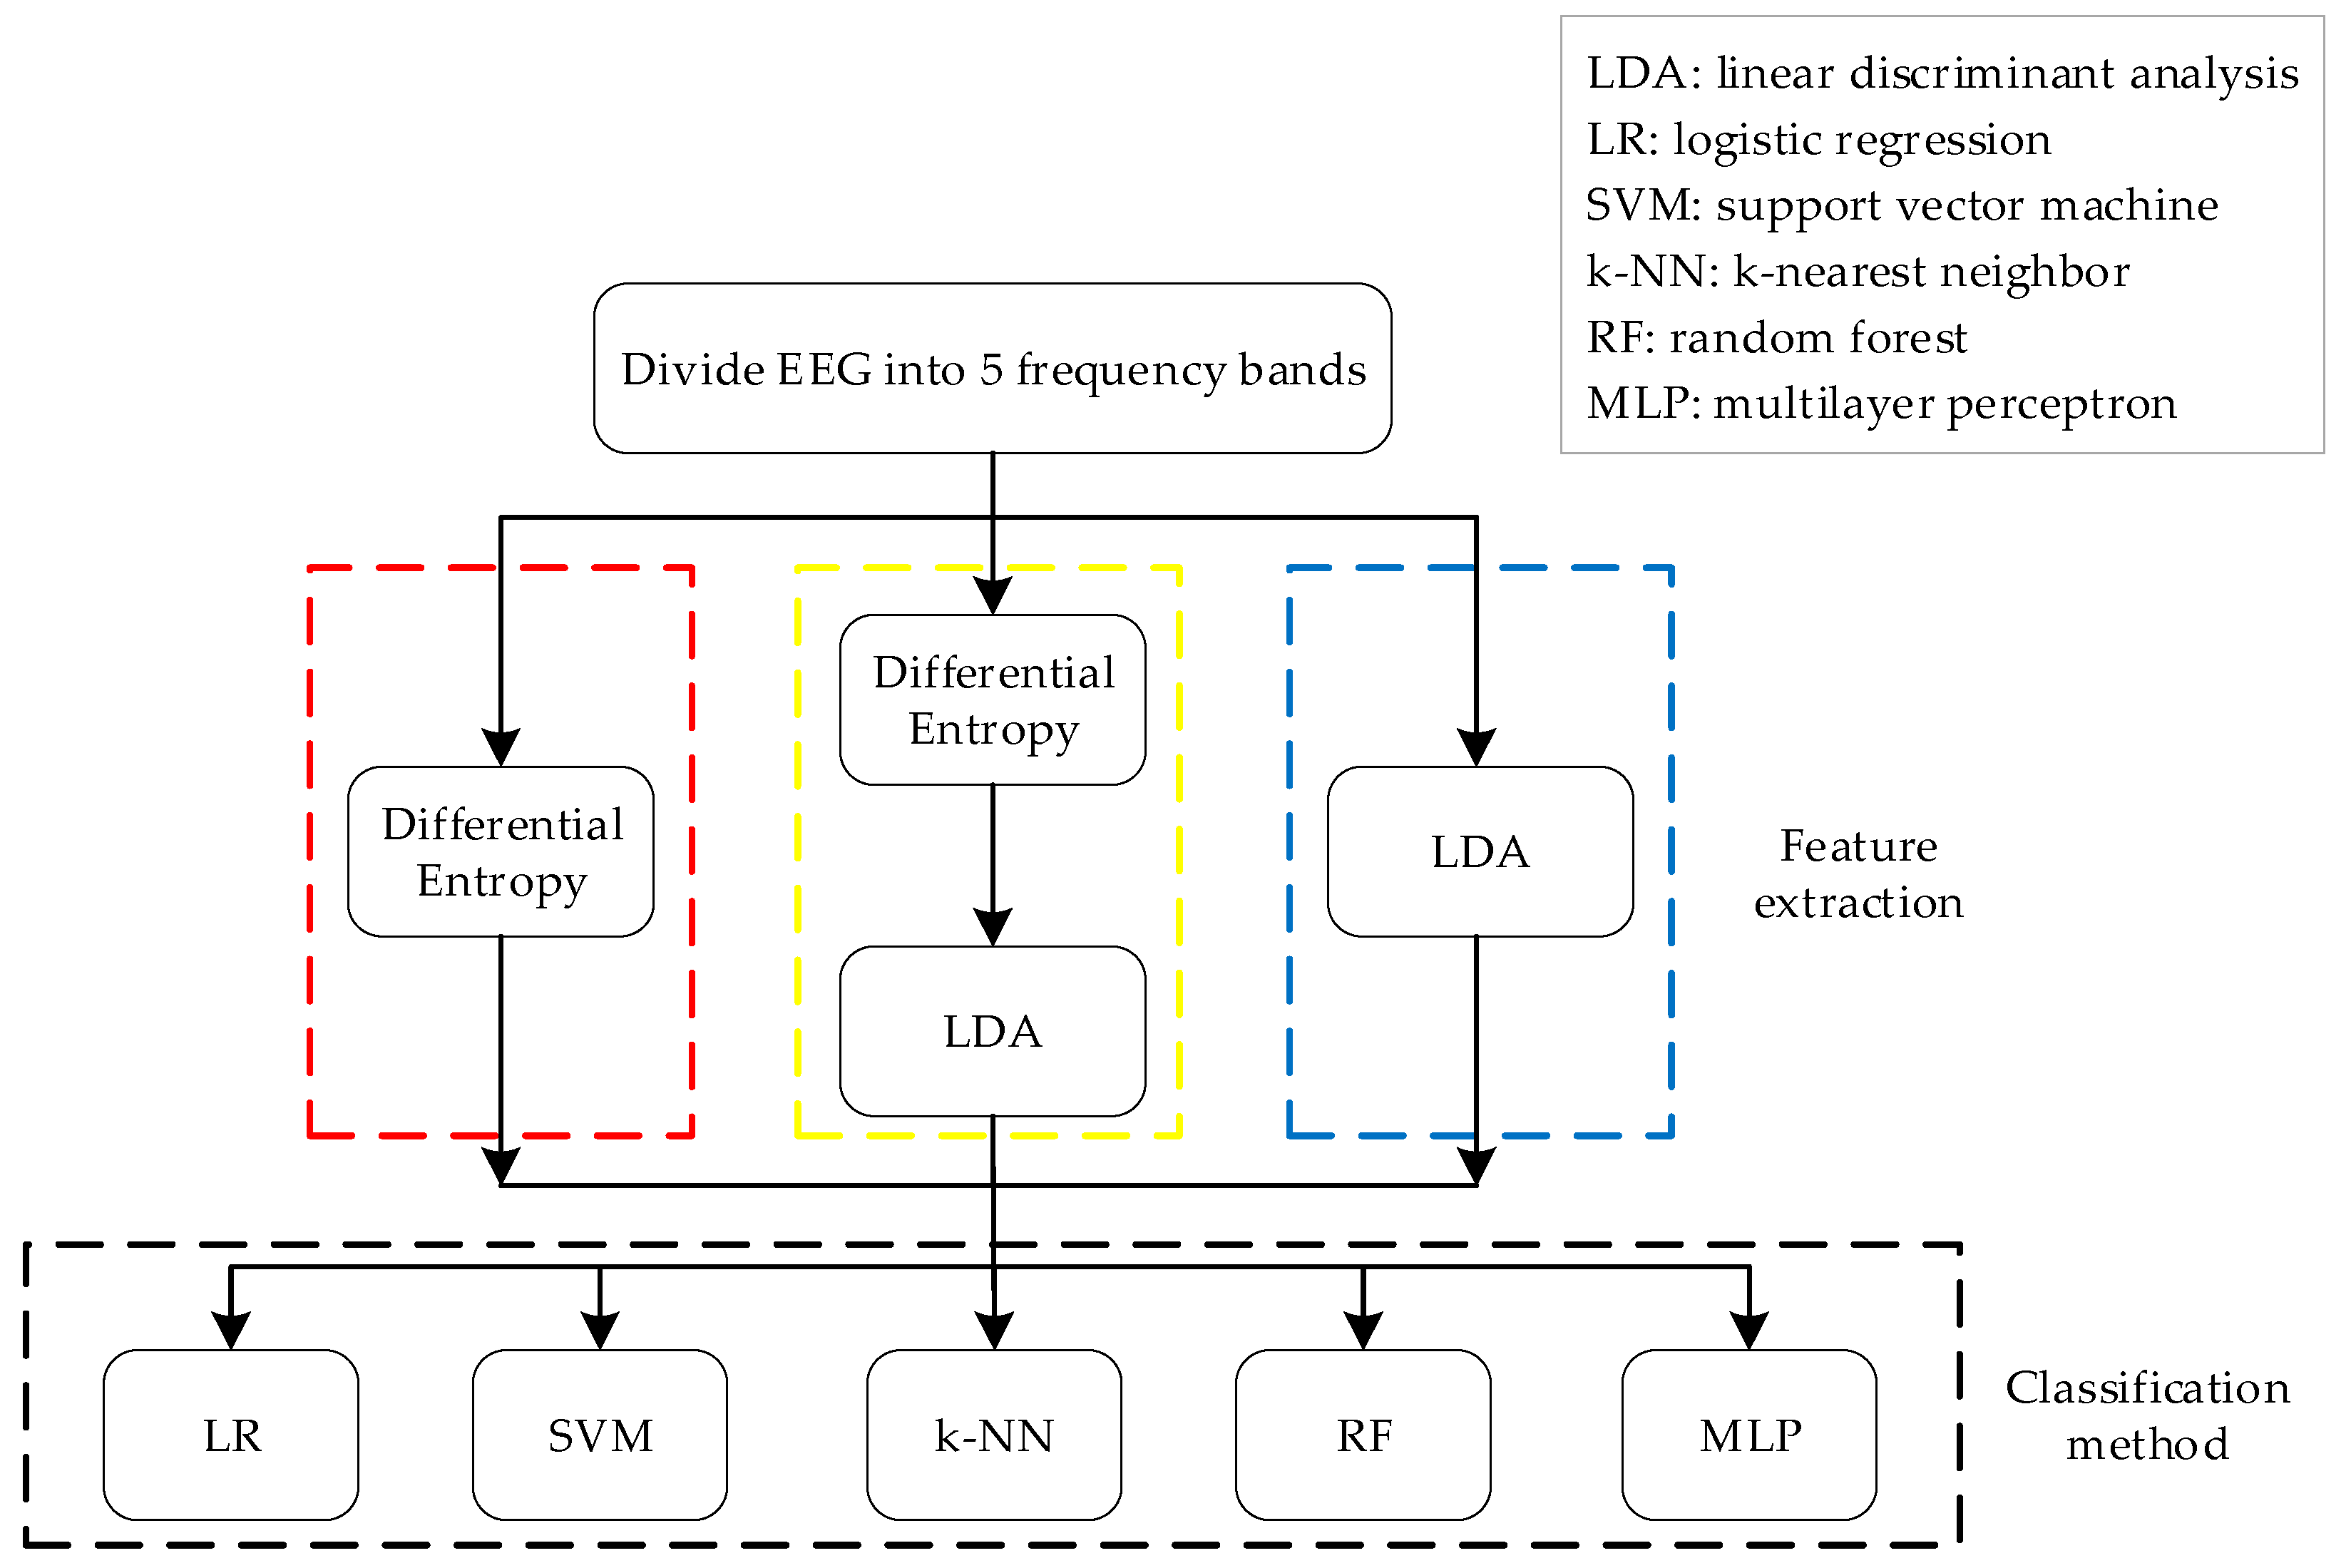
3. Our Method
3.1. Dataset
3.2. Methods
3.2.1. Signal Decomposition
3.2.2. Data Dimensionality Reduction
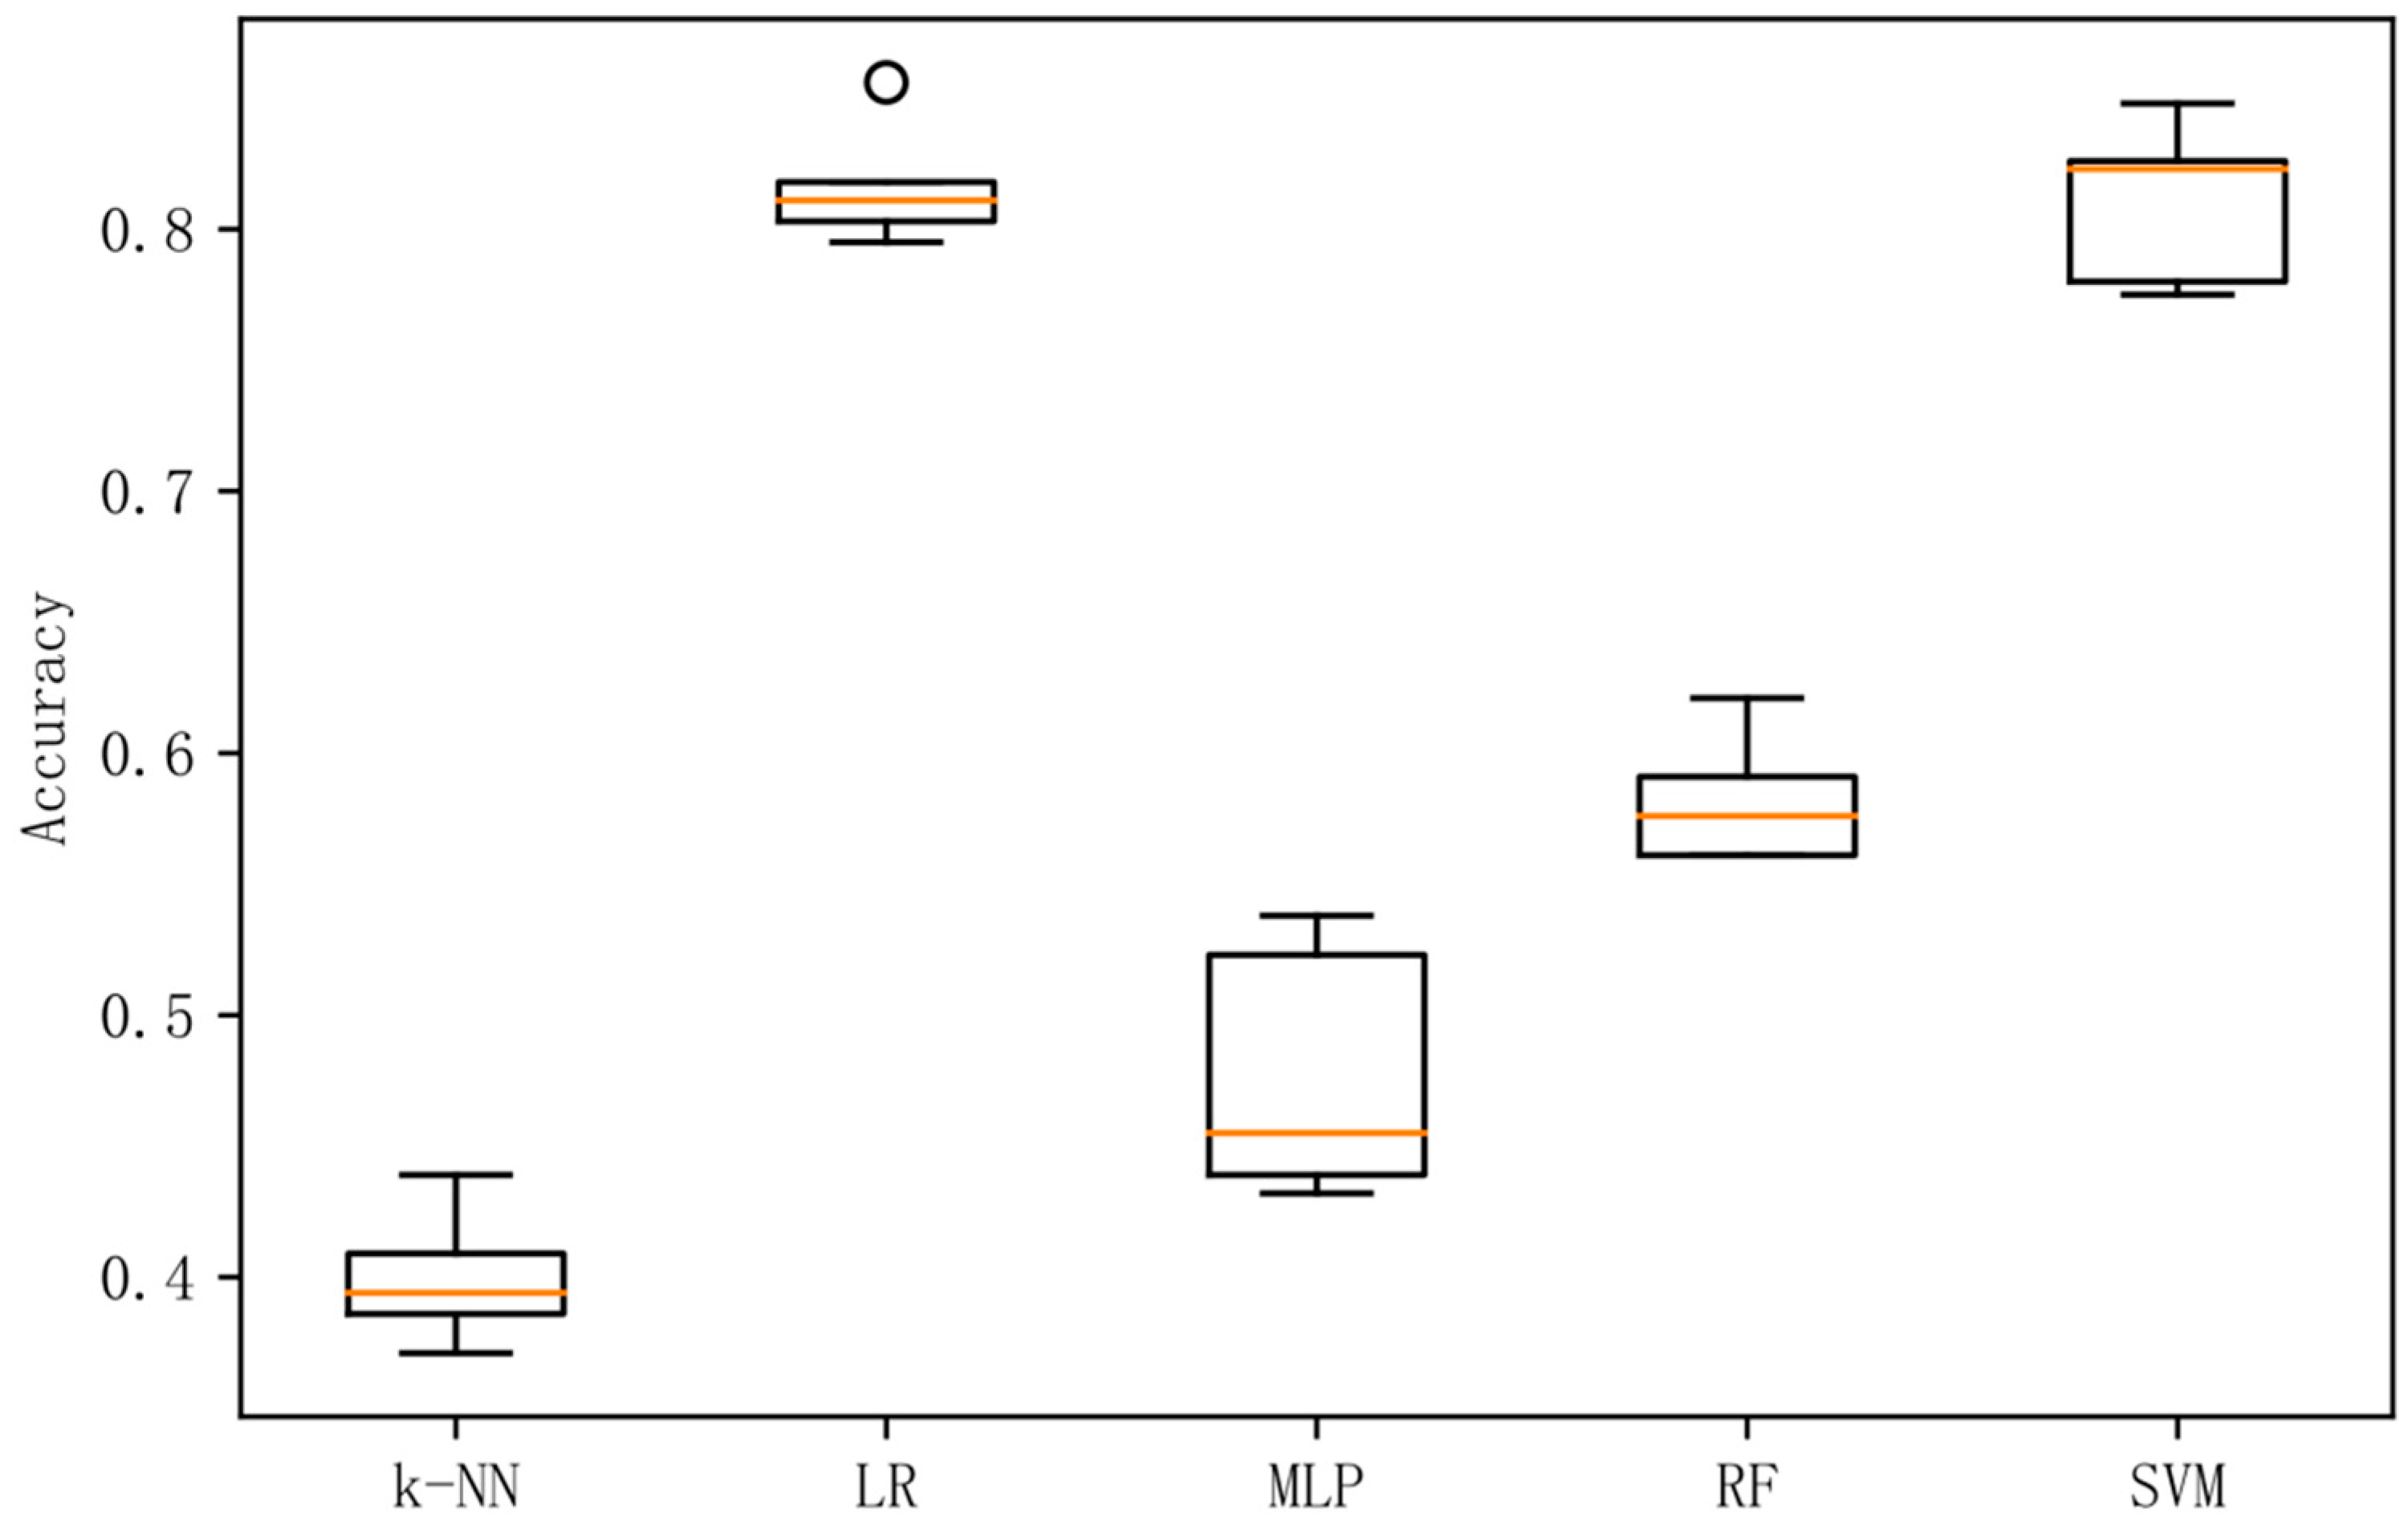
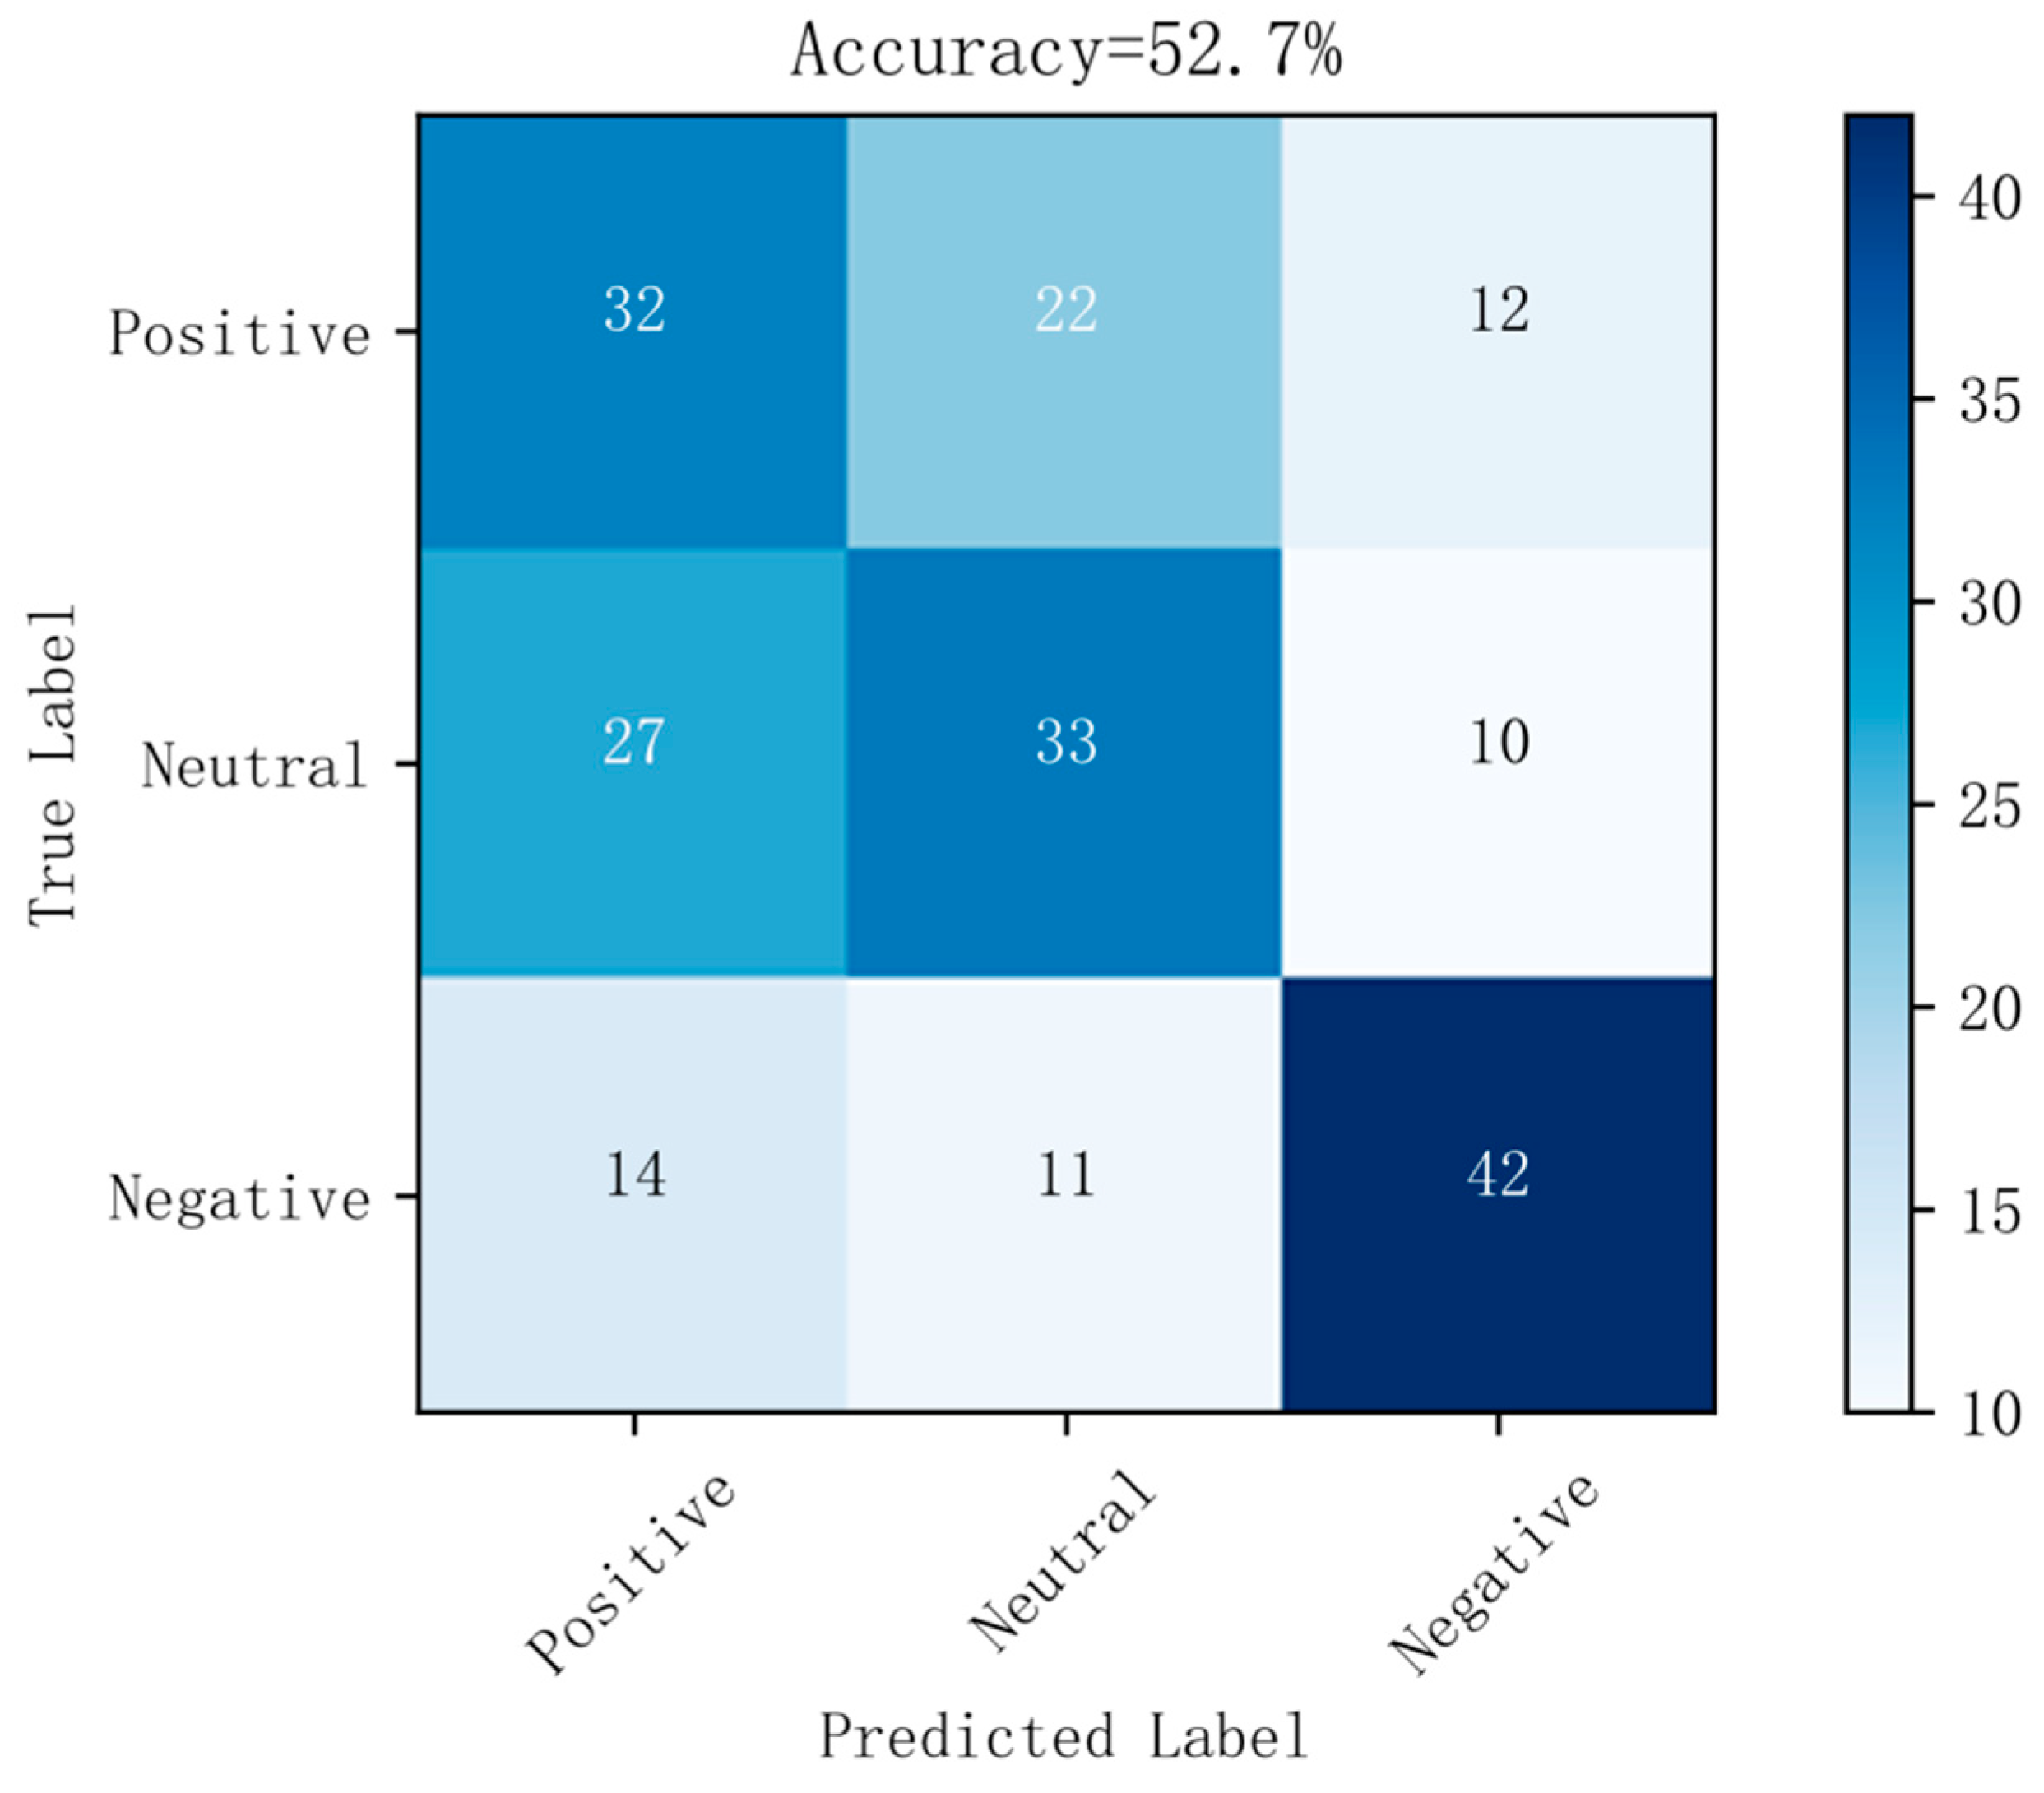
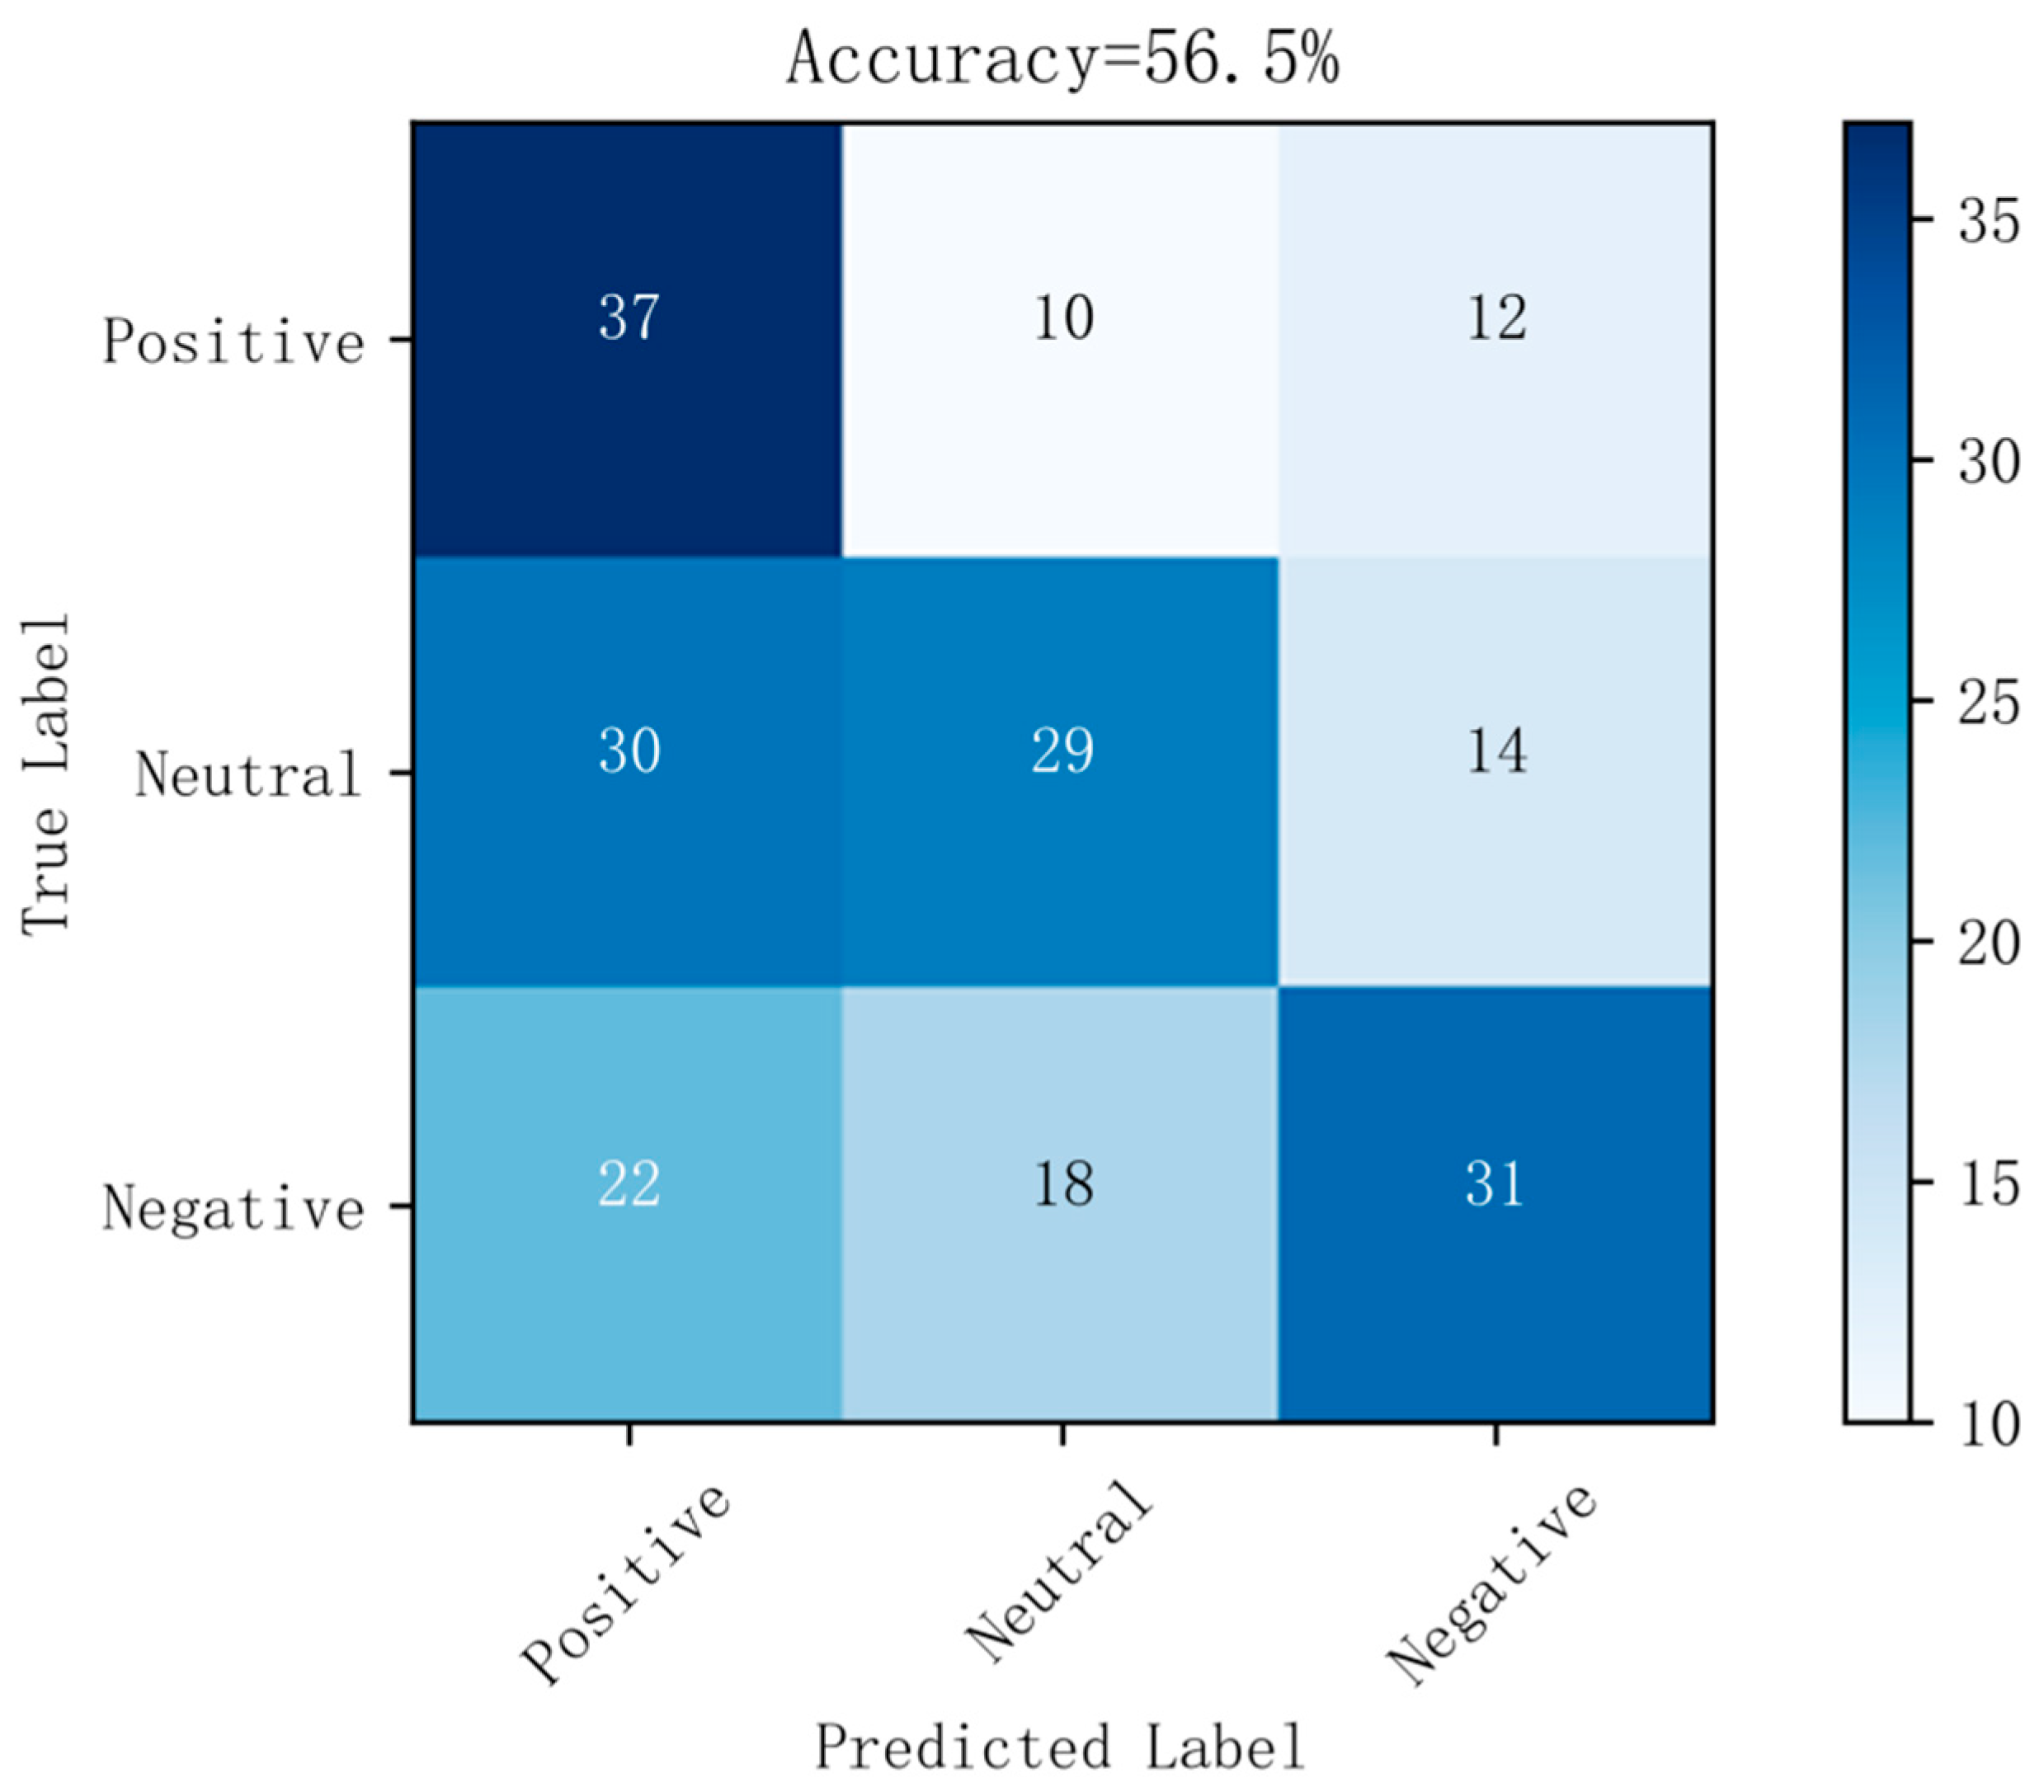
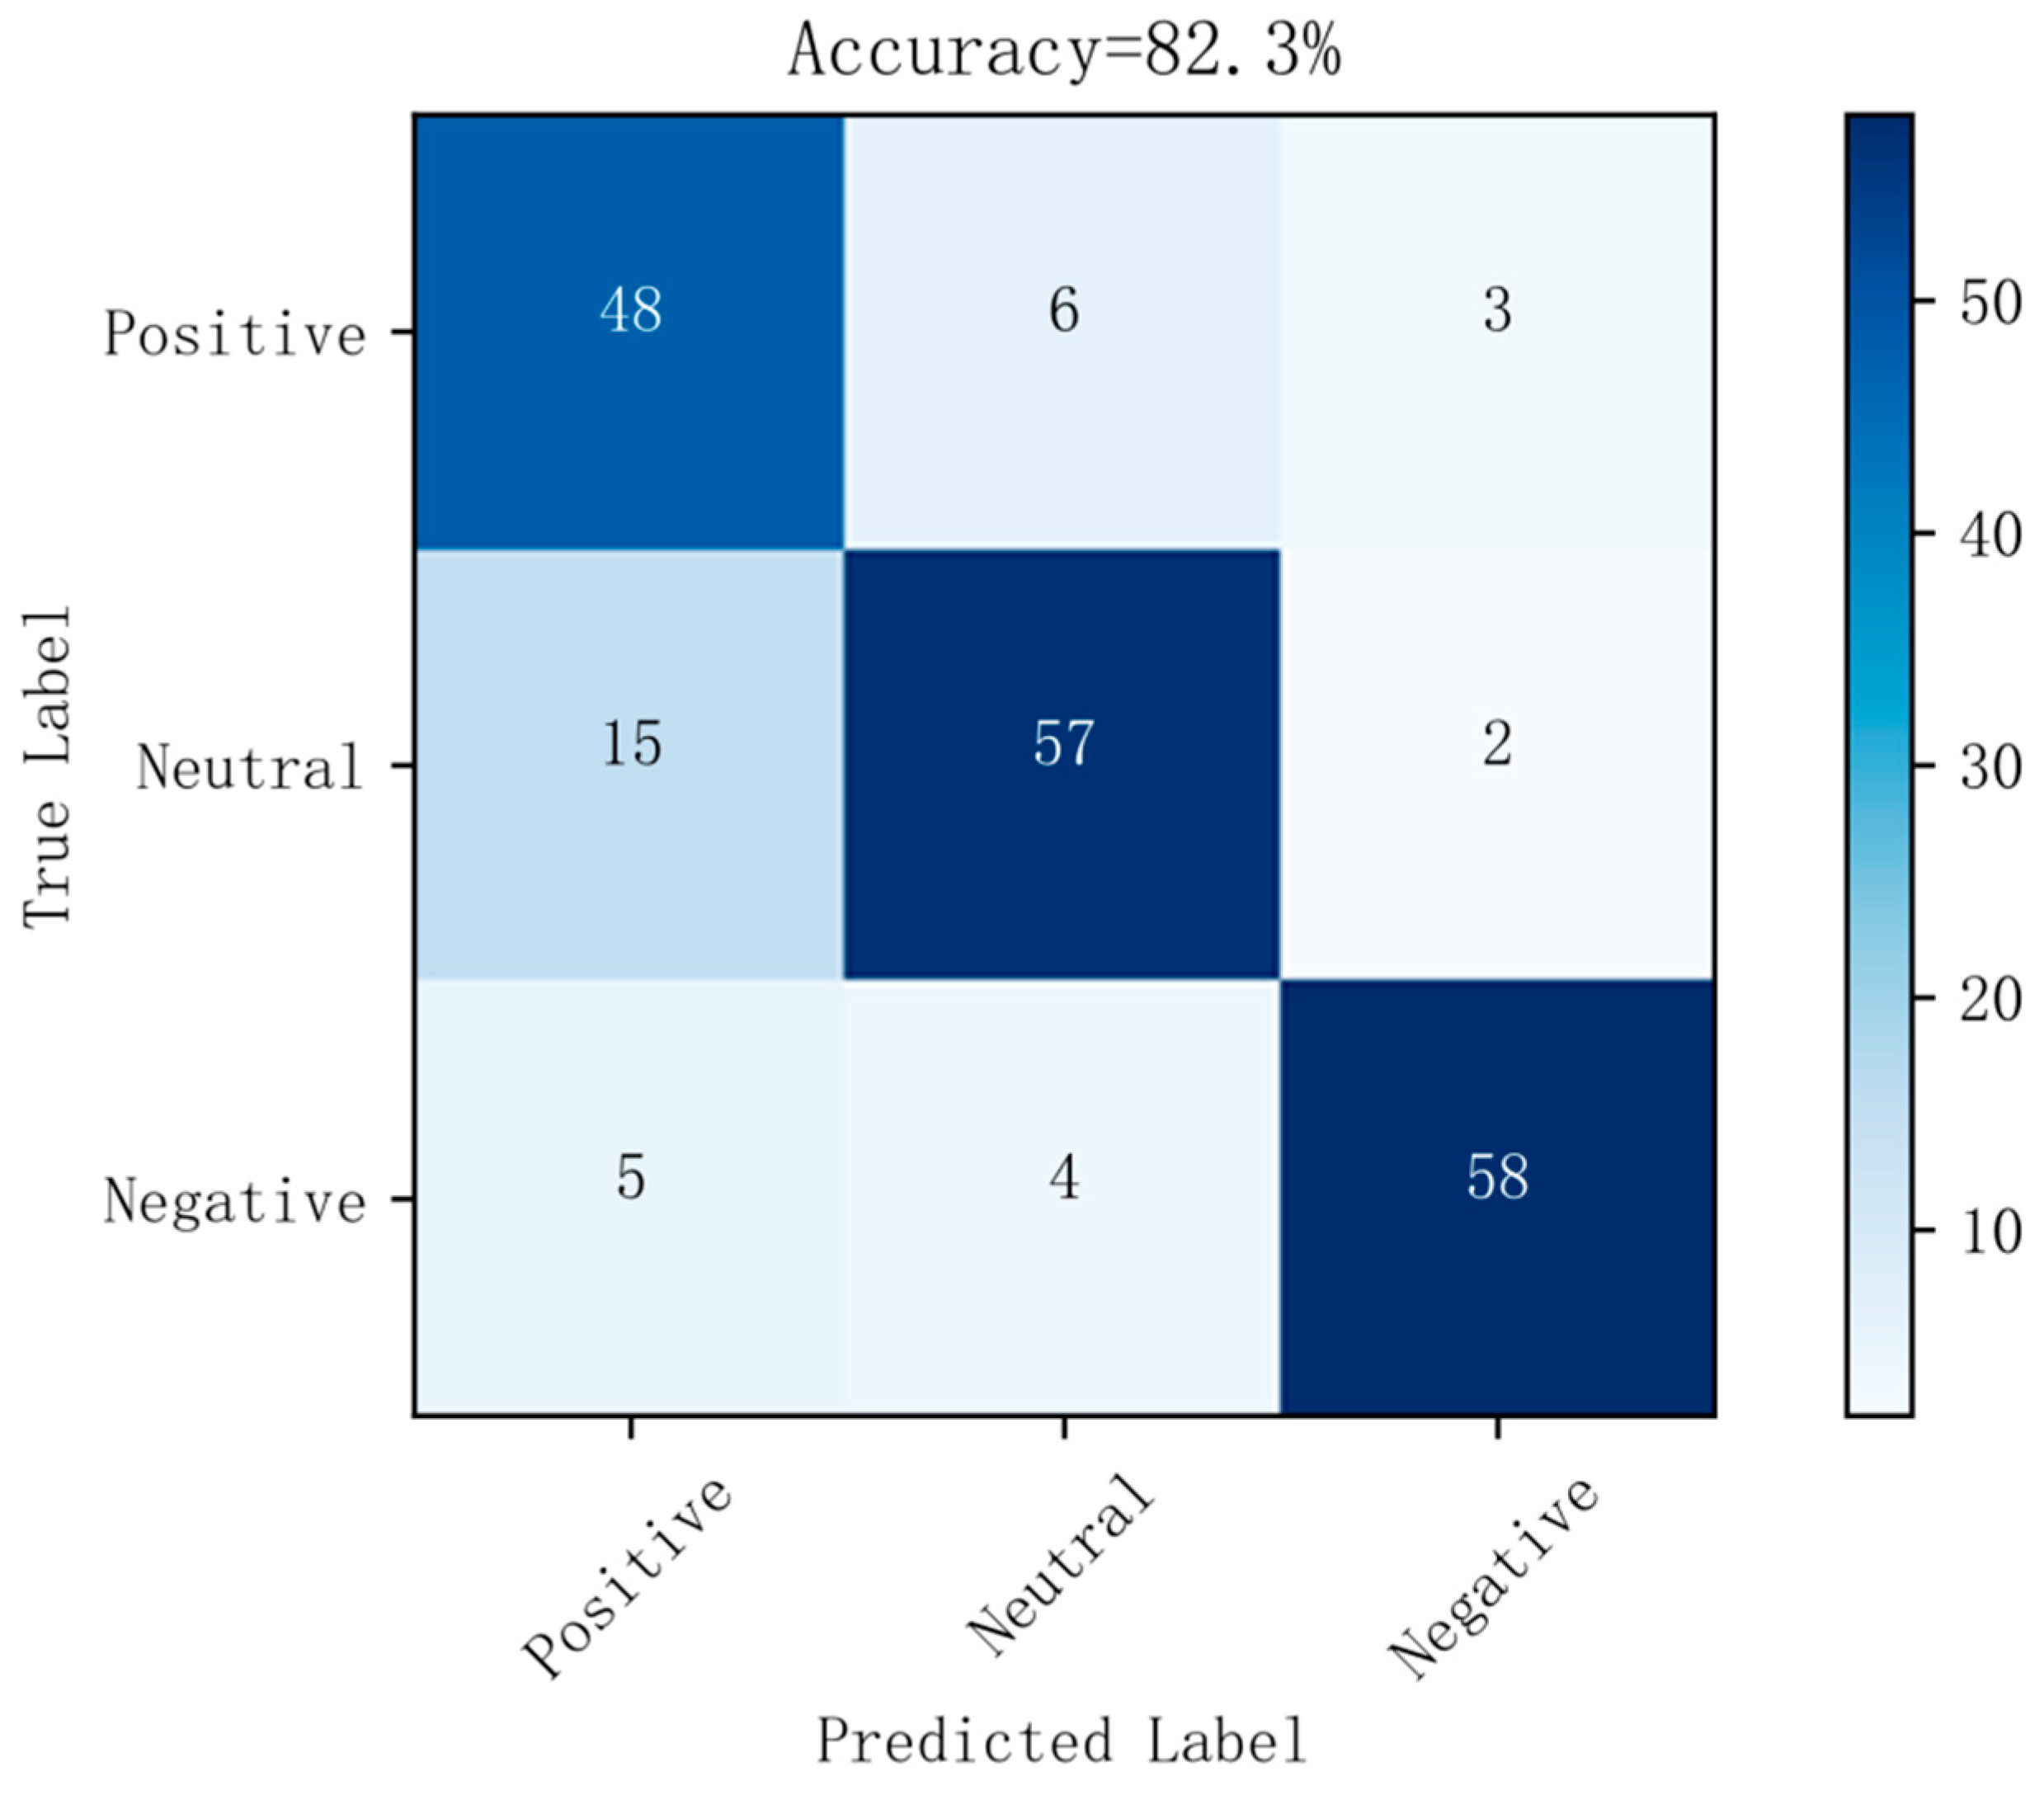
4. Results
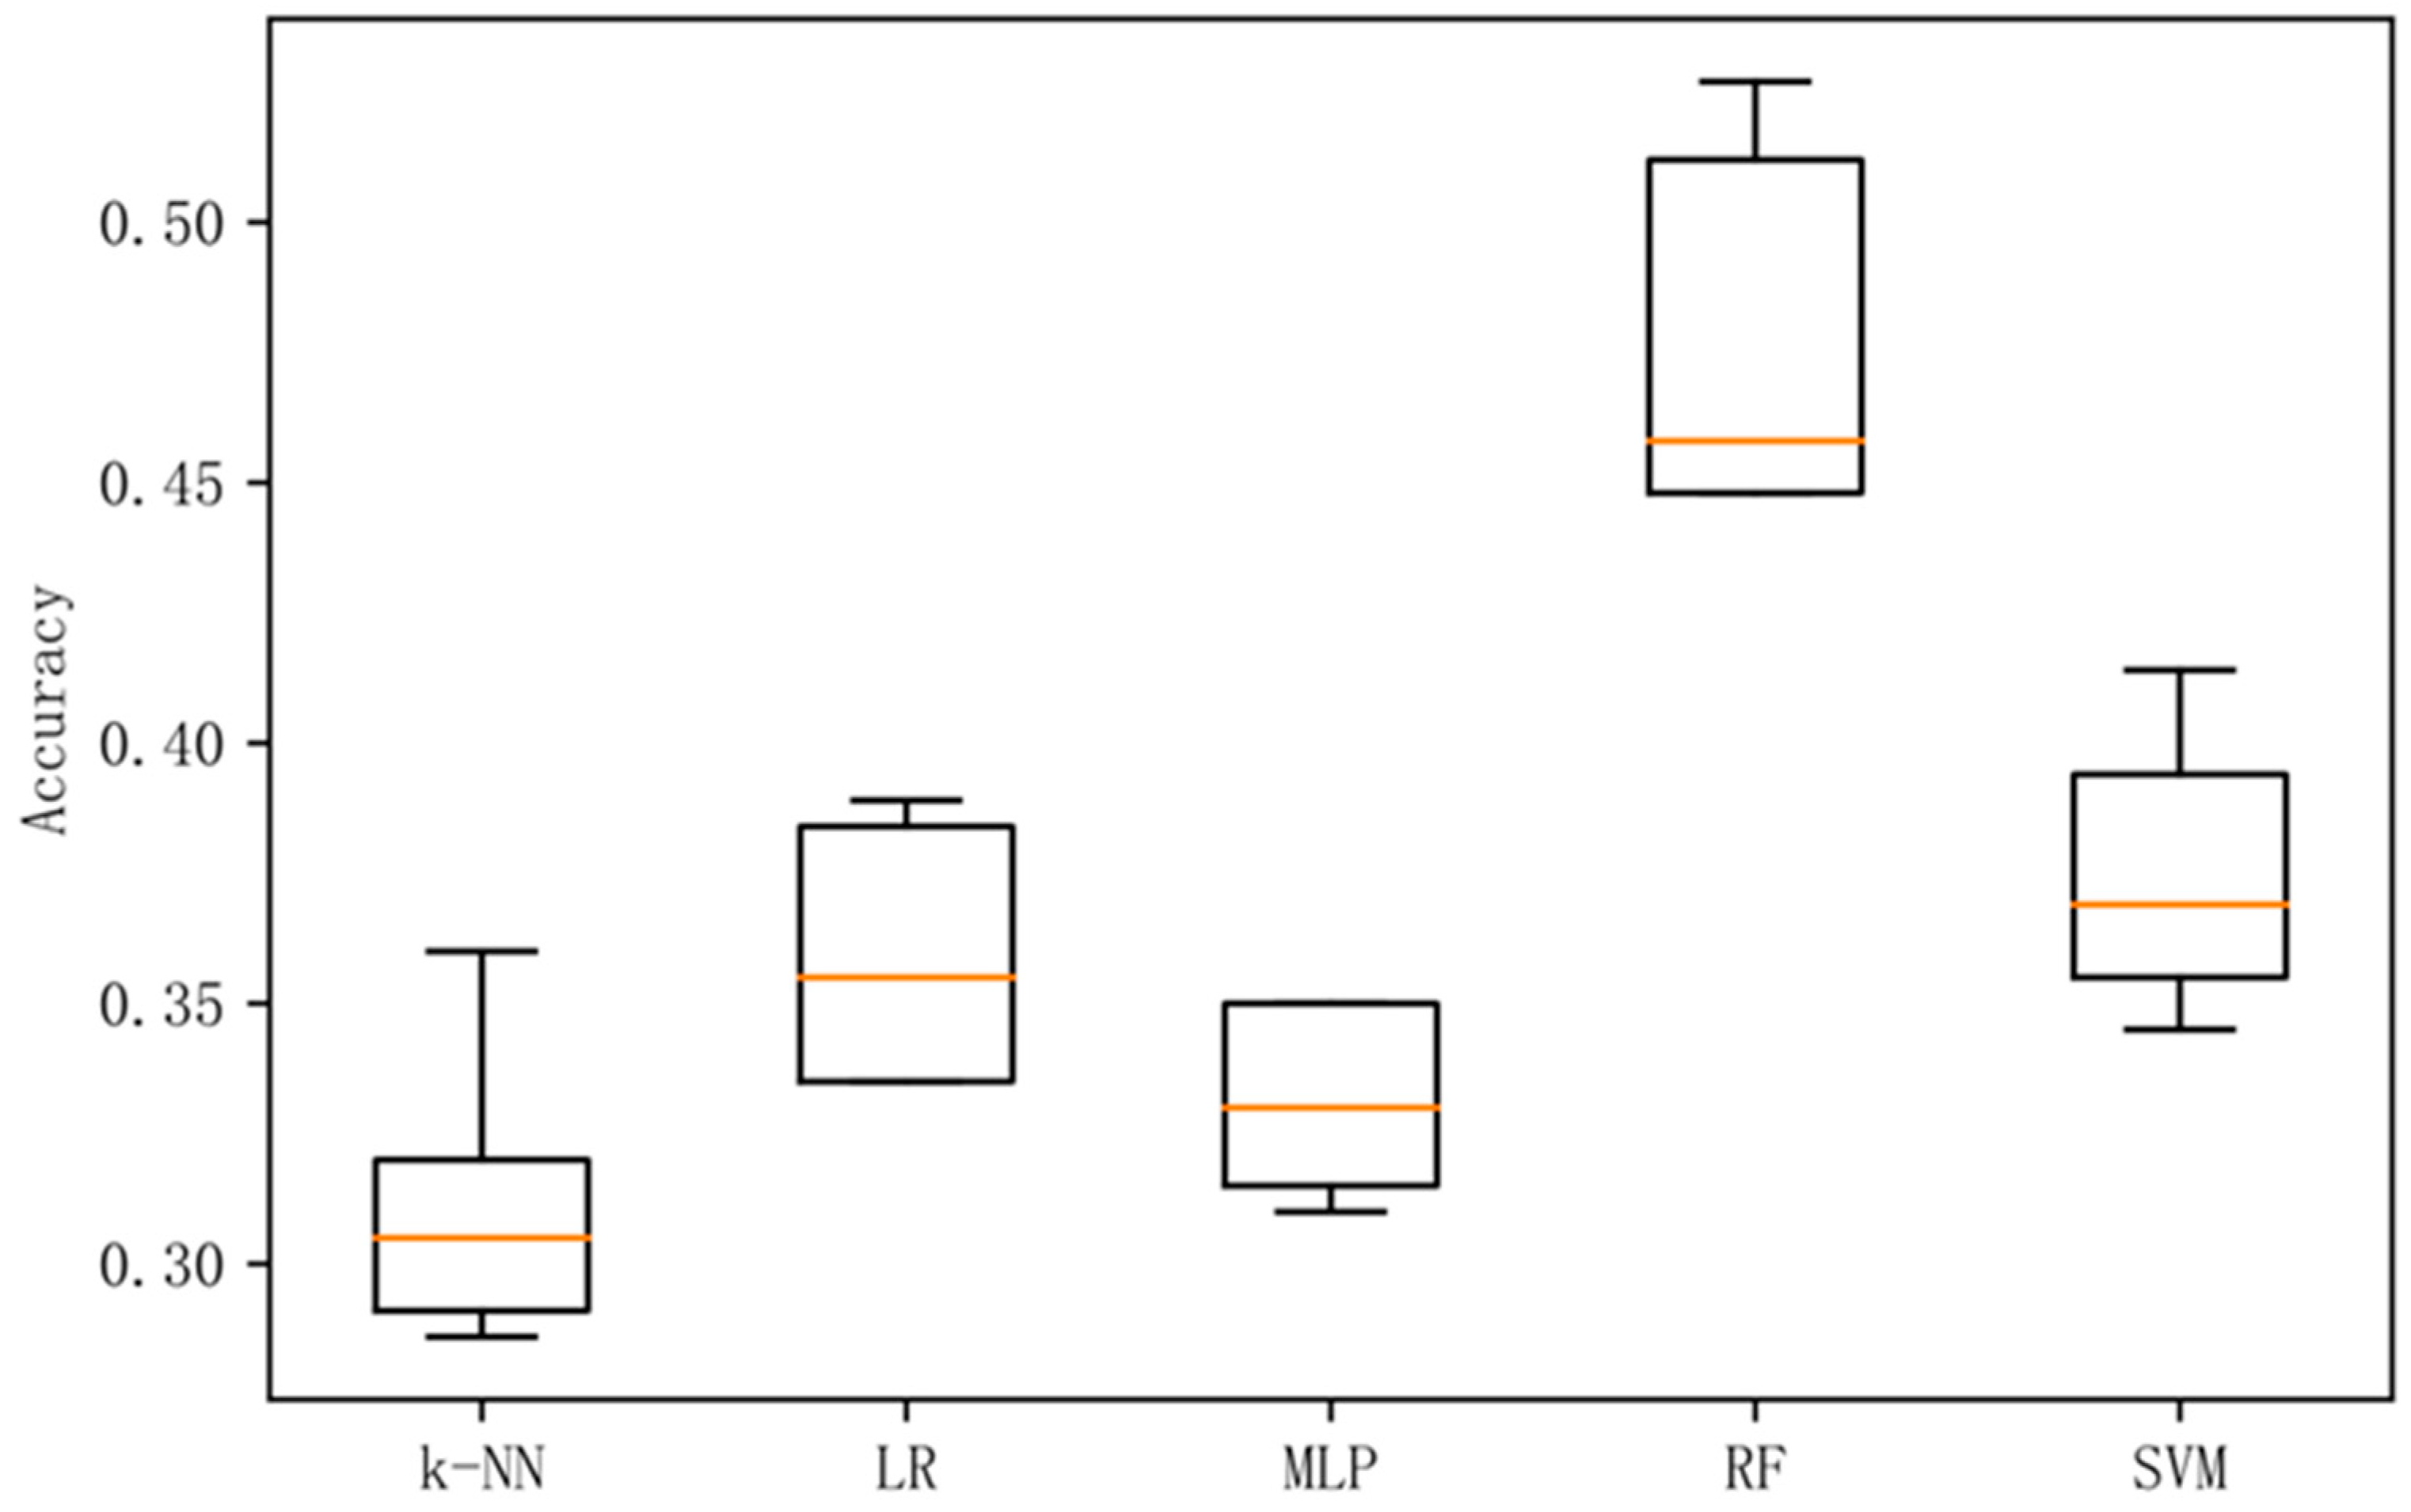
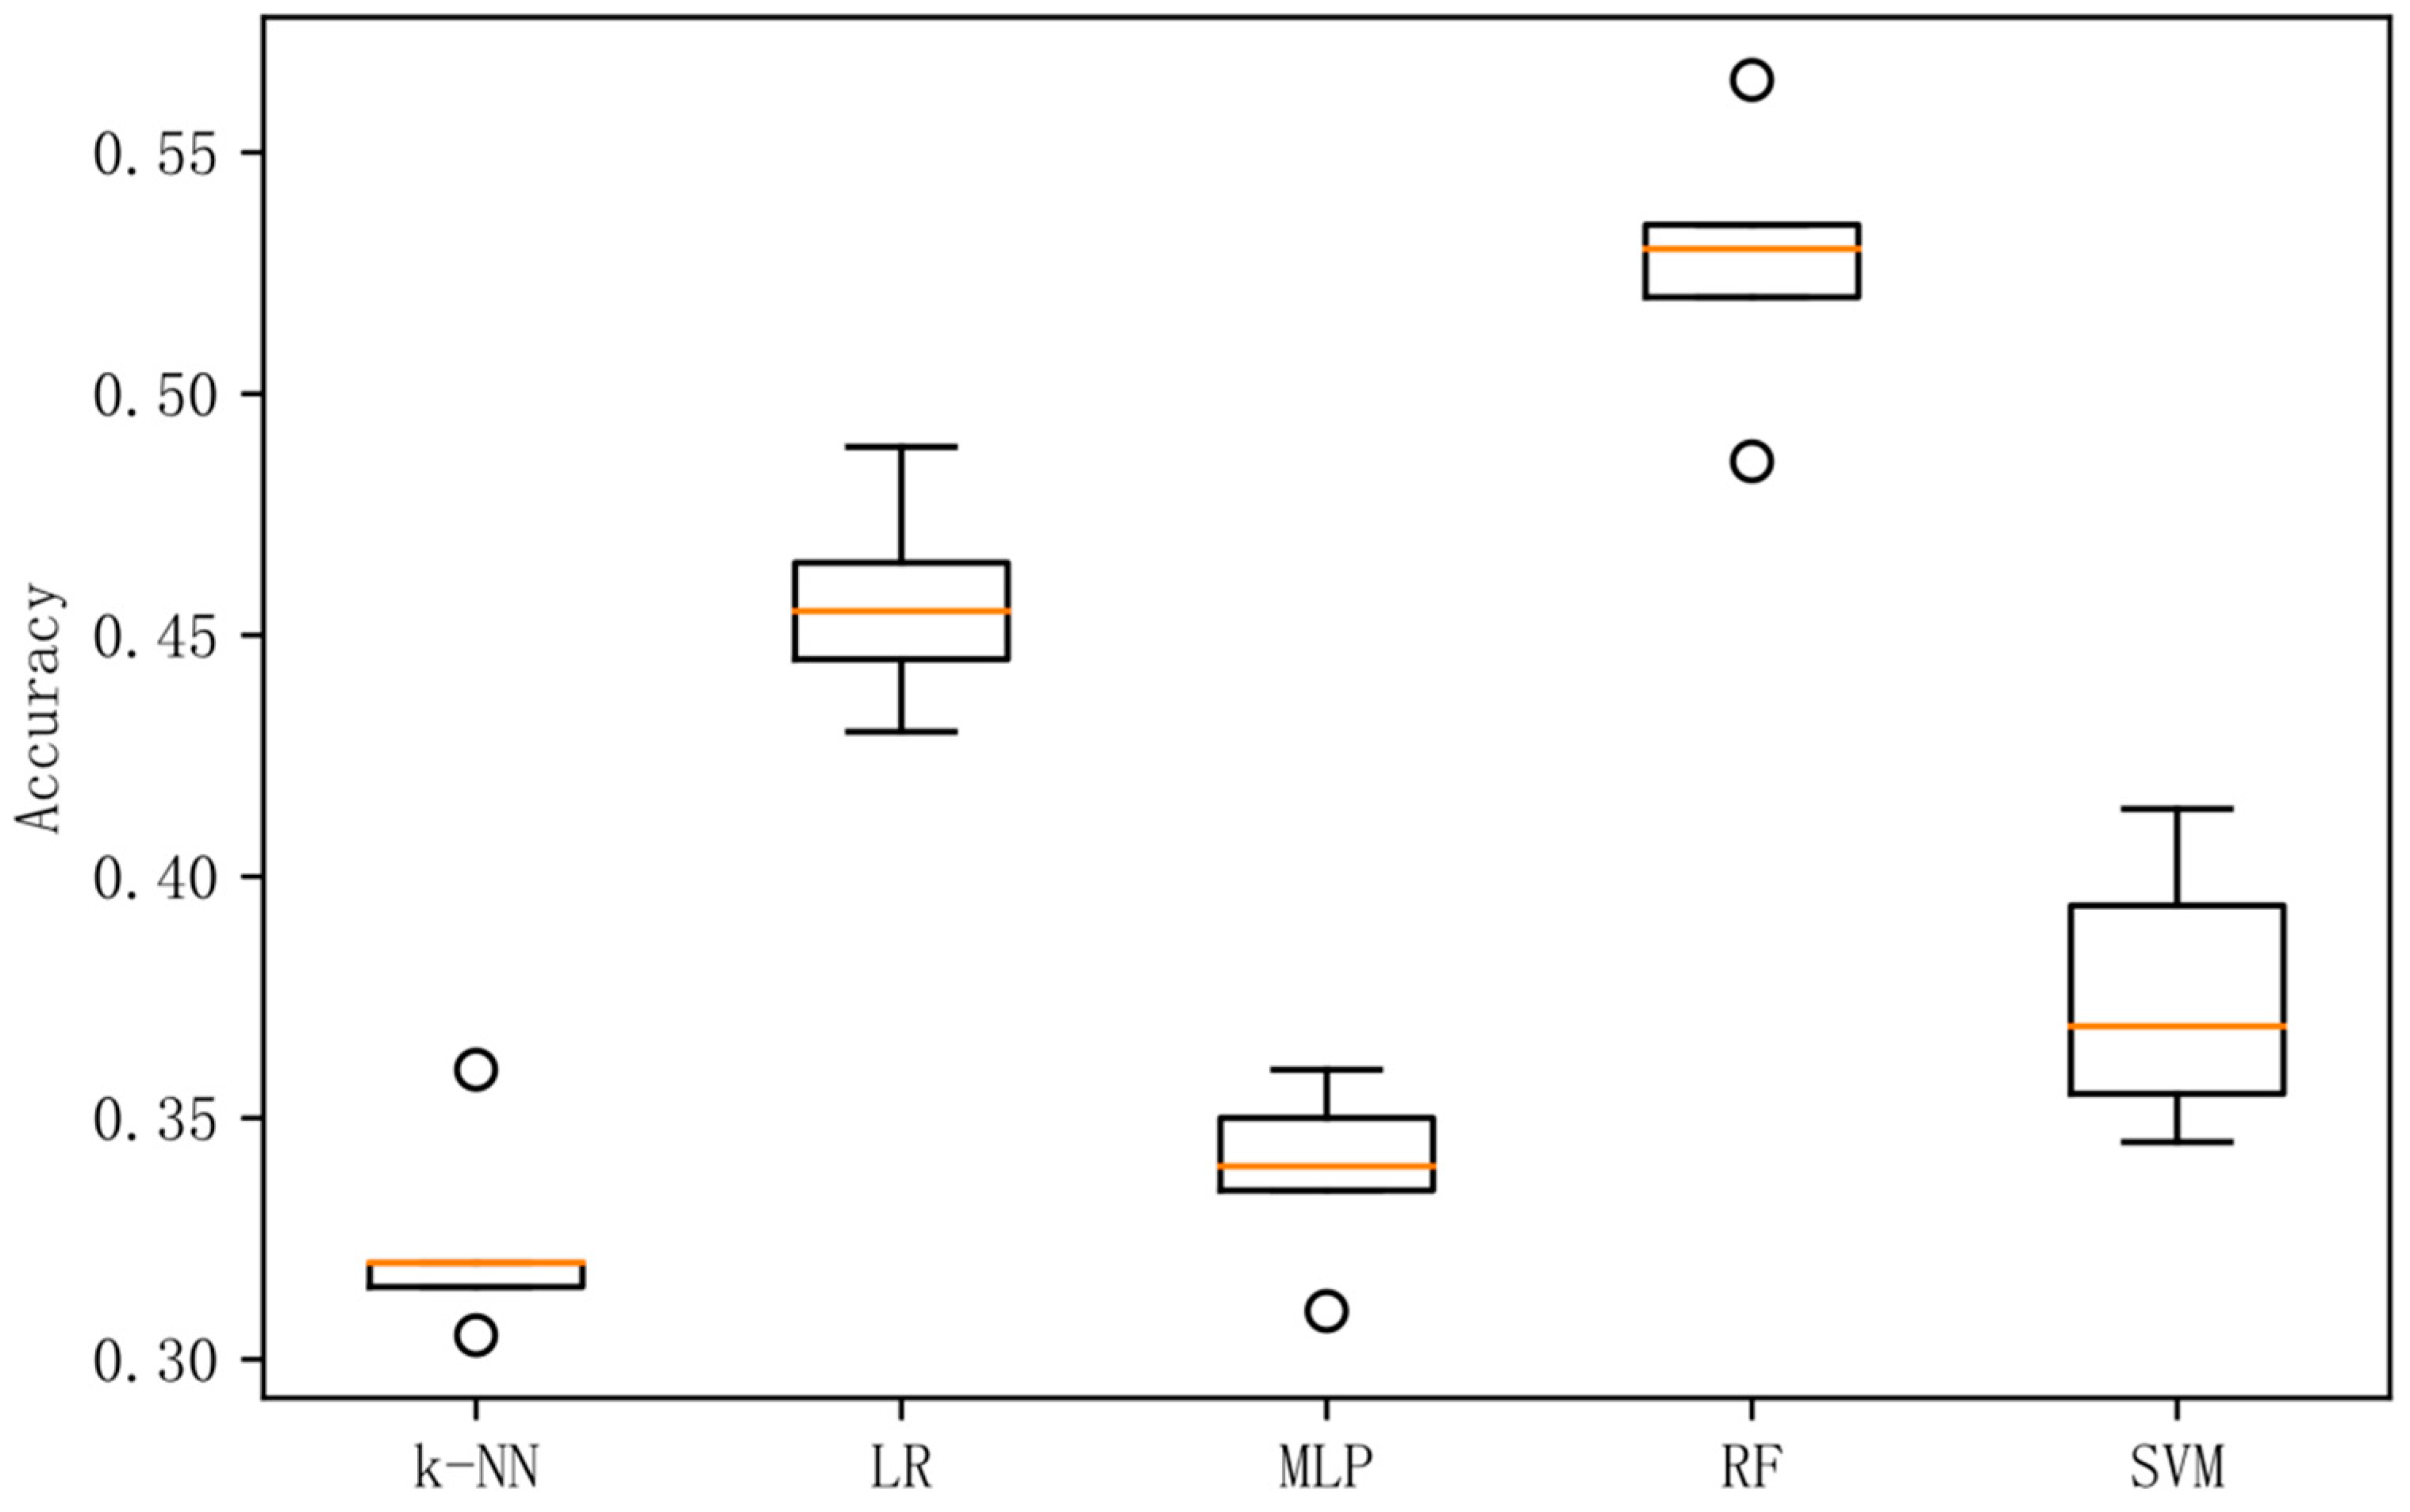
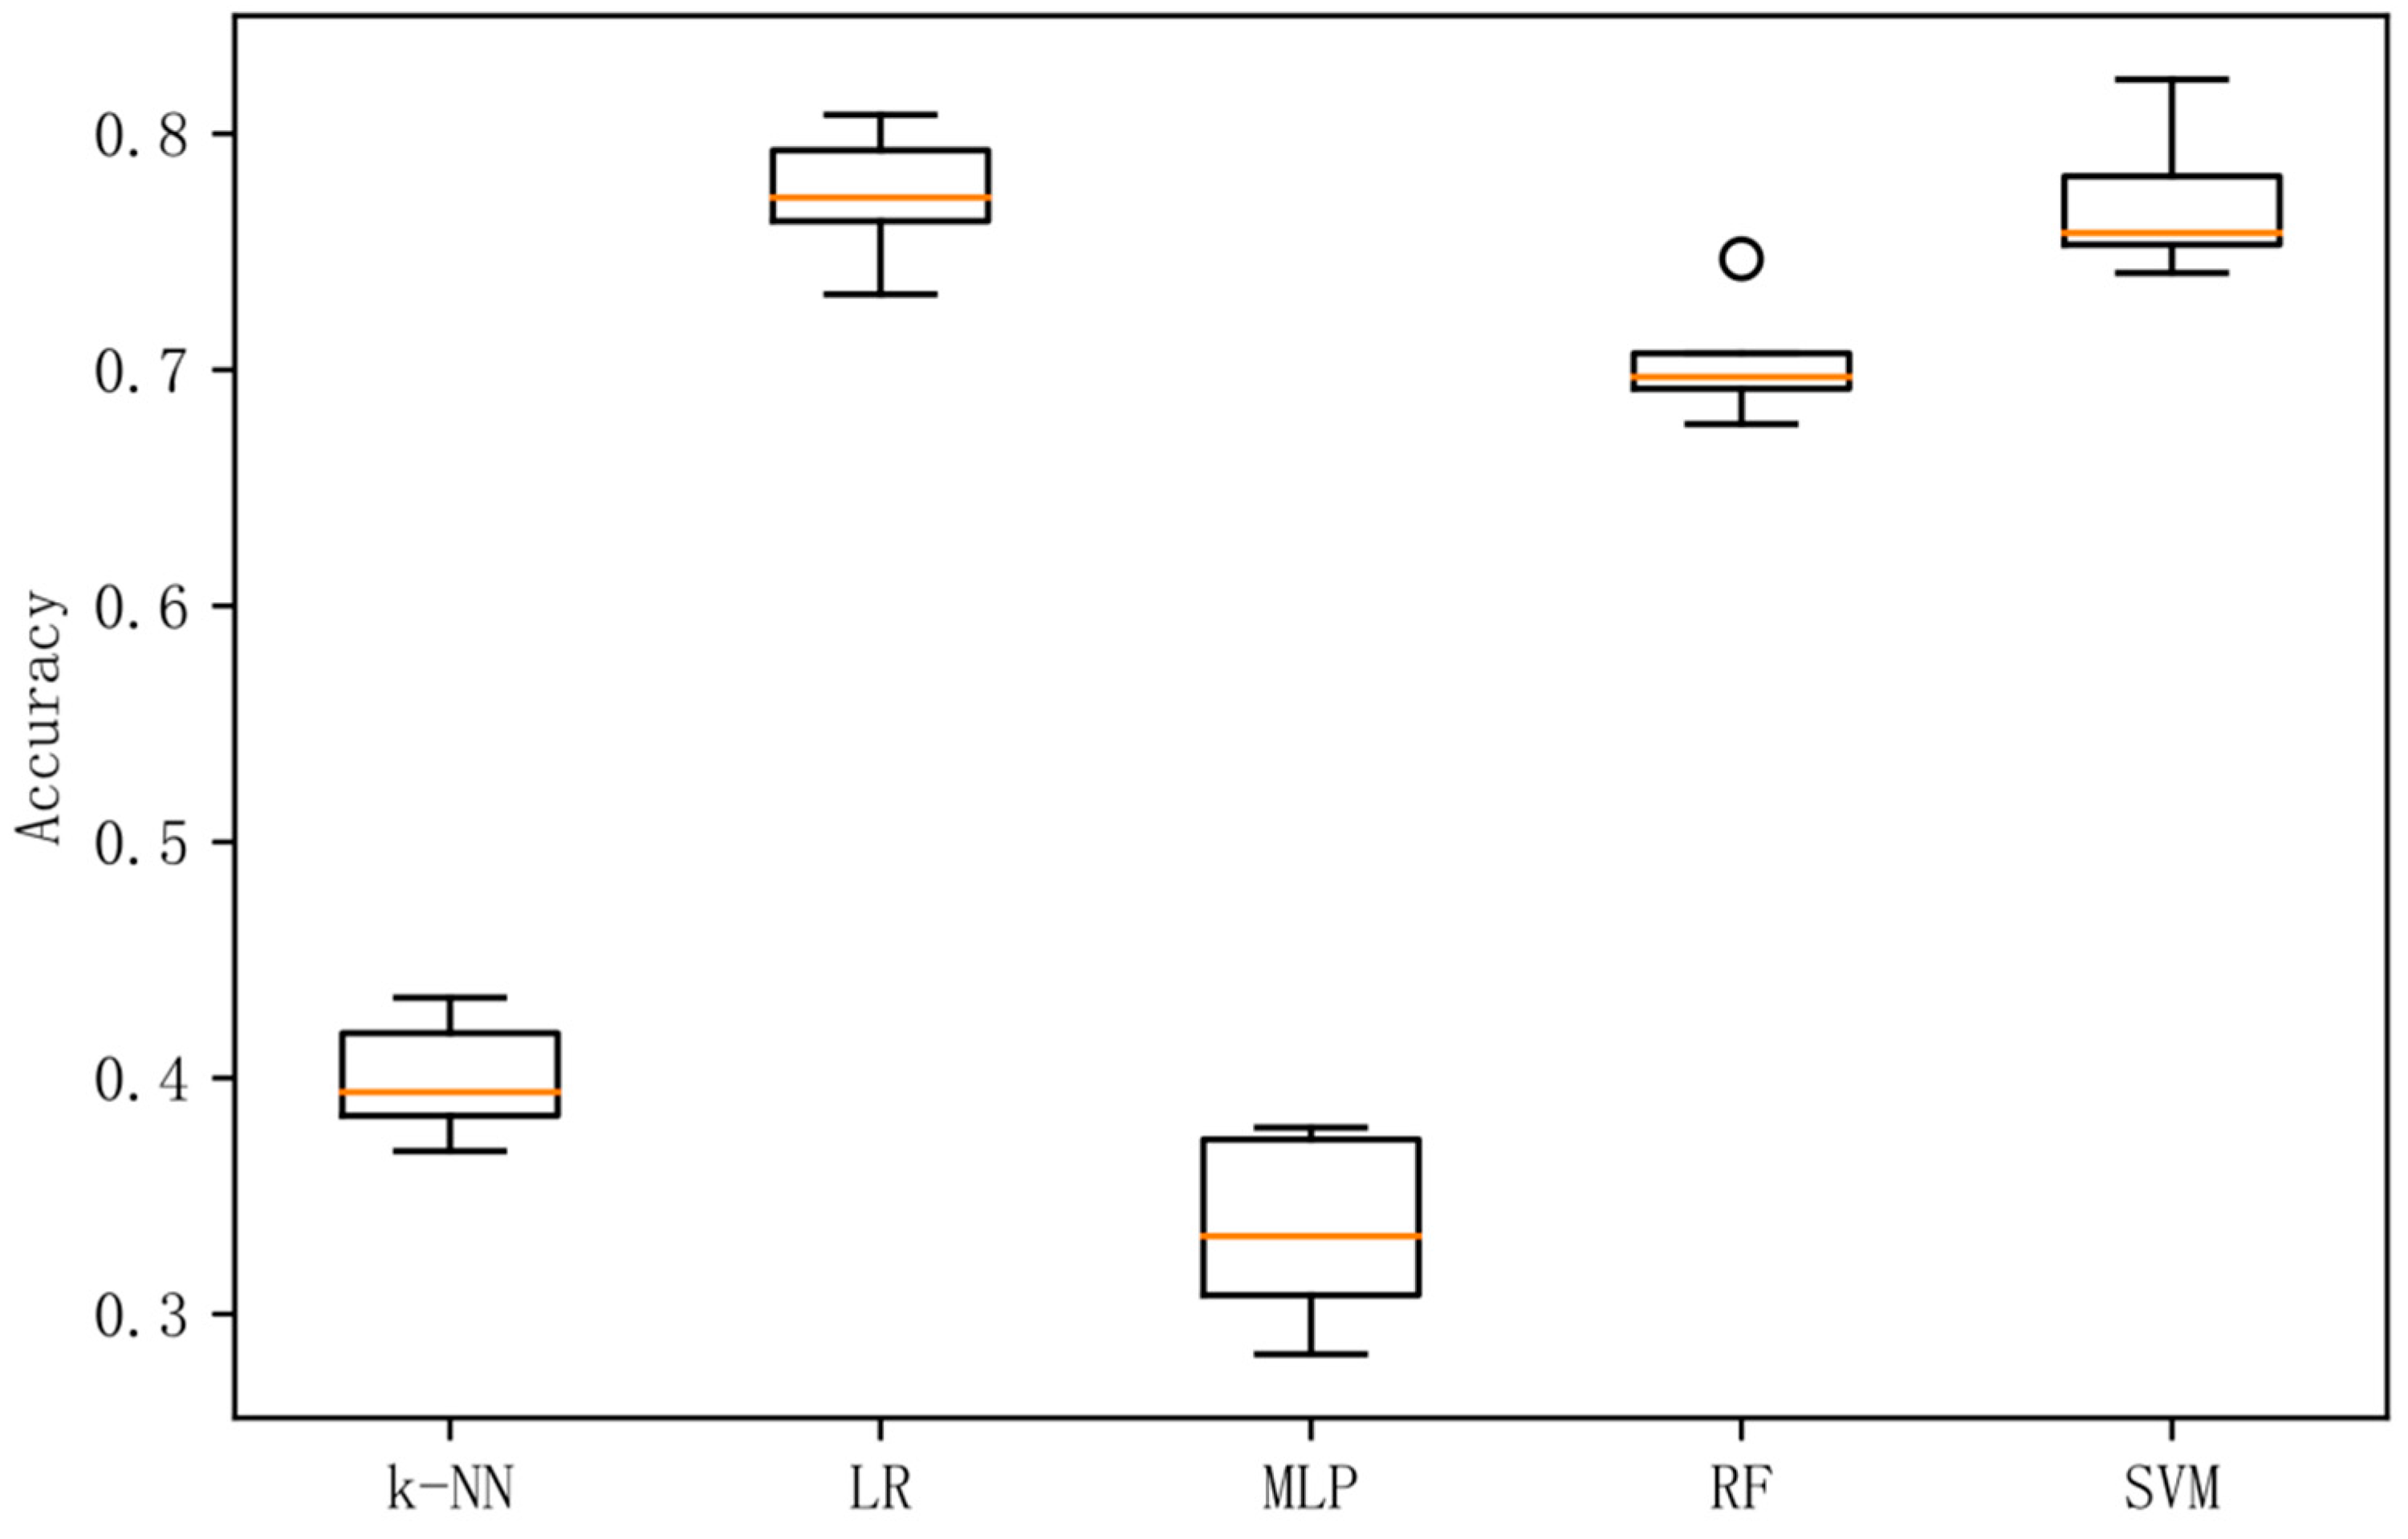
4.1. Classification Result of the Experiment with Different Feature Selection Methods
4.2. Time Complexity Result of Experiment with Different Feature Selection Methods
5. Discussion
6. Conclusions
Supplementary Materials
Author Contributions
Funding
Conflicts of Interest
References
- Rashid, U.; Niazi, I.K.; Signal, N.; Taylor, D. An EEG Experimental Study Evaluating the Performance of Texas Instruments ADS1299. Sensors 2018, 18, 3721. [Google Scholar] [CrossRef]
- Uktveris, T.; Jusas, V. Development of a Modular Board for EEG Signal Acquisition. Sensors 2018, 18, 2140. [Google Scholar] [CrossRef]
- Wolpaw, J.R.; Birbaumer, N.; Heetderks, W.J.; McFarland, D.J.; Peckham, P.H.; Schalk, G.; Donchin, E.; Quatrano, L.A.; Robinson, C.J.; Vaughan, T.M. Brain-computer interface technology: A review of the first international meeting. IEEE Trans. Rehabil. Eng. 2000, 8, 164–173. [Google Scholar] [CrossRef]
- Wolpaw, J.R.; Birbaumer, N.; McFarland, D.J.; Pfurtscheller, G.; Vaughan, T.M. Brain–computer interfaces for communication and control. Clin. Neurophysiol. 2002, 113, 767–791. [Google Scholar] [CrossRef]
- Cecotti, H. Spelling with non-invasive brain-computer interfaces—Current and future trends. J. Physiol.-Paris 2011, 105, 106–114. [Google Scholar] [CrossRef] [PubMed]
- Chaudhary, U.; Birbaumer, N.; Ramos-Murguialday, A. Brain–computer interfaces for communication and rehabilitation. Nat. Rev. Neurol. 2016, 12, 513–525. [Google Scholar] [CrossRef] [PubMed]
- Ramadan, R.A.; Vasilakos, A.V. Brain computer interface: Control signals review. Neurocomputing 2017, 223, 26–44. [Google Scholar] [CrossRef]
- Jin, J.; Sellers, E.W.; Zhou, S.; Zhang, Y.; Wang, X.; Cichocki, A. A P300 brain–computer interface based on a modification of the mismatch negativity paradigm. Int. J. Neural Syst. 2015, 25, 1550011. [Google Scholar] [CrossRef] [PubMed]
- Li, Y.; Pan, J.; Long, J.; Yu, T.; Wang, F.; Yu, Z.; Wu, W. Multimodal BCIs: Target detection, multidimensional control, and awareness evaluation in patients with disorder of consciousness. Proc. IEEE 2016, 104, 332–352. [Google Scholar]
- Cowie, R.; Douglas-Cowie, E.; Tsapatsoulis, N.; Votsis, G.; Kollias, S.; Fellenz, W.; Taylor, J.G. Emotion recognition in human-computer interaction. IEEE Signal Process. Mag. 2001, 18, 32–80. [Google Scholar] [CrossRef]
- Busso, C.; Deng, Z.; Yildirim, S.; Bulut, M.; Lee, C.M.; Kazemzadeh, A.; Lee, S.; Neumann, U.; Narayanan, S. Analysis of emotion recognition using facial expressions, speech and multimodal information. In Proceedings of the 6th International Conference on Multimodal Interfaces, State College, PA, USA, 13–15 October 2004; ACM: New York, NY, USA, 2014. [Google Scholar]
- Atkinson, J.; Campos, D. Improving BCI-based emotion recognition by combining EEG feature selection and kernel classifiers. Expert Syst. Appl. 2016, 47, 35–41. [Google Scholar] [CrossRef]
- Dai, M.; Zheng, D.; Na, R.; Wang, S.; Zhang, S. EEG Classification of Motor Imagery Using a Novel Deep Learning Framework. Sensors 2019, 19, 551. [Google Scholar] [CrossRef] [PubMed]
- Zeng, Y.; Wu, Q.; Yang, K.; Tong, L.; Yan, B.; Shu, J.; Yao, D. EEG-Based Identity Authentication Framework Using Face Rapid Serial Visual Presentation with Optimized Channels. Sensors 2019, 19, 6. [Google Scholar] [CrossRef] [PubMed]
- Zhang, A.; Yang, B.; Huang, L. Feature extraction of EEG signals using power spectral entropy. In Proceedings of the 2008 International Conference on Biomedical Engineering and Informatics, Sanya, China, 27–30 May 2008. [Google Scholar]
- Brunner, C.; Billinger, M.; Vidaurre, C.; Neuper, C. A comparison of univariate, vector, bilinear autoregressive, and band power features for brain–computer interfaces. Med. Biol. Eng. Comput. 2011, 49, 1337–1346. [Google Scholar] [CrossRef] [PubMed] [Green Version]
- Petrantonakis, P.C.; Hadjileontiadis, L.J. Emotion recognition from brain signals using hybrid adaptive filtering and higher order crossings analysis. IEEE Trans. Affect. Comput. 2010, 1, 81–97. [Google Scholar] [CrossRef]
- Duan, R.N.; Zhu, J.Y.; Lu, B.L. Differential entropy feature for EEG-based emotion classification. In Proceedings of the 2013 6th International IEEE/EMBS Conference on Neural Engineering (NER), San Diego, CA, USA, 6–8 November 2013. [Google Scholar]
- Zheng, W.L.; Lu, B.L. Investigating critical frequency bands and channels for EEG-based emotion recognition with deep neural networks. IEEE Trans. Auton. Ment. Dev. 2015, 7, 162–175. [Google Scholar] [CrossRef]
- Yang, Y.X.; Gao, Z.K.; Wang, X.M.; Li, Y.L.; Han, J.W.; Marwan, N.; Kurths, J. A recurrence quantification analysis-based channel-frequency convolutional neural network for emotion recognition from EEG. Chaos Interdiscip. J. Nonlinear Sci. 2018, 28, 085728. [Google Scholar] [CrossRef]
- Lee, H.; Choi, S. PCAcombine with HMM combine with SVM for EEG pattern classification. In Proceedings of the Seventh International Symposium on Signal Processing and Its Applications, Paris, France, 4 July 2003. [Google Scholar]
- Subasi, A.; Gursoy, M.I. EEG signal classification using PCA, ICA, LDA and support vector machines. Expert Syst. Appl. 2010, 37, 8659–8666. [Google Scholar] [CrossRef]
- Alkan, A.; Koklukaya, E.; Subasi, A. Automatic seizure detection in EEG using logistic regression and artificial neural network. J. Neurosci. Methods 2005, 148, 167–176. [Google Scholar] [CrossRef]
- Subasi, A.; Ercelebi, E. Classification of EEG signals using neural network and logistic regression. Comput. Methods Programs Biomed. 2005, 78, 87–99. [Google Scholar] [CrossRef]
- Tomioka, R.; Aihara, K.; Müller, K.R. Logistic regression for single trial EEG classification. In Advances in Neural Information Processing Systems 19, Proceedings of the Twentieth Annual Conference on Neural Information Processing Systems, Vancouver, BC, Canada, 4–7 December 2006; MIT Press: Cambridge, MA, USA, 2006. [Google Scholar]
- Chandaka, S.; Chatterjee, A.; Munshi, S. Cross-correlation aided support vector machine classifier for classification of EEG signals. Expert Syst. Appl. 2009, 36, 1329–1336. [Google Scholar] [CrossRef]
- Shao, S.Y.; Shen, K.Q.; Ong, C.J.; Wilder-Smith, E.P.; Li, X.P. Automatic EEG artifact removal: A weighted support vector machine approach with error correction. IEEE Trans. Biomed. Eng. 2009, 56, 336–344. [Google Scholar] [CrossRef] [PubMed]
- Liu, S.; Tong, J.; Meng, J.; Yang, J.; Zhao, X.; He, F.; Qi, H.; Ming, D. Study on an effective cross-stimulus emotion recognition model using EEGs based on feature selection and support vector machine. Int. J. Mach. Learn. Cybern. 2018, 9, 721–726. [Google Scholar] [CrossRef]
- Yazdani, A.; Ebrahimi, T.; Hoffmann, U. Classification of EEG signals using Dempster Shafer theory and a k-nearest neighbor classifier. In Proceedings of the 4th International IEEE/EMBS Conference on Neural Engineering, Antalya, Turkey, 29 April–2 May 2009. [Google Scholar]
- Acharya, U.R.; Molinari, F.; Sree, S.V.; Chattopadhyay, S.; Ng, K.H.; Suri, J.S. Automated diagnosis of epileptic EEG using entropies. Biomed. Signal Process. Control 2012, 7, 401–408. [Google Scholar] [CrossRef]
- Fraiwan, L.; Lweesy, K.; Khasawneh, N.; Wenz, H.; Dickhaus, H. Automated sleep stage identification system based on time–frequency analysis of a single EEG channel and random forest classifier. Comput. Methods Programs Biomed. 2012, 108, 10–19. [Google Scholar] [CrossRef]
- Donos, C.; Dümpelmann, M.; Schulze-Bonhage, A. Early seizure detection algorithm based on intracranial EEG and random forest classification. Int. J. Neural Syst. 2015, 25, 1550023. [Google Scholar] [CrossRef] [PubMed]
- Behri, M.; Subasi, A.; Qaisar, S.M. Comparison of machine learning methods for two class motor imagery tasks using EEG in brain-computer interface. In Proceedings of the Advances in Science and Engineering Technology International Conferences (ASET), Abu Dhabi, United Arab Emirates, 6 February–5 April 2018. [Google Scholar]
- Orhan, U.; Hekim, M.; Ozer, M. EEG signals classification using the K-Means clustering and a multilayer perceptron neural network model. Expert Syst. Appl. 2011, 38, 13475–13481. [Google Scholar] [CrossRef]
- Narang, A.; Batra, B.; Ahuja, A.; Yadav, J.; Pachauri, N. Classification of EEG signals for epileptic seizures using Levenberg-Marquardt algorithm based Multilayer Perceptron Neural Network. J. Intell. Fuzzy Syst. 2018, 34, 1669–1677. [Google Scholar] [CrossRef]
- Gautama, T.; Mandic, D.P.; Van Hulle, M.M. A differential entropy based method for determining the optimal embedding parameters of a signal. In Proceedings of the 2003 IEEE International Conference on Acoustics, Speech, and Signal Processing, Hong Kong, China, 6–10 April 2003. [Google Scholar]
- Wang, C.; Ye, Z. Brightness preserving histogram equalization with maximum entropy: A variational perspective. IEEE Trans. Consum. Electron. 2005, 51, 1326–1334. [Google Scholar] [CrossRef]
- Kambhatla, N.; Leen, T.K. Dimension Reduction by Local Principal Component Analysis. Neural Comput. 1997, 9, 1493–1516. [Google Scholar] [CrossRef] [Green Version]
- Diambra, L.; de Figueiredo, J.B.; Malta, C.P. Epileptic activity recognition in EEG recording. Phys. A Stat. Mech. Appl. 1999, 273, 495–505. [Google Scholar] [CrossRef]
- Bhattacharyya, S.; Khasnobish, A.; Konar, A.; Tibarewala, D.N.; Nagar, A.K. Performance analysis of left/right hand movement classification from EEG signal by intelligent algorithms. In Proceedings of the 2011 IEEE Symposium on Computational Intelligence, Cognitive Algorithms, Mind, and Brain (CCMB), Paris, France, 11–15 April 2011. [Google Scholar]
- Nie, D.; Wang, X.W.; Shi, L.C.; Lu, B.L. EEG-based emotion recognition during watching movies. In Proceedings of the 2011 5th International IEEE/EMBS Conference on Neural Engineering, Cancun, Mexico, 27 April–1 May 2011. [Google Scholar]
- Liu, Y.; Sourina, O.; Nguyen, M.K. Real-Time EEG-Based Emotion Recognition and Its Applications. Transactions on Computational Science XII; Springer: Berlin/Heidelberg, Germany, 2011; p. 256277. [Google Scholar]
- Schirrmeister, R.; Tobias Springenberg, J.; Fiederer, L.; Glasstetter, M.; Eggensperger, K.; Tangermann, M.; Hutter, F.; Burgard, W.; Ball, T. Deep learning with convolutional neural networks for brain mapping and decoding of movement-related information from the human EEG. Hum. Brain Mapp. 2017, 38, 5391–5420. [Google Scholar] [CrossRef] [PubMed]
- Faust, O.; Hagiwara, Y.; Tan, J.H.; Oh, S.L.; Acharya, U.R. Deep learning for healthcare applications based on physiological signals: A review. Comput. Methods Programs Biomed. 2018, 161, 1–13. [Google Scholar] [CrossRef] [PubMed]
- Thomas, J.; Maszczyk, T.; Sinha, N.; Kluge, T.; Dauwels, J. Deep learning-based classification for brain-computer interfaces. In Proceedings of the 2017 IEEE International Conference on Systems, Man, and Cybernetics (SMC), Banff, AB, Canada, 5–8 October 2017. [Google Scholar]


| Method | RF | SVM | ||||||||||
|---|---|---|---|---|---|---|---|---|---|---|---|---|
| Band | Delta | Theta | Alpha | Beta | Gamma | Combined | Delta | Theta | Alpha | Beta | Gamma | Combined |
| Accuracy | 0.385 ± 0.019 | 0.378 ± 0.029 | 0.365 ± 0.033 | 0.474 ± 0.030 | 0.491 ± 0.017 | 0.479 ± 0.038 | 0.310 ± 0.025 | 0.318 ± 0.028 | 0.330 ± 0.016 | 0.431 ± 0.021 | 0.315 ± 0.025 | 0.375 ± 0.028 |
| Precision | 0.383 ± 0.014 | 0.382 ± 0.030 | 0.378 ± 0.046 | 0.480 ± 0.039 | 0.487 ± 0.019 | 0.487 ± 0.032 | 0.311 ± 0.027 | 0.321 ± 0.028 | 0.333 ± 0.015 | 0.440 ± 0.026 | 0.324 ± 0.031 | 0.392 ± 0.024 |
| Recall | 0.391 ± 0.020 | 0.385 ± 0.031 | 0.373 ± 0.034 | 0.481 ± 0.030 | 0.496 ± 0.021 | 0.486 ± 0.035 | 0.311 ± 0.026 | 0.319 ± 0.027 | 0.333 ± 0.018 | 0.434 ± 0.022 | 0.320 ± 0.024 | 0.378 ± 0.031 |
| F1 score | 0.379 ± 0.016 | 0.373 ± 0.029 | 0.362 ± 0.035 | 0.465 ± 0.029 | 0.473 ± 0.012 | 0.474 ± 0.041 | 0.308 ± 0.024 | 0.315 ± 0.028 | 0.328 ± 0.015 | 0.429 ± 0.021 | 0.308 ± 0.025 | 0.372 ± 0.026 |
| Kappa coef. | 0.084 ± 0.028 | 0.074 ± 0.045 | 0.058 ± 0.052 | 0.219 ± 0.049 | 0.242 ± 0.029 | 0.227 ± 0.051 | 0.033 ± 0.038 | 0.020 ± 0.040 | 0.006 ± 0.025 | 0.322 ± 0.035 | 0.019 ± 0.036 | 0.069 ± 0.042 |
| Method | RF | SVM | ||||||||||
|---|---|---|---|---|---|---|---|---|---|---|---|---|
| Band | Delta | Theta | Alpha | Beta | Gamma | Combined | Delta | Theta | Alpha | Beta | Gamma | Combined |
| Accuracy | 0.342 ± 0.039 | 0.298 ± 0.043 | 0.322 ± 0.012 | 0.393 ± 0.035 | 0.414 ± 0.015 | 0.537 ± 0.028 | 0.310 ± 0.025 | 0.318 ± 0.028 | 0.330 ± 0.016 | 0.451 ± 0.020 | 0.475 ± 0.025 | 0.475 ± 0.028 |
| Precision | 0.353 ± 0.049 | 0.306 ± 0.050 | 0.329 ± 0.026 | 0.374 ± 0.044 | 0.381 ± 0.056 | 0.510 ± 0.040 | 0.311 ± 0.027 | 0.321 ± 0.028 | 0.333 ± 0.015 | 0.449 ± 0.026 | 0.464 ± 0.031 | 0.492 ± 0.024 |
| Recall | 0.350 ± 0.043 | 0.304 ± 0.044 | 0.335 ± 0.018 | 0.386 ± 0.028 | 0.394 ± 0.021 | 0.530 ± 0.028 | 0.311 ± 0.026 | 0.319 ± 0.027 | 0.333 ± 0.018 | 0.434 ± 0.022 | 0.466 ± 0.024 | 0.478 ± 0.031 |
| F1 score | 0.337 ± 0.036 | 0.290 ± 0.047 | 0.305 ± 0.015 | 0.385 ± 0.037 | 0.372 ± 0.023 | 0.523 ± 0.034 | 0.308 ± 0.024 | 0.315 ± 0.028 | 0.328 ± 0.015 | 0.429 ± 0.021 | 0.458 ± 0.025 | 0.472 ± 0.026 |
| Kappa coef | 0.024 ± 0.063 | 0.043 ± 0.063 | 0.002 ± 0.024 | 0.204 ± 0.041 | 0.227 ± 0.027 | 0.329 ± 0.039 | 0.033 ± 0.038 | 0.020 ± 0.040 | 0.006 ± 0.025 | 0.362 ± 0.035 | 0.319 ± 0.036 | 0.269 ± 0.042 |
| Method | RF | SVM | ||||||||||
|---|---|---|---|---|---|---|---|---|---|---|---|---|
| Band | Delta | Theta | Alpha | Beta | Gamma | Combined | Delta | Theta | Alpha | Beta | Gamma | Combined |
| Accuracy | 0.525 ± 0.025 | 0.527 ± 0.053 | 0.513 ± 0.044 | 0.621 ± 0.044 | 0.627 ± 0.041 | 0.704 ± 0.026 | 0.568 ± 0.012 | 0.663 ± 0.034 | 0.601 ± 0.015 | 0.694 ± 0.036 | 0.681 ± 0.017 | 0.770 ± 0.030 |
| Precision | 0.530 ± 0.021 | 0.537 ± 0.055 | 0.529 ± 0.045 | 0.615 ± 0.046 | 0.620 ± 0.047 | 0.700 ± 0.029 | 0.568±0.014 | 0.667 ± 0.034 | 0.602 ± 0.015 | 0.692 ± 0.031 | 0.680 ± 0.025 | 0.768 ± 0.033 |
| Recall | 0.531 ± 0.028 | 0.532 ± 0.055 | 0.522 ± 0.039 | 0.624 ± 0.046 | 0.627 ± 0.047 | 0.704 ± 0.029 | 0.567 ± 0.013 | 0.666 ± 0.034 | 0.602 ± 0.016 | 0.694 ± 0.037 | 0.681 ± 0.024 | 0.770 ± 0.032 |
| F1 score | 0.525 ± 0.025 | 0.527 ± 0.053 | 0.509 ± 0.047 | 0.614 ± 0.046 | 0.617 ± 0.044 | 0.699 ± 0.029 | 0.565 ± 0.011 | 0.663 ± 0.035 | 0.599 ± 0.016 | 0.690 ± 0.038 | 0.677 ± 0.022 | 0.767 ± 0.032 |
| Kappa coef | 0.290 ± 0.036 | 0.294 ± 0.082 | 0.277 ± 0.063 | 0.433 ± 0.065 | 0.440 ± 0.063 | 0.556 ± 0.040 | 0.351 ± 0.018 | 0.496 ± 0.051 | 0.401 ± 0.023 | 0.541 ± 0.052 | 0.521 ± 0.027 | 0.654 ± 0.046 |
| Method | RF | SVM | ||||||||||
|---|---|---|---|---|---|---|---|---|---|---|---|---|
| Band | Delta | Theta | Alpha | Beta | Gamma | Combined | Delta | Theta | Alpha | Beta | Gamma | Combined |
| Accuracy | 0.467 ± 0.017 | 0.484 ± 0.057 | 0.462 ± 0.049 | 0.556 ± 0.033 | 0.561 ± 0.035 | 0.582 ± 0.025 | 0.568 ± 0.012 | 0.663 ± 0.034 | 0.600 ± 0.015 | 0.714 ± 0.036 | 0.741 ± 0.017 | 0.825 ± 0.032 |
| Precision | 0.483 ± 0.020 | 0.517 ± 0.067 | 0.481 ± 0.048 | 0.570 ± 0.024 | 0.560 ± 0.035 | 0.590 ± 0.037 | 0.568 ± 0.014 | 0.667 ± 0.034 | 0.601 ± 0.016 | 0.709 ± 0.031 | 0.690 ± 0.025 | 0.801 ± 0.034 |
| Recall | 0.475 ± 0.015 | 0.496 ± 0.051 | 0.474 ± 0.047 | 0.568 ± 0.025 | 0.566 ± 0.031 | 0.593 ± 0.028 | 0.567 ± 0.013 | 0.666 ± 0.034 | 0.601 ± 0.017 | 0.711 ± 0.037 | 0.716 ± 0.024 | 0.802 ± 0.031 |
| F1 score | 0.453 ± 0.023 | 0.477 ± 0.065 | 0.454 ± 0.049 | 0.552 ± 0.033 | 0.555 ± 0.035 | 0.573 ± 0.031 | 0.565 ± 0.011 | 0.663 ± 0.035 | 0.598 ± 0.016 | 0.705 ± 0.038 | 0.677 ± 0.022 | 0.799 ± 0.033 |
| Kappa coef | 0.208 ± 0.023 | 0.238 ± 0.077 | 0.205 ± 0.071 | 0.343 ± 0.042 | 0.345 ± 0.051 | 0.378 ± 0.039 | 0.351 ± 0.018 | 0.496 ± 0.051 | 0.400 ± 0.023 | 0.566 ± 0.052 | 0.521 ± 0.027 | 0.698 ± 0.049 |
| Experiment | Method | Delta | Theta | Alpha | Beta | Gamma | Combined |
|---|---|---|---|---|---|---|---|
| Prediction performance in original dataset | kNN | 5.215 ± 0.091 | 5.337 ± 0.349 | 6.077 ± 0.408 | 5.997 ± 0.347 | 6.205 ± 1.003 | 25.970 ± 0.069 |
| LR | 111.323 ± 4.970 | 93.115 ± 7.211 | 97.788 ± 3.705 | 63.628 ± 4.623 | 51.596 ± 8.941 | 98.428 ± 6.571 | |
| MLP | 41.407 ± 14.262 | 50.474 ± 2.854 | 51.971 ± 1.282 | 50.837 ± 2.304 | 50.153 ± 2.195 | 105.568 ± 14.086 | |
| RF | 4.052 ± 0.115 | 4.497 ± 0.533 | 4.572 ± 0.280 | 4.982 ± 0.185 | 4.501 ± 0.386 | 9.544 ± 0.271 | |
| SVM | 19.429 ± 0.645 | 18.244 ± 1.475 | 19.388 ± 1.219 | 18.135 ± 0.993 | 17.517 ± 0.980 | 79.412 ± 2.109 | |
| Prediction performance in original dataset based on LDA | kNN | 2.356 ± 0.043 | 2.310 ± 0.040 | 2.341 ± 0.068 | 2.329 ± 0.038 | 2.357 ± 0.030 | 15.060 ± 0.100 |
| LR | 3.480 ± 0.142 | 3.162 ± 0.094 | 3.209 ± 0.078 | 3.320 ± 0.169 | 3.165 ± 0.078 | 16.151 ± 0.203 | |
| MLP | 2.726 ± 0.080 | 2.647 ± 0.052 | 2.680 ± 0.076 | 2.697 ± 0.054 | 2.686 ± 0.041 | 15.408 ± 0.127 | |
| RF | 2.845 ± 0.089 | 2.793 ± 0.062 | 2.836 ± 0.096 | 2.831 ± 0.065 | 2.815 ± 0.036 | 15.534 ± 0.153 | |
| SVM | 2.850 ± 0.075 | 2.539 ± 0.045 | 2.533 ± 0.076 | 2.477 ± 0.048 | 2.483 ± 0.024 | 15.182 ± 0.097 | |
| Prediction performance in differential entropy dataset | kNN | 1.871 ± 0.007 | 1.876 ± 0.022 | 1.908 ± 0.011 | 1.889 ± 0.005 | 1.882 ± 0.012 | 9.370 ± 0.022 |
| LR | 5.445 ± 0.310 | 7.340 ± 0.405 | 9.168 ± 0.986 | 10.321 ± 0.426 | 9.916 ± 0.558 | 26.932 ± 0.908 | |
| MLP | 6.524 ± 2.782 | 5.348 ± 1.719 | 4.159 ± 0.719 | 5.115 ± 1.640 | 4.865 ± 0.863 | 22.145 ± 3.354 | |
| RF | 2.243 ± 0.036 | 2.254 ± 0.019 | 2.269 ± 0.022 | 2.206 ± 0.018 | 2.192 ± 0.023 | 4.908 ± 0.140 | |
| SVM | 5.502 ± 0.019 | 5.266 ± 0.034 | 5.309 ± 0.059 | 4.125 ± 0.204 | 3.950 ± 0.213 | 24.780 ± 0.163 | |
| Prediction performance in differential entropy dataset based on LDA | kNN | 0.838 ± 0.013 | 0.826 ± 0.027 | 0.823 ± 0.025 | 0.839 ± 0.011 | 0.841 ± 0.020 | 4.202 ± 0.079 |
| LR | 1.001 ± 0.023 | 1.081 ± 0.032 | 1.134 ± 0.031 | 1.117 ± 0.018 | 1.097 ± 0.026 | 4.516 ± 0.100 | |
| MLP | 1.187 ± 0.023 | 1.162 ± 0.036 | 1.168 ± 0.038 | 1.187 ± 0.023 | 1.184 ± 0.015 | 4.668 ± 0.111 | |
| RF | 1.301 ± 0.019 | 1.302 ± 0.028 | 1.295 ± 0.027 | 1.309 ± 0.013 | 1.301 ± 0.029 | 4.819 ± 0.143 | |
| SVM | 0.966 ± 0.014 | 0.957 ± 0.029 | 0.973 ± 0.032 | 0.933 ± 0.022 | 0.928 ± 0.017 | 4.366 ± 0.079 |
© 2019 by the authors. Licensee MDPI, Basel, Switzerland. This article is an open access article distributed under the terms and conditions of the Creative Commons Attribution (CC BY) license (http://creativecommons.org/licenses/by/4.0/).
Share and Cite
Chen, D.-W.; Miao, R.; Yang, W.-Q.; Liang, Y.; Chen, H.-H.; Huang, L.; Deng, C.-J.; Han, N. A Feature Extraction Method Based on Differential Entropy and Linear Discriminant Analysis for Emotion Recognition. Sensors 2019, 19, 1631. https://doi.org/10.3390/s19071631
Chen D-W, Miao R, Yang W-Q, Liang Y, Chen H-H, Huang L, Deng C-J, Han N. A Feature Extraction Method Based on Differential Entropy and Linear Discriminant Analysis for Emotion Recognition. Sensors. 2019; 19(7):1631. https://doi.org/10.3390/s19071631
Chicago/Turabian StyleChen, Dong-Wei, Rui Miao, Wei-Qi Yang, Yong Liang, Hao-Heng Chen, Lan Huang, Chun-Jian Deng, and Na Han. 2019. "A Feature Extraction Method Based on Differential Entropy and Linear Discriminant Analysis for Emotion Recognition" Sensors 19, no. 7: 1631. https://doi.org/10.3390/s19071631