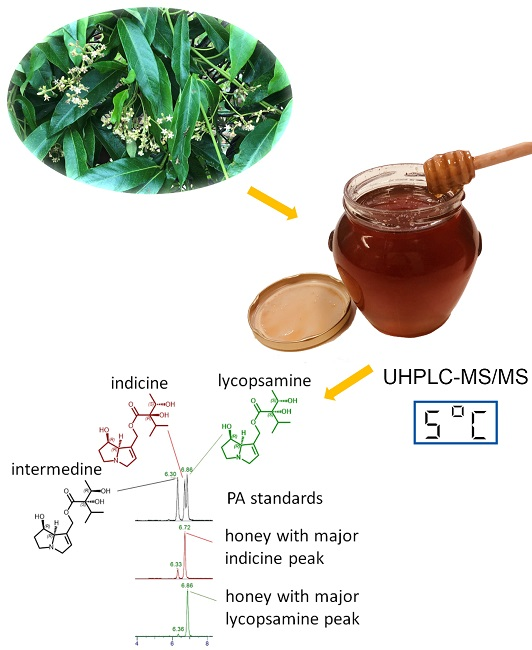
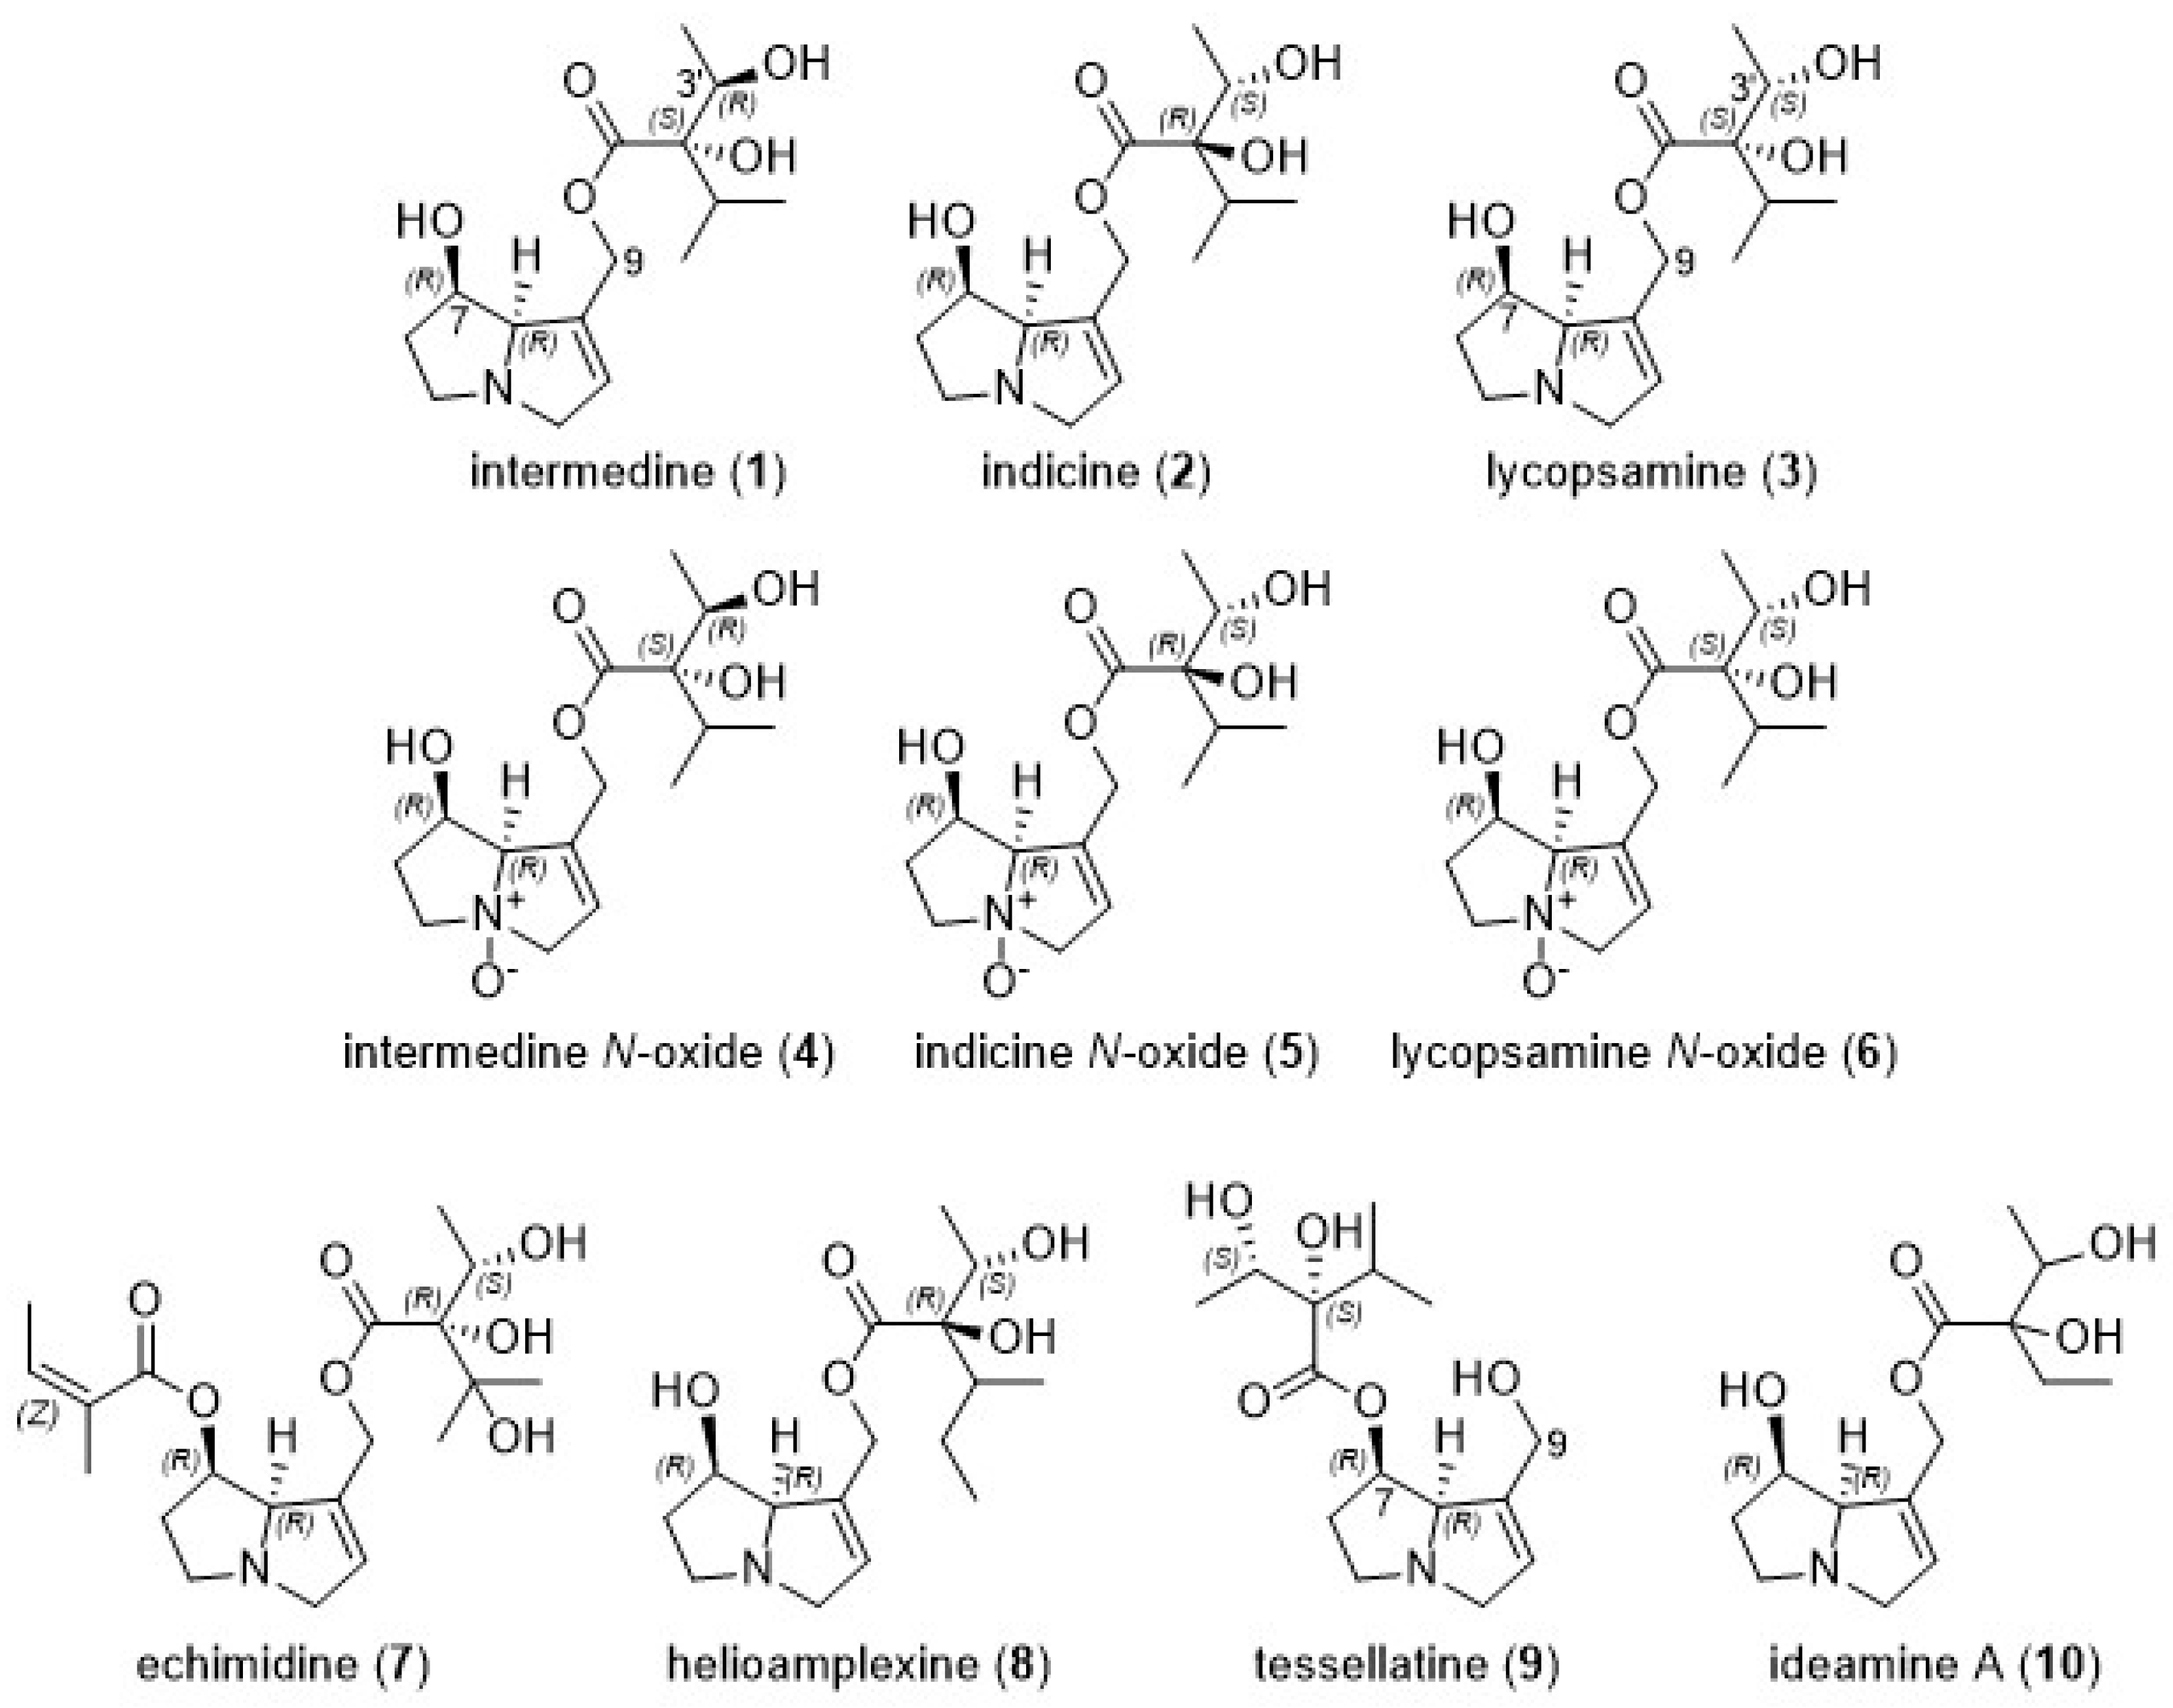
Analysis of Pyrrolizidine Alkaloids in Queensland Honey: Using Low Temperature Chromatography to Resolve Stereoisomers and Identify Botanical Sources by UHPLC-MS/MS

 , ,
, , 
Abstract
:
1. Introduction
2. Results and Discussion
2.1. Pyrrolizidine Analysis Method Validation
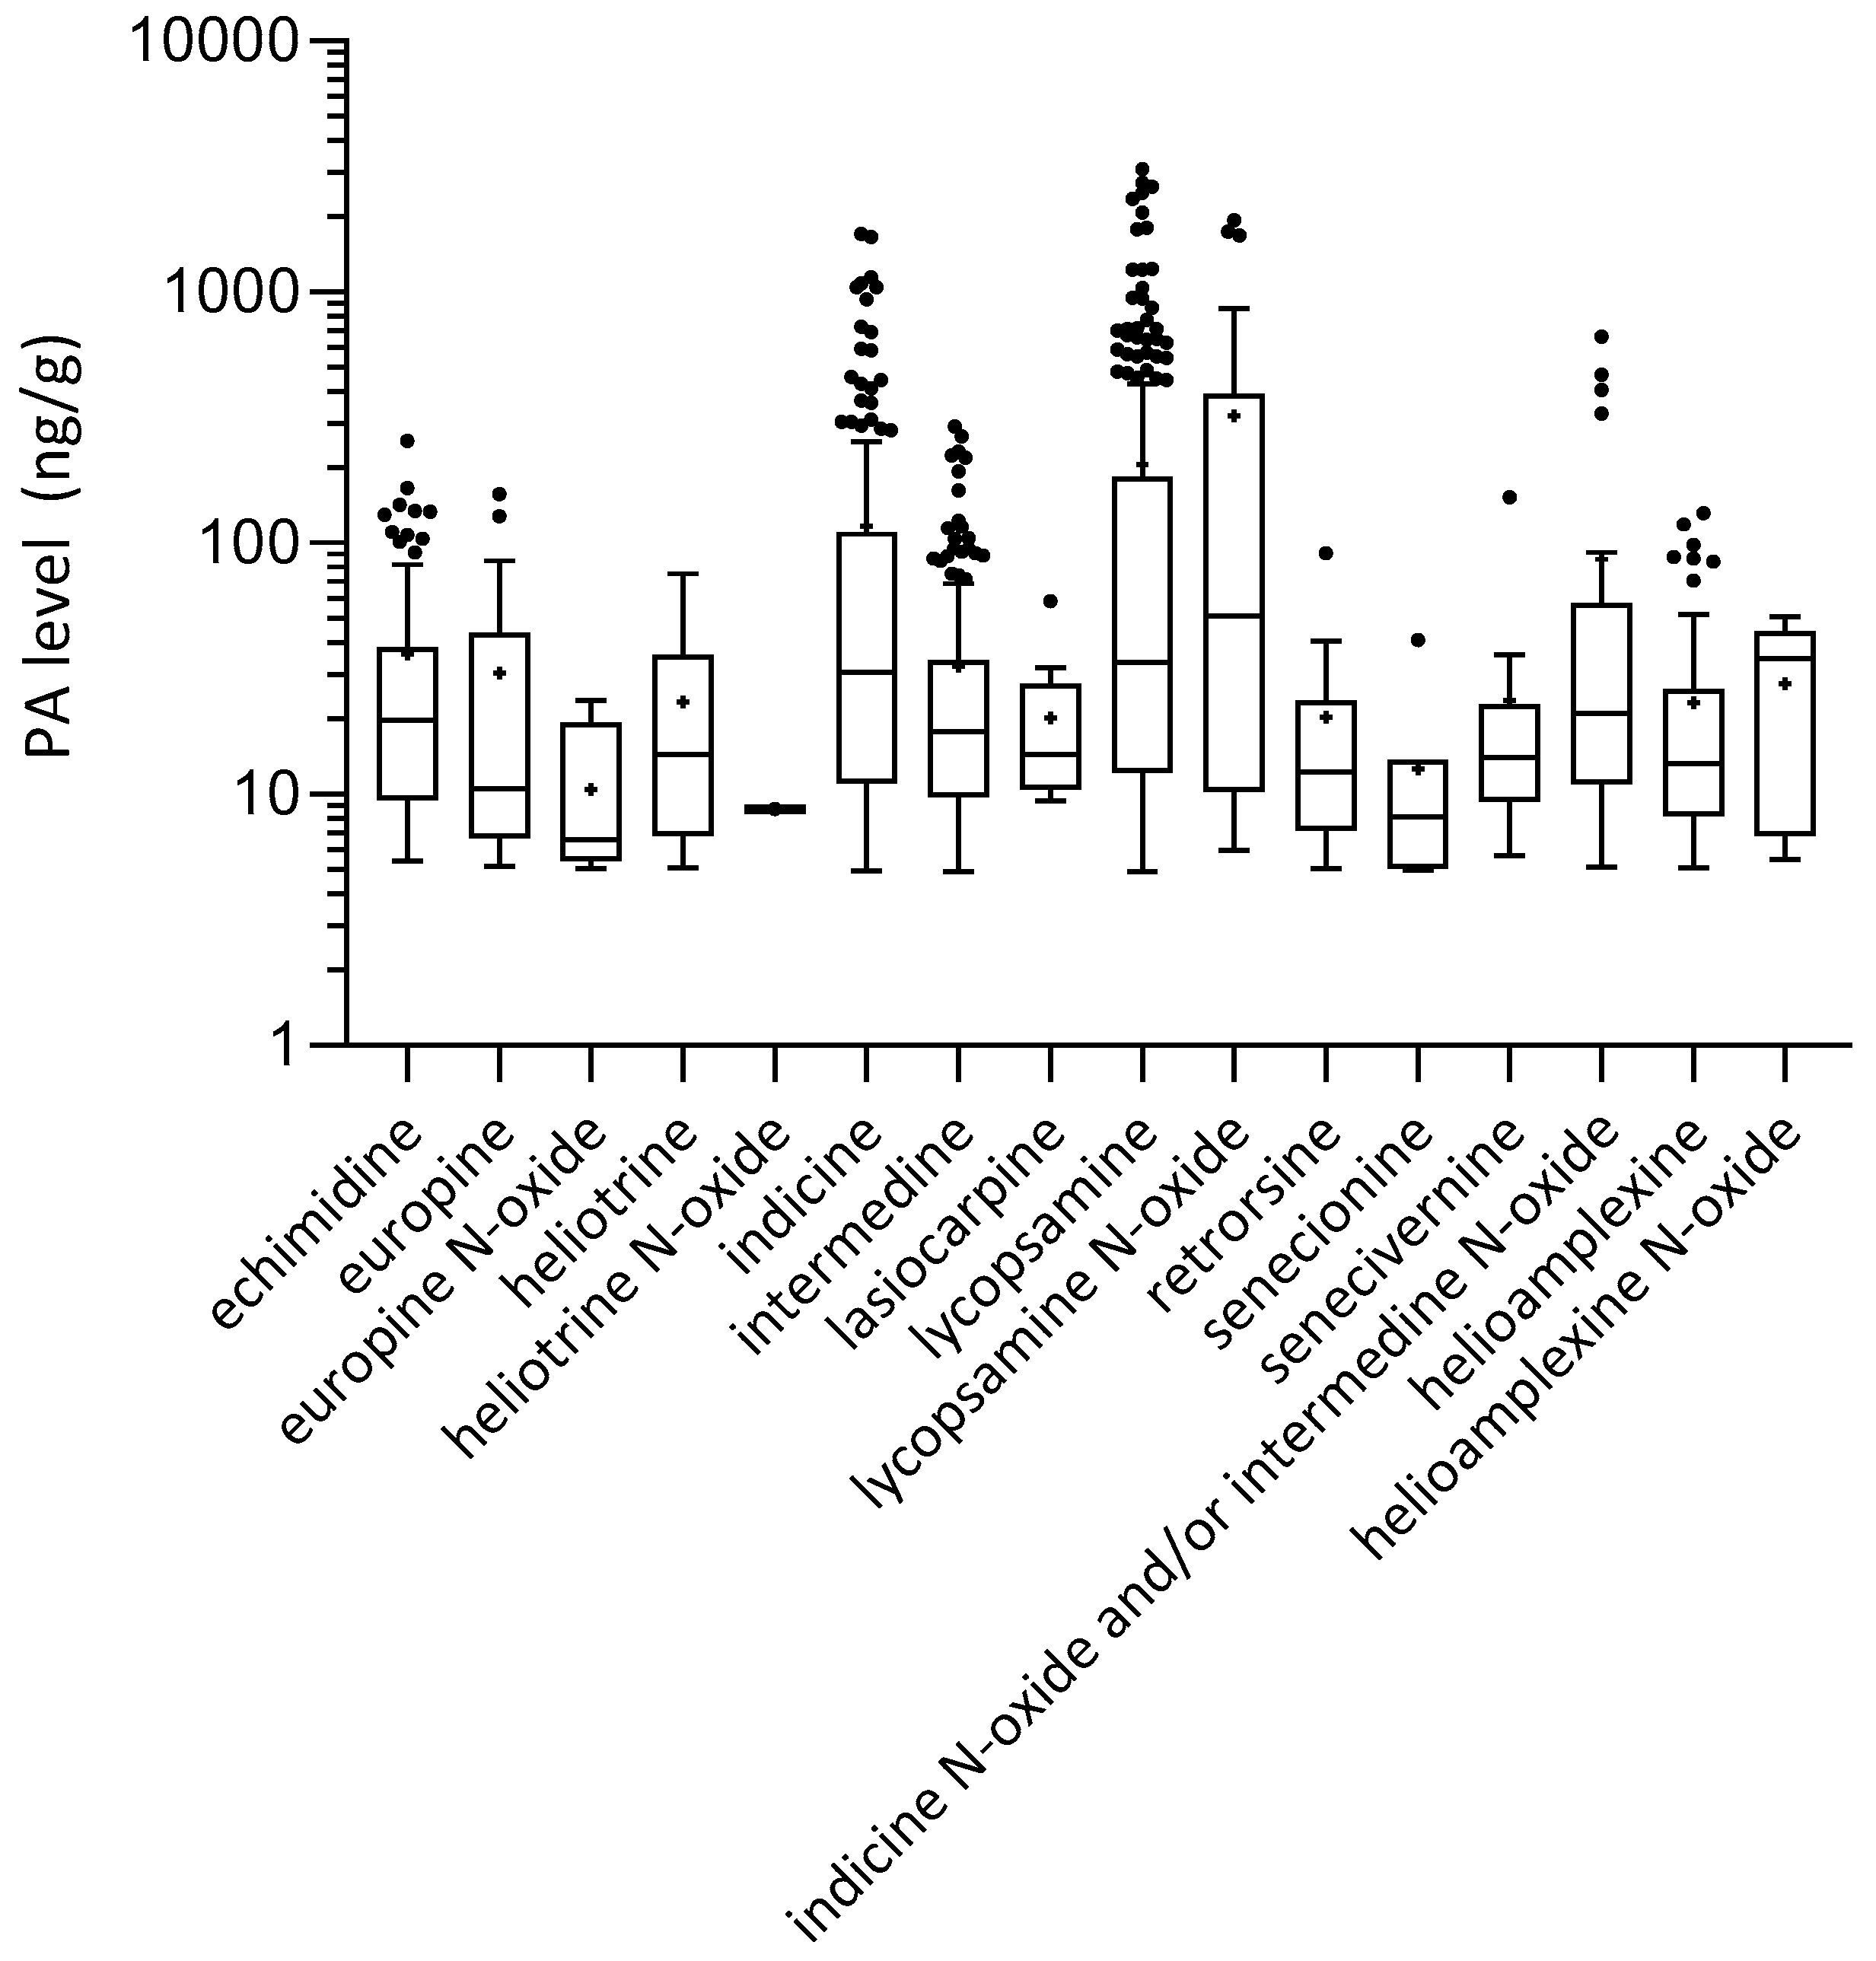
2.2. Alkaloid Levels Measured in Honey
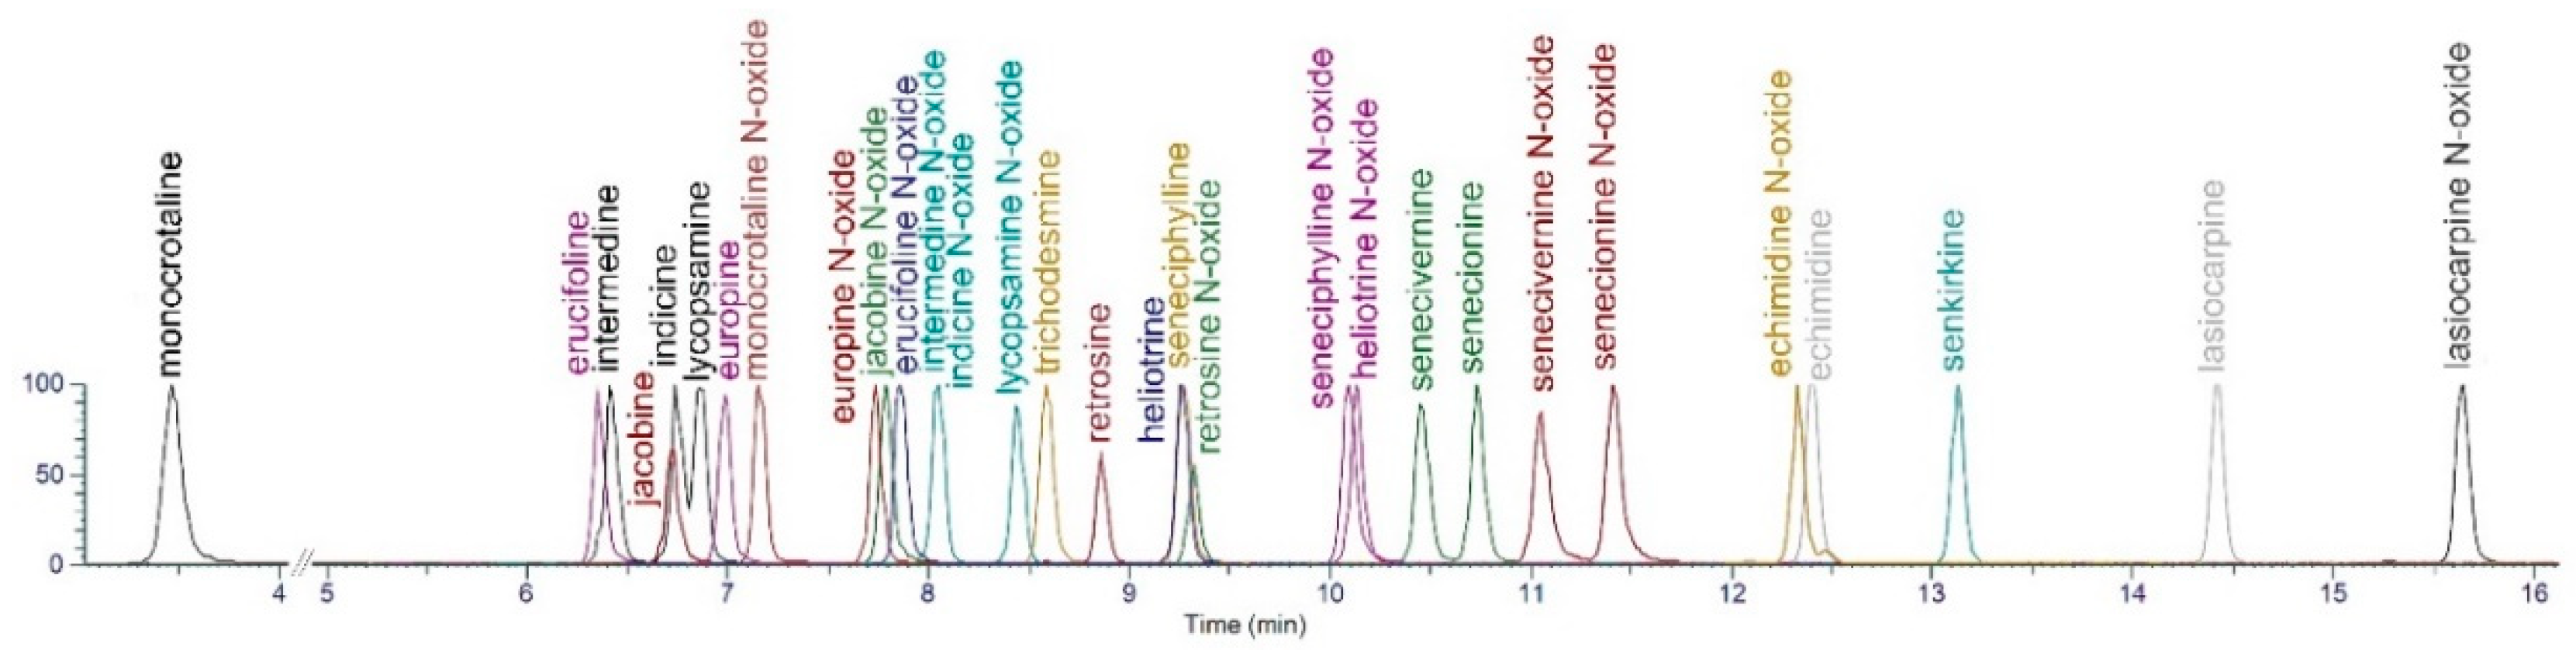
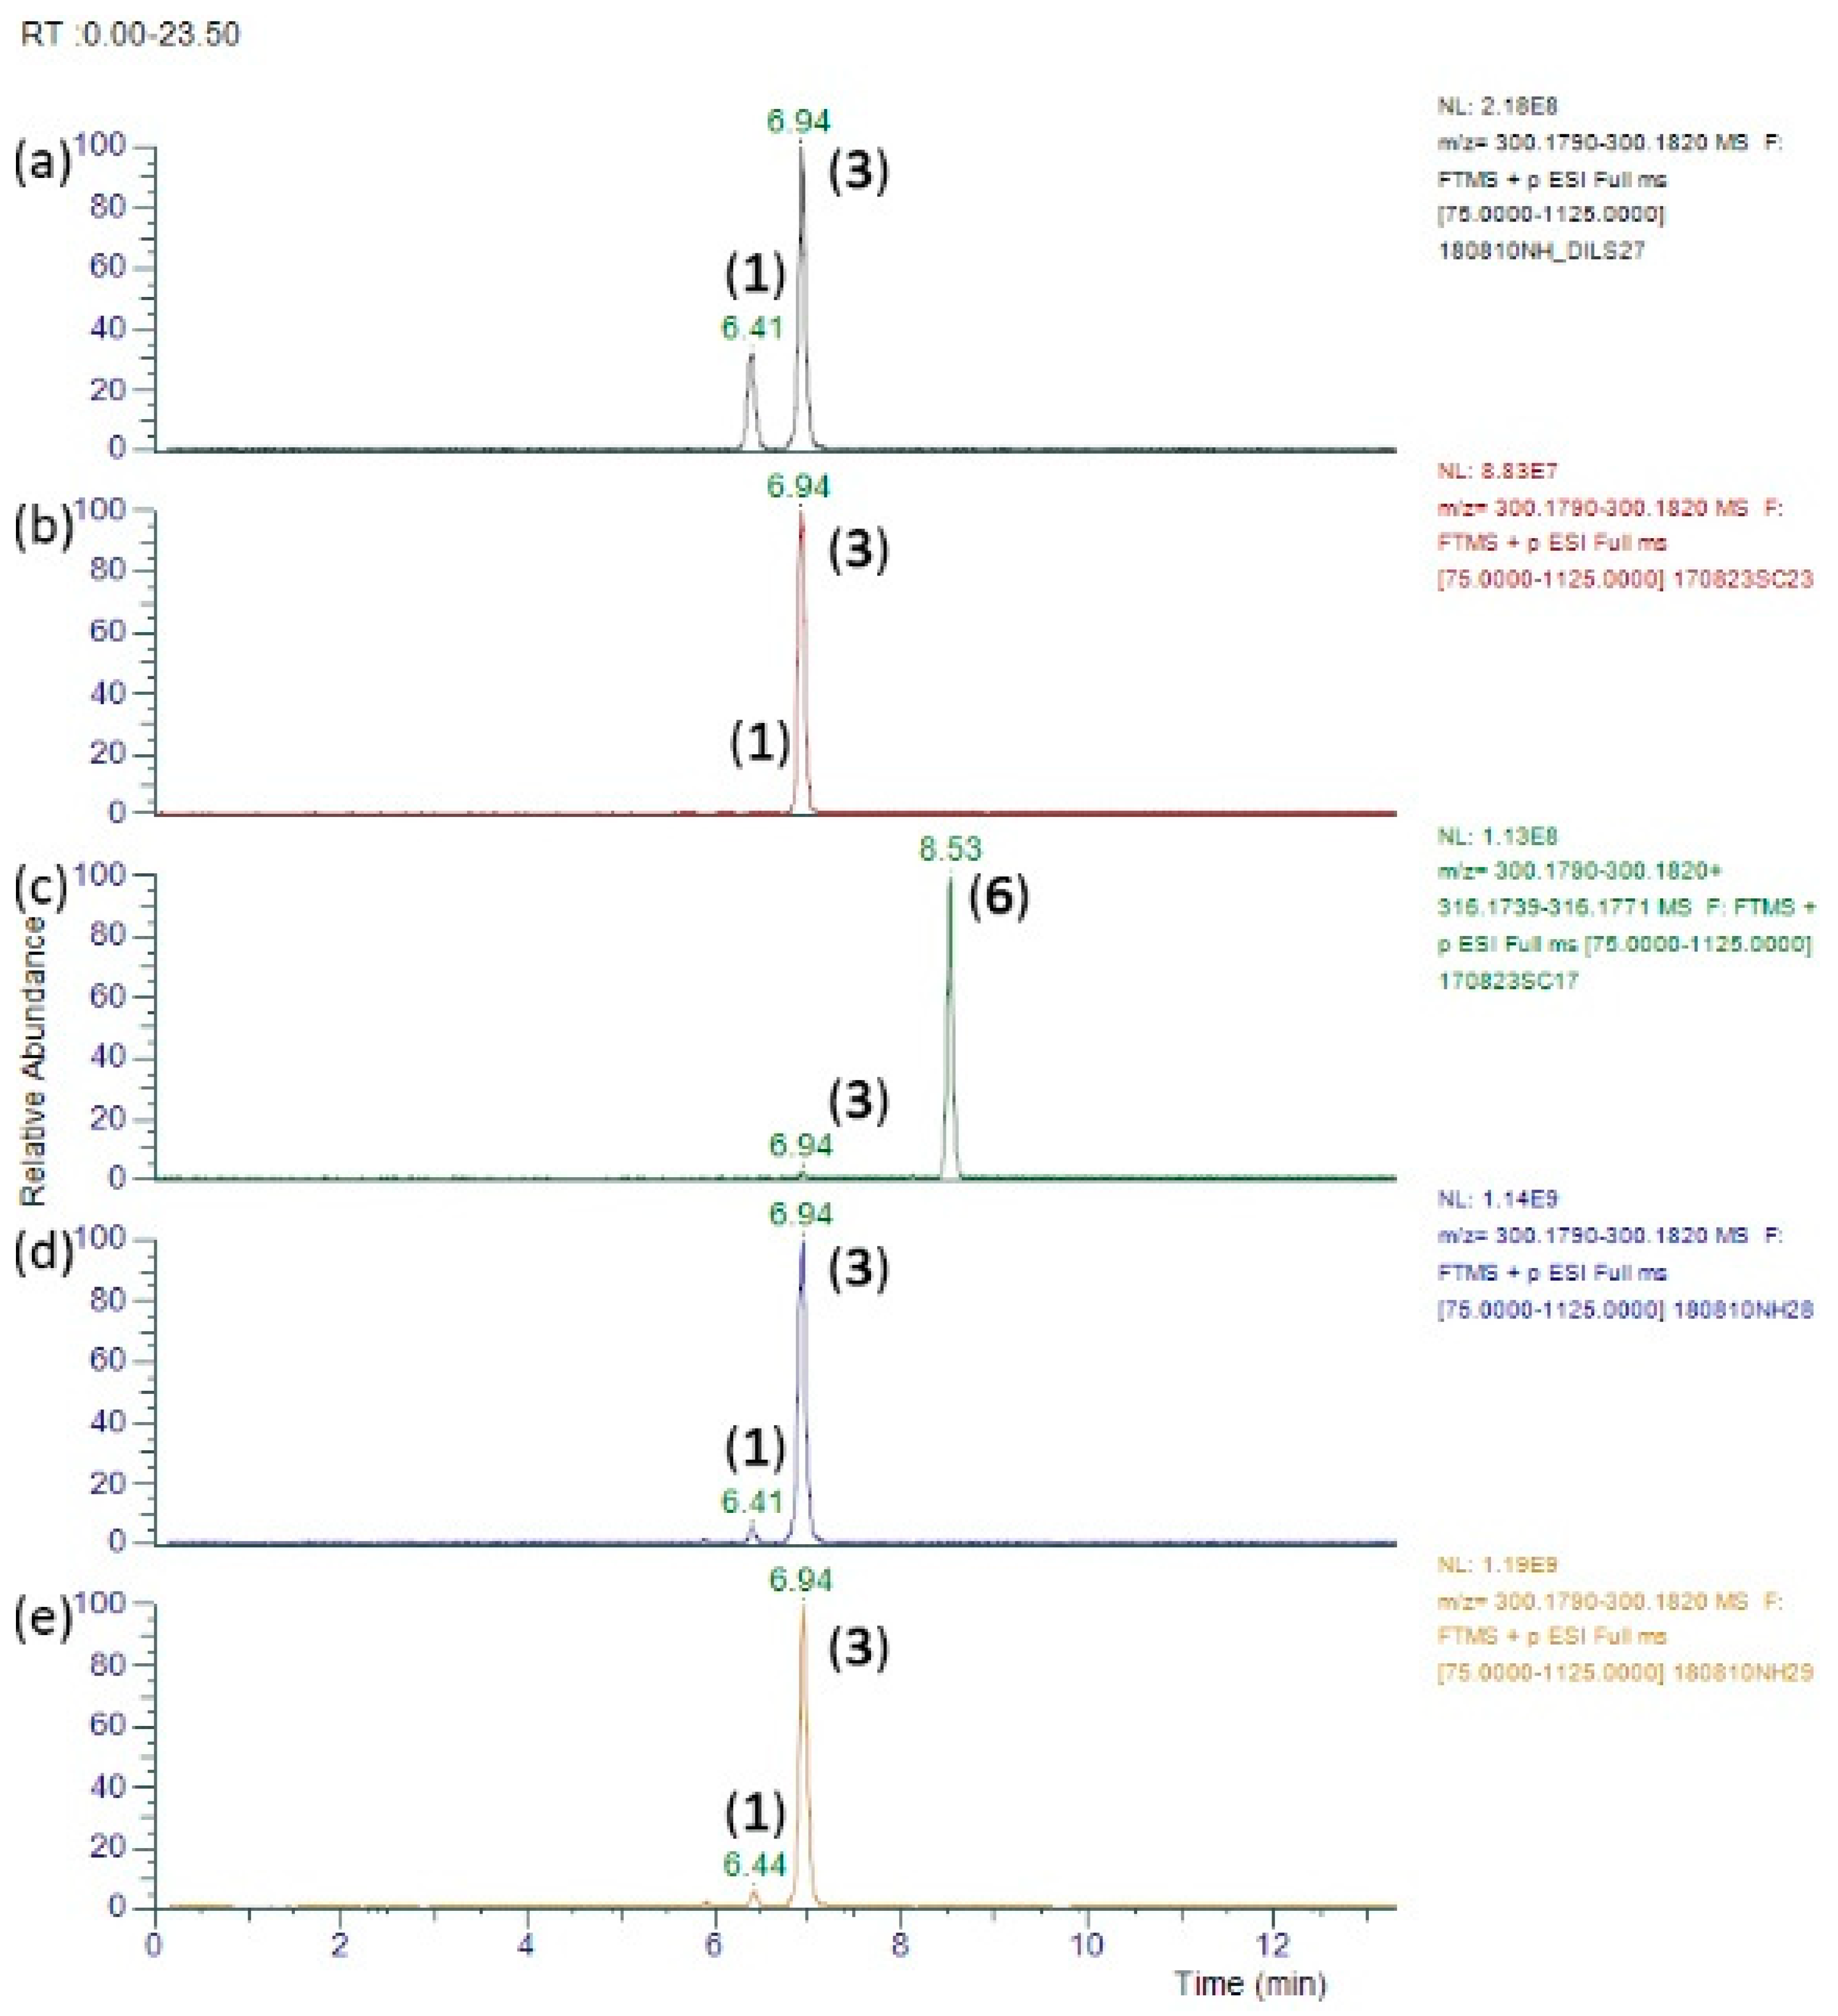
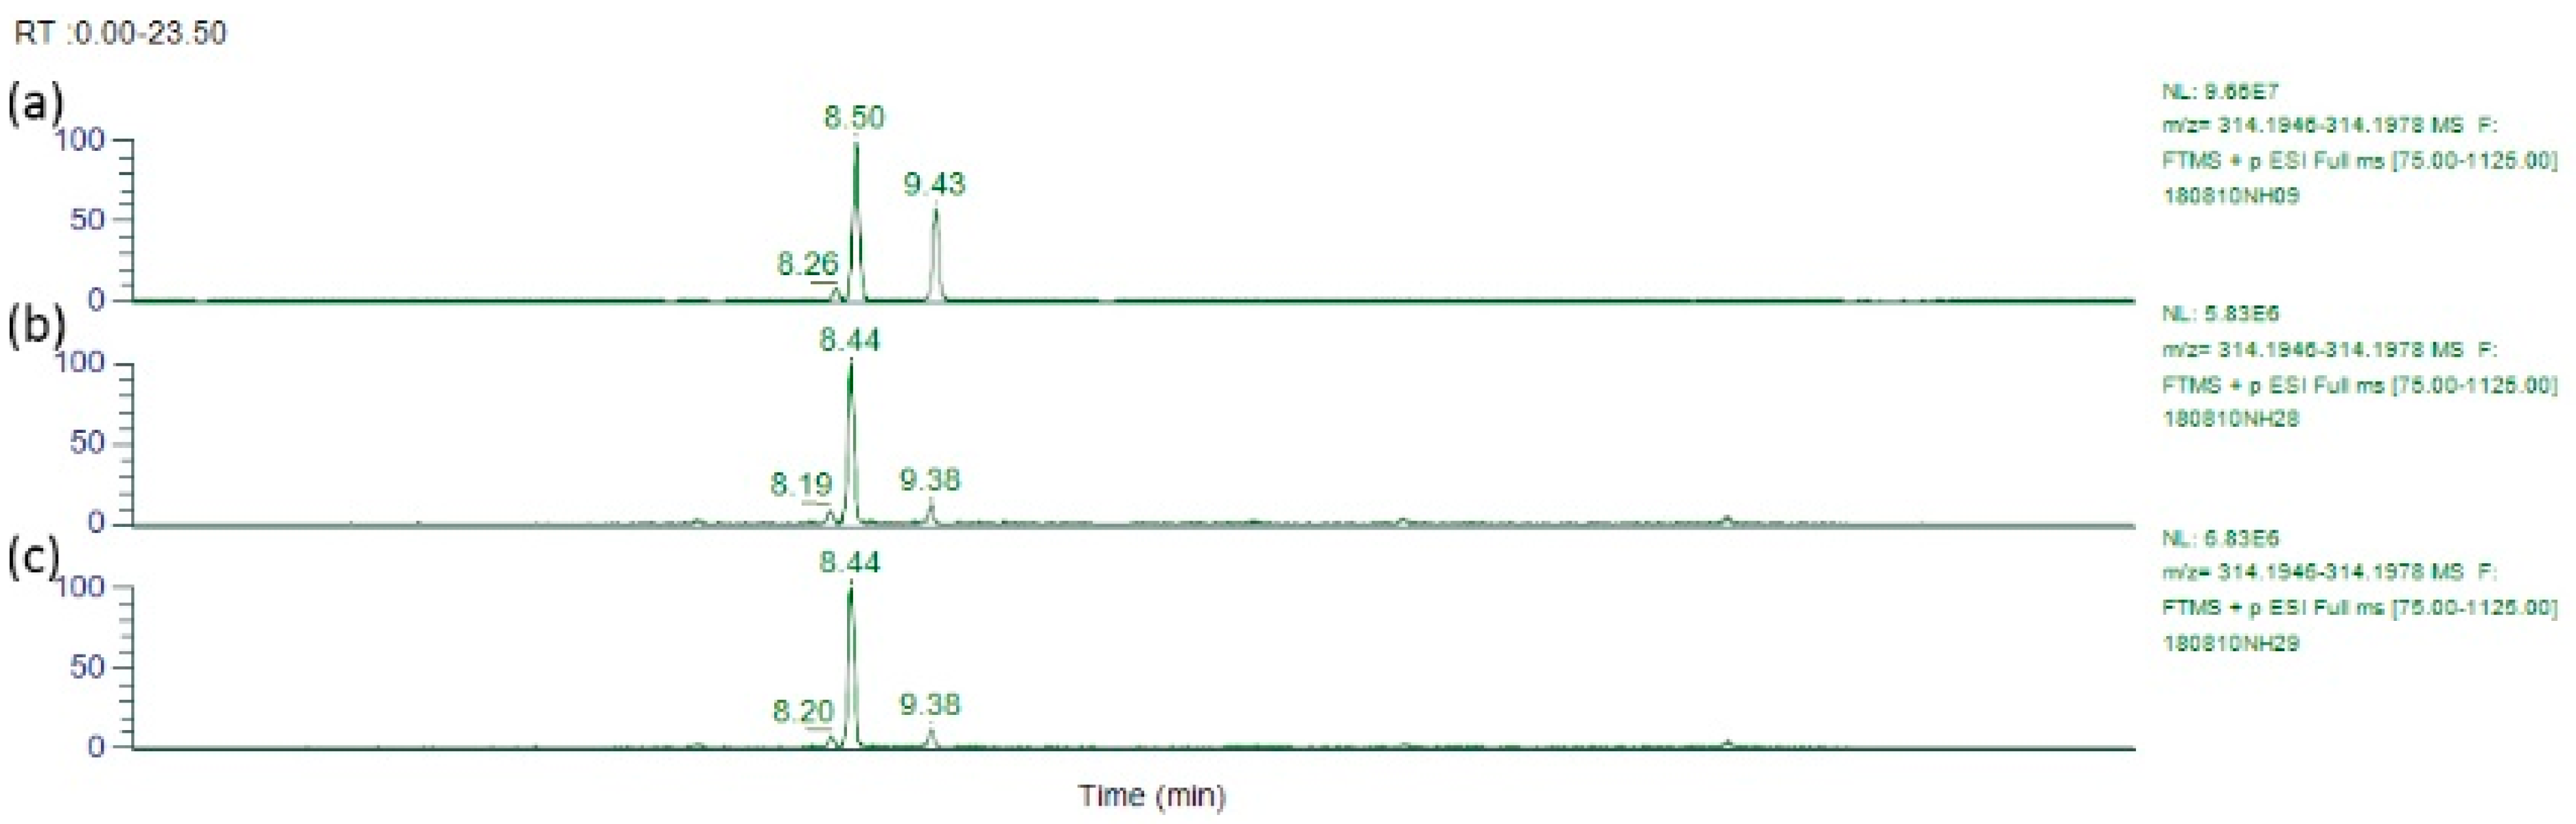
2.3. LC-MS/MS Separation of Alkaloids
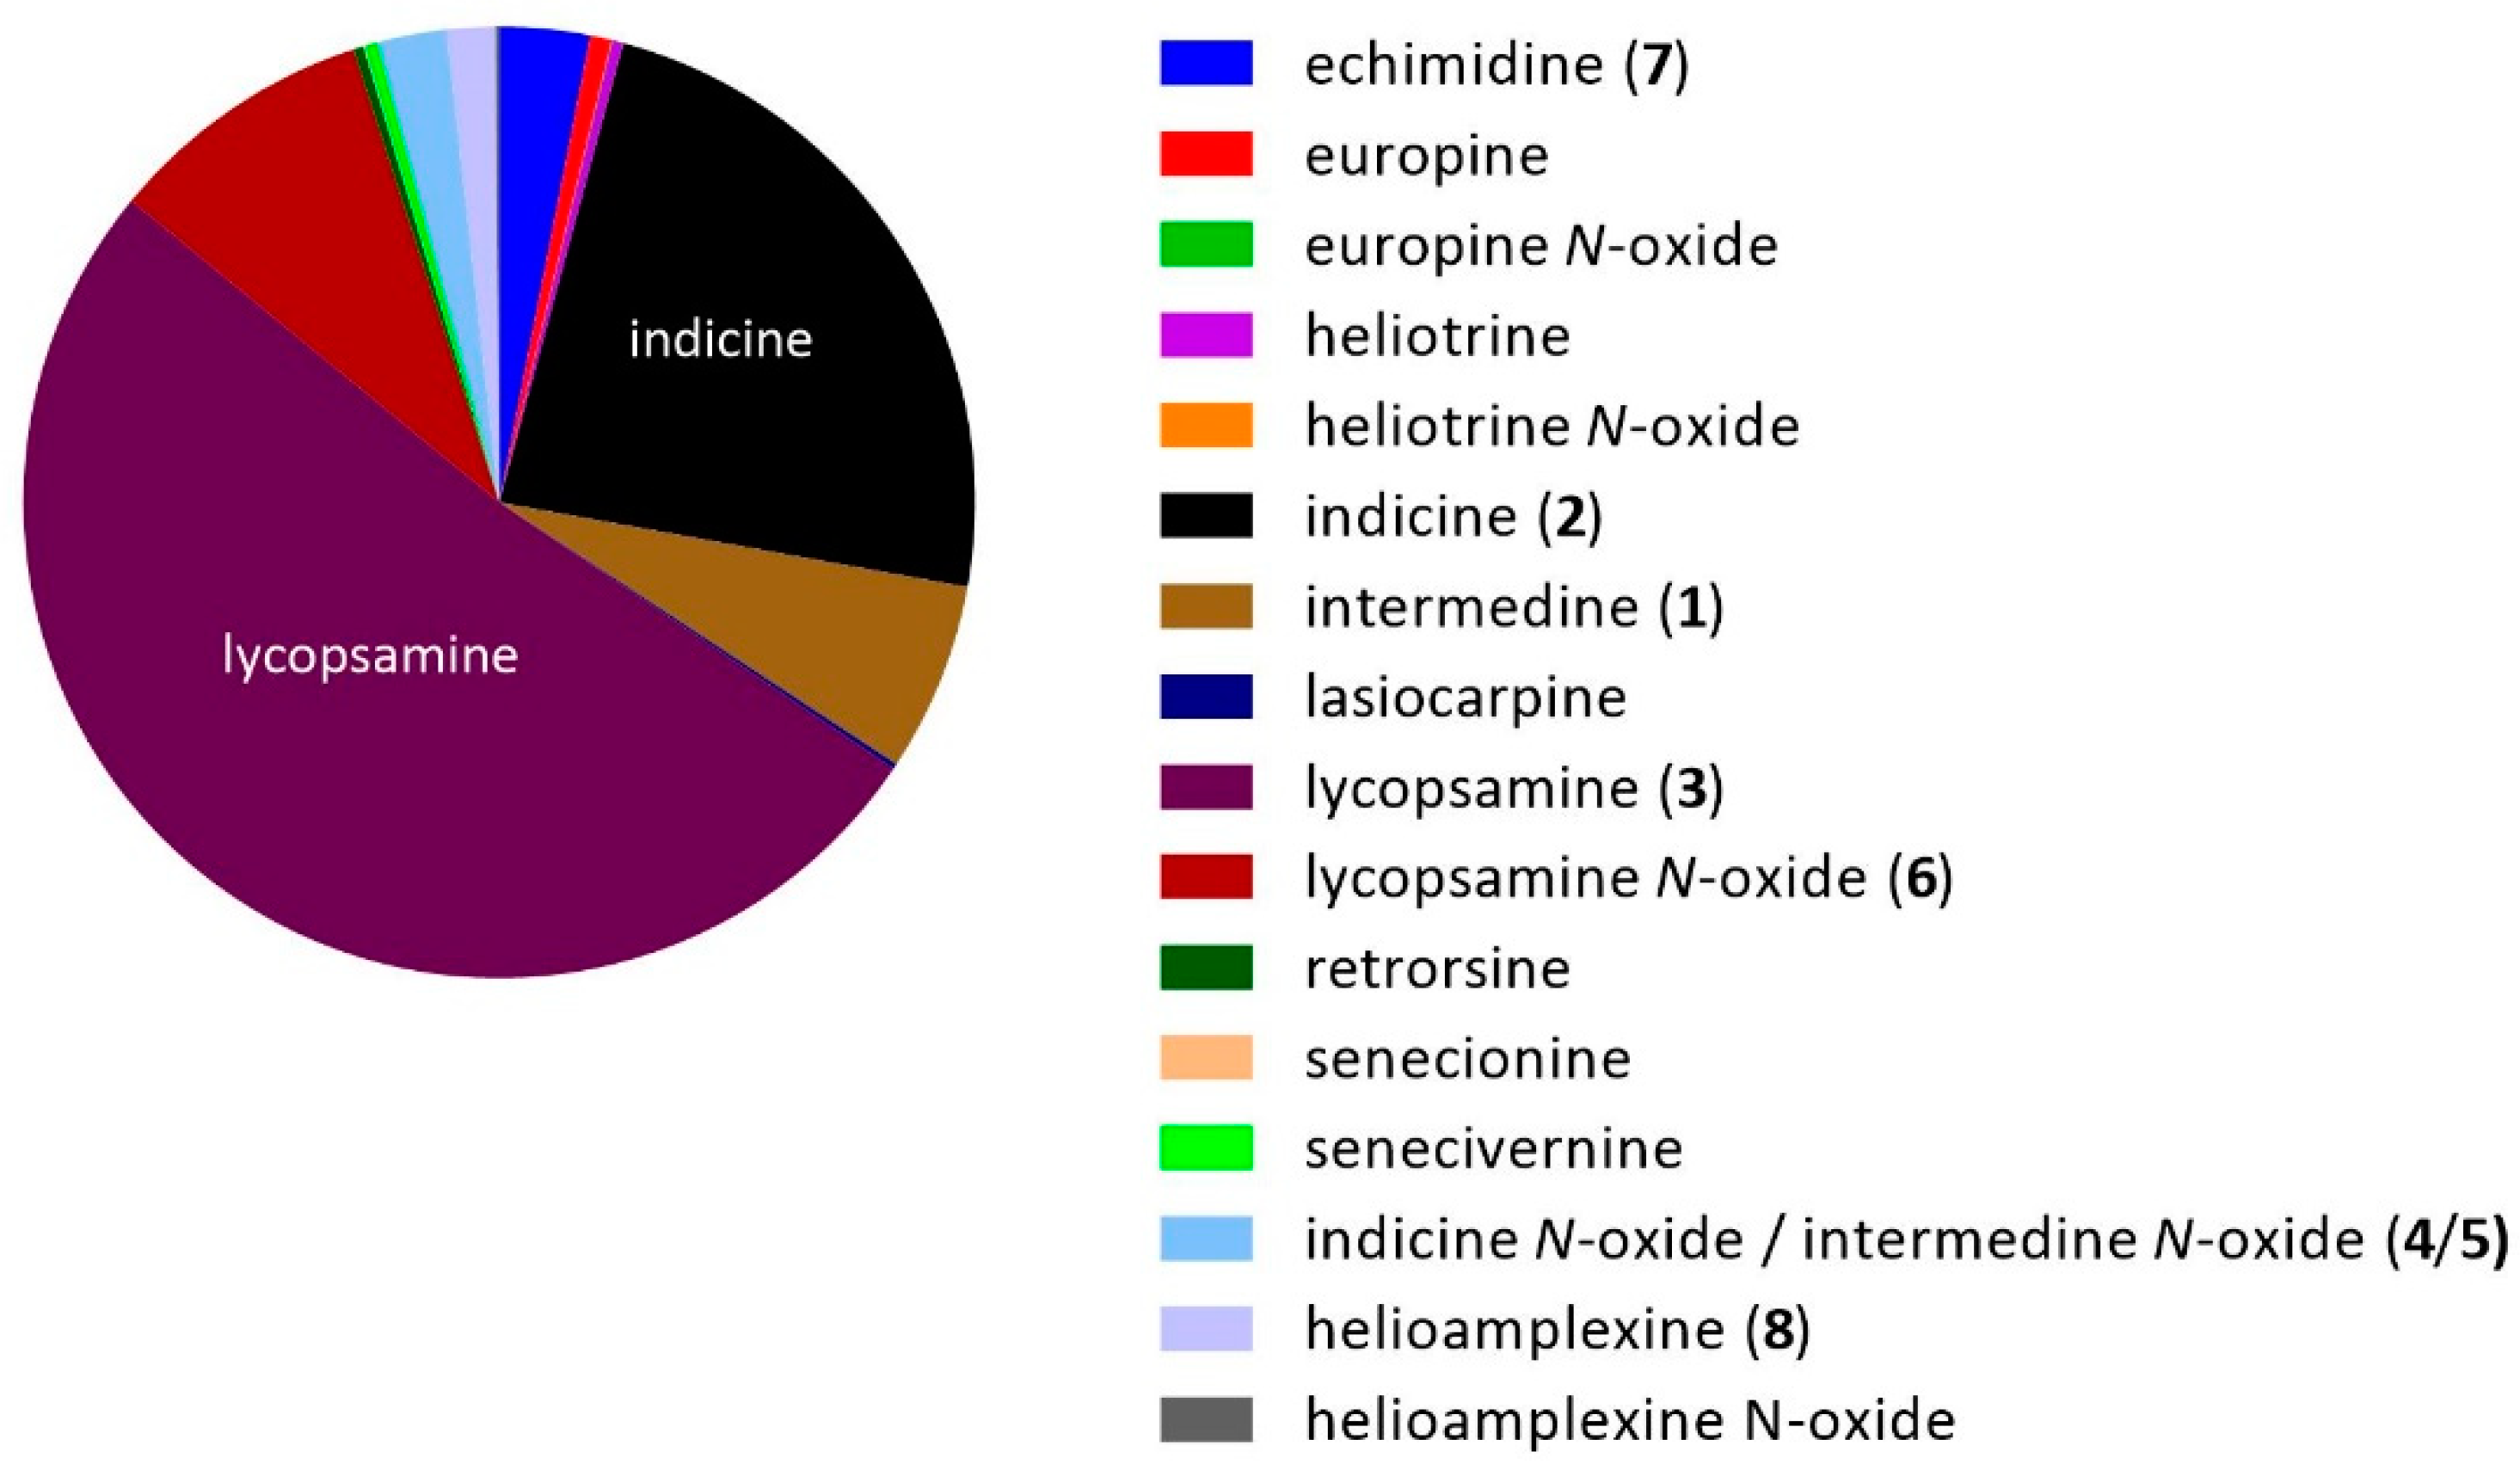
2.4. Predominant Alkaloids Present in Queensland Honeys
2.5. Plant Sources of Indicine (2) in Honey
2.6. Plant Sources of Lycopsamine (3) in Honey
2.7. Pyrrolizidine Alkaloids Determined in Parsonsia Vines
2.8. Honey PA Profiles Linked to P. straminea
2.9. Plant Origins of PAs in Honeys Surveyed
2.10. Honey as a Dietary Source of Pyrrolizidine Alkaloids
3. Conclusions
4. Materials and Methods
4.1. Chemicals and Solvents
4.2. Honey Samples
4.3. Honey Alkaloid Extraction
4.4. Honey Method Validation
4.5. Plant Alkaloid Extraction
4.5.1. Plant Source
4.5.2. Foliage and Seed Pod Extracts
4.5.3. Whole Flower Extracts
4.5.4. Zinc Reduced Extracts
4.5.5. Floral Nectar Extract
4.5.6. Pollen Extract
4.6. HRAM LC-MS/MS Analysis
Author Contributions
Funding
Conflicts of Interest
References
- Avula, B.; Sagi, S.; Wang, Y.-H.; Zweigenbaum, J.; Wang, M.; Khan, I.A. Characterization and screening of pyrrolizidine alkaloids and N-oxides from botanicals and dietary supplements using UHPLC-high resolution mass spectrometry. Food Chem. 2015, 178, 136–148. [Google Scholar] [CrossRef]
- Smith, L.W.; Culvenor, C.C.J. Plant sources of hepatotoxic pyrrolizidine alkaloids. J. Nat. Prod. 1981, 44, 129–152. [Google Scholar] [CrossRef]
- Stegemann, T.; Kruse, L.H.; Brutt, M.; Ober, D. Specific Distribution of Pyrrolizidine Alkaloids in Floral Parts of Comfrey (Symphytum officinale) and its Implications for Flower Ecology. J. Chem. Ecol. 2019, 45, 128–135. [Google Scholar] [CrossRef]
- Edgar, J.A.; Colegate, S.M.; Boppre, M.; Molyneux, R.J. Pyrrolizidine alkaloids in food: A spectrum of potential health consequences. Food Addit. Contam. Part. A 2011, 28, 308–324. [Google Scholar] [CrossRef]
- FSANZ. Pyrrolizidine Alkaloids in Food. A Toxicological Reveiw and Risk Assessment; Technical Report Series No. 2; Australia New Zealand Food Authority: Canberra, Australia, 2001. Available online: www.foodstandards.gov.au/publications/documents/TR2.pdf (accessed on 17 December 2019).
- Alexander, J.; Benford, D.; Boobis, A.; Ceccatelli, S.; Cottrill, B.; Cravedi, J.-P.; Di Domenico, A.; Doerge, D.; Dogliotti, E.; Edler, L.; et al. Scientific opinion on pyrrolizidine alkaloids in food and feed. EFSA J. 2011, 9, 2406. [Google Scholar] [CrossRef]
- COT. COT Statement on Pyrrolizidine Alkaloids in Food. Available online: https://cot.food.gov.uk/sites/default/files/cot/cotstatementpa200806.pdf (accessed on 2 August 2019).
- BfR. Bundesinstitut für Risikobewertung (The Federal Instituteof Risk Assessment). International Collaborative Study for the Determination of Pyrrolizidine Alkaloids in Honey and Herbal Tea by SPE-LC-MS/MS. Available online: http://www.bfr.bund.de/cm/350/international-collaborative-study-for-the-determination-of-pyrrolizidine-alkaloids-in-honey-and-herbal-tea-by-spe-lc-ms-ms.pdf (accessed on 19 April 2016).
- Dusemund, B.; Nowak, N.; Sommerfeld, C.; Lindtner, O.; Schäfer, B.; Lampen, A. Risk assessment of pyrrolizidine alkaloids in food of plant and animal origin. Food Chem. Toxicol. 2018, 115, 63–72. [Google Scholar] [CrossRef] [PubMed]
- European Food Safety Authority. Risks for human health related to the presence of pyrrolizidine alkaloids in honey, tea, herbal infusions and food supplements. EFSA J. 2017, 15, 4908. [Google Scholar] [CrossRef] [Green Version]
- Beales, K.A.; Betteridge, K.; Colegate, S.M.; Edgar, J.A. Solid-phase extraction and LC-MS analysis of pyrrolizidine alkaloids in honeys. J. Agric. Food. Chem. 2004, 52, 6664–6672. [Google Scholar] [CrossRef] [PubMed]
- Griffin, C.T.; Mitrovic, S.M.; Danaher, M.; Furey, A. Development of a fast isocratic LC-MS/MS method for the high-throughput analysis of pyrrolizidine alkaloids in Australian honey. Food Addit. Contam. Part. A 2014, 32, 214–228. [Google Scholar] [CrossRef] [PubMed]
- Culvenor, C.C.J.; Edgar, J.A.; Smith, L.W. Pyrrolizidine alkaloids in honey from Echium plantagineum L. J. Agric. Food Chem. 1981, 29, 958–960. [Google Scholar] [CrossRef] [PubMed]
- Julien, M.H. Biological control of rangeland weeds in Australia. Rangel. J. 2006, 28, 47. [Google Scholar] [CrossRef]
- Fletcher, M.T.; McKenzie, R.A.; Blaney, B.J.; Reichmann, K.G. Pyrrolizidine alkaloids in Crotalaria taxa from northern Australia: Risk to grazing livestock. J. Agric. Food. Chem. 2009, 57, 311–319. [Google Scholar] [CrossRef] [PubMed]
- Fletcher, M.T.; Hayes, P.Y.; Somerville, M.J.; De Voss, J.J. Crotalaria medicaginea associated with horse deaths in northern Australia: New pyrrolizidine alkaloids. J. Agric. Food. Chem. 2011, 59, 11888–11892. [Google Scholar] [CrossRef] [PubMed]
- McKenzie, R.A. Australia’s Poisonous Plants, Fungi and Cyanobacteria; CSIRO Publishing: Collingwood, Australia, 2012. [Google Scholar]
- Edgar, J.A. Pyrrolizidine alkaloids sequestered by Solomon Island Danaine butterflies. The feeding preferences of the Danainae and Ithomiinae. J. Zool. 1982, 196, 385–399. [Google Scholar] [CrossRef]
- Abe, F.; Nagao, T.; Okabe, H.; Yamauchi, T. Macrocyclic pyrrolizidine alkaloids from Parsonsia laevigata. Phytochemistry 1991, 30, 1737–1739. [Google Scholar] [CrossRef]
- Honda, K.; Hayashi, N.; Abe, F.; Yamauchi, T. Pyrrolizidine Alkaloids Mediate Host–Plant Recognition by Ovipositing Females of an Old World Danaid Butterfly, Idea leuconoe. J. Chem. Ecol. 1997, 23, 1703–1713. [Google Scholar] [CrossRef]
- Plants of the World Online (POWO). Facilitated by the Royal Botanic Gardens: Kew, UK. Available online: http://www.plantsoftheworldonline.org/ (accessed on 15 November 2019).
- NATA General Accreditation Guidance—Validation and Verification of Quantitative and Qualitative Test Methods. January 2018. Available online: https://www.nata.com.au/phocadownload/gen-accreditation-guidance/Validation-and-Verification-of-Quantitative-and-Qualitative-Test-Methods.pdf (accessed on 22 May 2019).
- NATA General Accreditation Guidance—Estimating and Reporting Measurement Uncertainty of Chemical Test Results. January 2018. Available online: https://www.nata.com.au/phocadownload/gen-accreditation-guidance/Estimating-and-reporting-measurement-uncertainty-of-chemical-test-results.pdf (accessed on 22 May 2019).
- EU Reference Laboratories for Residues of Pesticides. Method Validation & Quality Control Procedures for Pesticide Residues Analysis in Food & Feed, SANTE/11813/2017. Available online: https://www.eurl-pesticides.eu/docs/public/tmplt_article.asp?CntID=727 (accessed on 20 November 2019).
- Carpinelli de Jesus, M.; Hungerford, N.L.; Carter, S.J.; Anuj, S.R.; Blanchfield, J.T.; De Voss, J.J.; Fletcher, M.T. Pyrrolizidine Alkaloids of Blue Heliotrope (Heliotropium amplexicaule) and Their Presence in Australian Honey. J. Agric. Food. Chem. 2019, 67, 7995–8006. [Google Scholar] [CrossRef]
- Wuilloud, J.C.; Gratze, S.R.; Gamble, B.M.; Wolnik, K.A. Simultaneous analysis of hepatotoxic pyrrolizidine alkaloids and N-oxides in comfrey root by LC-ion trap mass spectrometry. Analyst 2004, 129, 150–156. [Google Scholar] [CrossRef]
- Kempf, M.; Wittig, M.; Reinhard, A.; von der Ohe, K.; Blacquiere, T.; Raezke, K.-P.; Michel, R.; Schreier, P.; Beuerle, T. Pyrrolizidine alkaloids in honey: Comparison of analytical methods. Food Addit. Contam. Part. A 2011, 28, 332–347. [Google Scholar] [CrossRef] [Green Version]
- Gottschalk, C.; Huckauf, A.; Dubecke, A.; Kaltner, F.; Zimmermann, M.; Rahaus, I.; Beuerle, T. Uncertainties in the determination of pyrrolizidine alkaloid levels in naturally contaminated honeys and comparison of results obtained by different analytical approaches. Food Addit. Contam. Part. A 2018, 35, 1366–1383. [Google Scholar] [CrossRef]
- Kaltner, F.; Stiglbauer, B.; Rychlik, M.; Gareis, M.; Gottschalk, C. Development of a sensitive analytical method for determining 44 pyrrolizidine alkaloids in teas and herbal teas via LC-ESI-MS/MS. Anal. Bioanal. Chem. 2019. [Google Scholar] [CrossRef] [PubMed]
- Wang, T.; Frandsen, H.L.; Christiansson, N.R.; Rosendal, S.E.; Pedersen, M.; Smedsgaard, J. Pyrrolizidine alkaloids in honey: Quantification with and without standards. Food Control. 2019, 98, 227–237. [Google Scholar] [CrossRef] [Green Version]
- Tamošiūnas, V.; Mischke, C.; Mulder, P.P.J.; Stroka, J. EU Publications. In Report on the 2012 Proficiency Test on Pyrrolizidine Alkaloids in Honey and Hay; Institute for Reference Materials and Measurements (Joint Research Centre): Luxembourg, 2013. [Google Scholar] [CrossRef]
- Mulder, P.P.J.; Sánchez, P.L.; These, A.; Preiss-Weigert, A.; Castellari, M. Occurrence of Pyrrolizidine Alkaloids in food. EFSA Support. Publ. 2015, EN-859. [Google Scholar] [CrossRef]
- Crews, C. Methods for Analysis of Pyrrolizidine Alkaloids. In Natural Products; Ramawat, K.G., Merillon, J.M., Eds.; Spinger: Berlin/Heidelberg, Germany, 2013; pp. 1049–1068. [Google Scholar]
- Van de Schans, M.G.M.; Blokland, M.H.; Zoontjes, P.W.; Mulder, P.P.J.; Nielen, M.W.F. Multiple heart-cutting two dimensional liquid chromatography quadrupole time-of-flight mass spectrometry of pyrrolizidine alkaloids. J. Chromatogr. A 2017, 1503, 38–48. [Google Scholar] [CrossRef] [PubMed]
- Griffin, C.T.; O’Mahony, J.; Danaher, M.; Furey, A. Liquid Chromatography Tandem Mass Spectrometry Detection of Targeted Pyrrolizidine Alkaloids in Honeys Purchased within Ireland. Food Anal. Method. 2015, 8, 18–31. [Google Scholar] [CrossRef]
- Colegate, S.M.; Edgar, J.A.; Knill, A.M.; Lee, S.T. Solid-phase extraction and HPLC-MS profiling of pyrrolizidine alkaloids and their N-oxides: A case study of Echium plantagineum. Phytochem. Anal. 2005, 16, 108–119. [Google Scholar] [CrossRef] [PubMed]
- Skoneczny, D.; Weston, P.A.; Zhu, X.; Gurr, G.M.; Callaway, R.M.; Weston, L.A. Metabolic Profiling of Pyrrolizidine Alkaloids in Foliage of Two Echium spp. Invaders in Australia—A Case of Novel Weapons? Int. J. Mol. Sci. 2015, 16, 26721–26737. [Google Scholar] [CrossRef] [Green Version]
- Atlas of Living Australia website. Echium plantagineum L. Available online: https://bie.ala.org.au/species/http://id.biodiversity.org.au/node/apni/2889451. (accessed on 1 August 2019).
- European Food Safety Authority. Scientific Opinion on Pyrrolizidine alkaloids in food and feed. EFSA J. 2011, 9, 2406. [Google Scholar] [CrossRef]
- Atlas of Living Australia Website. Available online: https://www.ala.org.au (accessed on 1 August 2019).
- Okunade, A.L. Ageratum conyzoides L. Asteraceae Fitoterapia 2002, 73, 1–16. [Google Scholar] [CrossRef]
- Wiedenfeld, H.; Roder, E. Pyrrolizidine Alkaloids from Ageratum conyzoides. Planta Med. 1991, 57, 578–579. [Google Scholar] [CrossRef]
- Molyneux, R.J.; Gardner, D.L.; Colegate, S.M.; Edgar, J.A. Pyrrolizidine alkaloid toxicity in livestock: A paradigm for human poisoning? Food Addit. Contam. Part. A 2011, 28, 293–307. [Google Scholar] [CrossRef] [PubMed]
- Bosi, C.F.; Rosa, D.W.; Grougnet, R.; Lemonakis, N.; Halabalaki, M.; Skaltsounis, A.L.; Biavatti, M.W. Pyrrolizidine alkaloids in medicinal tea of Ageratum conyzoides. Rev. Bras. Farmacogn. 2013, 23, 425–432. [Google Scholar] [CrossRef] [Green Version]
- Wiedenfeld, H.; Andrade-Cetto, A. Pyrrolizidine alkaloids from Ageratum houstonianum Mill. Phytochemistry 2001, 57, 1269–1271. [Google Scholar] [CrossRef] [Green Version]
- Culvenor, C.C.J.; Smith, L.W. The alkaloids of Amsinckia species: A. intermedia Fisch. & Mey., A. hispida (Ruiz. & Pav.) Johnst. and A. lycopsoides Lehm. Aust. J. Chem. 1966, 19, 1955. [Google Scholar] [CrossRef]
- Boppre, M.; Colegate, S.M. Recognition of pyrrolizidine alkaloid esters in the invasive aquatic plant Gymnocoronis spilanthoides (Asteraceae). Phytochem. Anal. 2015, 26, 215–225. [Google Scholar] [CrossRef]
- Edgar, J.A.; Culvenor, C.C.J. Pyrrolizidine ester alkaloid in danaid butterflies. Nature 1974, 248, 614–616. [Google Scholar] [CrossRef]
- Edgar, J.A.; Culvenor, C.C.J. Pyrrolizidine alkaloids in Parsonsia species (family Apocynaceae) which attract Danaid butterflies. Experientia 1975, 31, 393–394. [Google Scholar] [CrossRef]
- Burzynski, E.A.; Minbiole, K.P.C.; Livshultz, T. New sources of lycopsamine-type pyrrolizidine alkaloids and their distribution in Apocynaceae. Biochem. Syst. Ecol. 2015, 59, 331–339. [Google Scholar] [CrossRef]
- Orr, A.G.; Trigo, J.R.; Witte, L.; Hartmann, T. Sequestration of pyrrolizidine alkaloids by larvae of Tellervo zoilus (Lepidoptera: Ithomiinae) and their role in the chemical protection of adults against the spider Nephila maculata (Araneidae). Chemoecology 1996, 7, 68–73. [Google Scholar] [CrossRef]
- Reinhard, A.; Janke, M.; Ohe, W.; Kempf, M.; Theuring, C.; Hartmann, T.; Schreier, P.; Beuerle, T. Feeding Deterrence and Detrimental Effects of Pyrrolizidine Alkaloids Fed to Honey Bees (Apis mellifera). J. Chem. Ecol. 2009, 35, 1086–1095. [Google Scholar] [CrossRef]
- Atlas of Living Australia website. Parsonsia straminea (R.Br.) F. Muell. Available online: https://bie.ala.org.au/species/http://id.biodiversity.org.au/node/apni/2899618 (accessed on 21 February 2019).
- Colegate, S.M.; Welsh, S.L.; Gardner, D.R.; Betz, J.M.; Panter, K.E. Profiling of dehydropyrrolizidine alkaloids and their N-oxides in herbarium-preserved specimens of Amsinckia species using HPLC-esi (+) MS. J. Agric. Food. Chem. 2014, 62, 7382–7392. [Google Scholar] [CrossRef] [PubMed]
- Kelley, R.B.; Seiber, J.N. Pyrrolizidine alkaloid chemosystematics in Amsinckia. Phytochemistry 1992, 31, 2369–2387. [Google Scholar] [CrossRef]
- These, A.; Bodi, D.; Ronczka, S.; Lahrssen-Wiederholt, M.; Preiss-Weigert, A. Structural screening by multiple reaction monitoring as a new approach for tandem mass spectrometry: Presented for the determination of pyrrolizidine alkaloids in plants. Anal. Bioanal. Chem. 2013, 405, 9375–9383. [Google Scholar] [CrossRef] [PubMed]
- Jin, Y.-P.; Wei, X.-N.; Shi, Y.-P. Chemical Constituents from Cynoglossum gansuense. Helv. Chim. Acta 2007, 90, 776–782. [Google Scholar] [CrossRef]
- Nishida, R.; Kim, C.-S.; Fukami, H.; Irik, R. Ideamine N-Oxides: Pyrrolizidine Alkaloids Sequestered by the Danaine Butterfly, Idea leuconoe. Agric. Biol. Chem. 1991, 55, 1787–1792. [Google Scholar] [CrossRef]
- Hartmann, T.; Theuring, C.; Witte, L.; Schulz, S.; Pasteels, J.M. Biochemical processing of plant acquired pyrrolizidine alkaloids by the neotropical leaf-beetle Platyphora boucardi. Insect Biochem. Mol. Biol. 2003, 33, 515–523. [Google Scholar] [CrossRef]
- Roitman, J.N. The pyrrolizidine alkaloids of Amsinckia Menziesii. Aust. J. Chem. 1983, 36. [Google Scholar] [CrossRef]
- Stermitz, F.R.; Pass, M.A.; Kelley, R.B.; Liddell, J.R. Pyrrolizidine Alkaloids from Cryptantha Species. Phytochemistry 1993, 33, 383–387. [Google Scholar] [CrossRef]
- Edgar, J.A.; Roeder, E.; Molyneux, R.J. Honey from Plants Containing Pyrrolizidine Alkaloids: A Potential Threat to Health. J. Agric. Food Chem. 2002, 50, 2719–2730. [Google Scholar] [CrossRef]
- Gardner, D.R.; Thorne, M.S.; Molyneux, R.J.; Pfister, J.A.; Seawright, A.A. Pyrrolizidine alkaloids in Senecio madagascariensis from Australia and Hawaii and assessment of possible livestock poisoning. Biochem. Syst. Ecol. 2006, 34, 736–744. [Google Scholar] [CrossRef]
- Atlas of Living Australia Website. Heliotropium amplexicaule Vahl. Available online: https://bie.ala.org.au/species/http://id.biodiversity.org.au/node/apni/2917623 (accessed on 1 August 2019).
- Dubecke, A.; Beckh, G.; Lullmann, C. Pyrrolizidine alkaloids in honey and bee pollen. Food Addit. Contam. Part. A 2011, 28, 348–358. [Google Scholar] [CrossRef] [PubMed]
- Fu, P.P.; Xia, Q.; Lin, G.; Chou, M.W. Pyrrolizidine alkaloids—genotoxicity, metabolism enzymes, metabolic activation, and mechanisms. Drug Metab. Rev. 2004, 36, 1–55. [Google Scholar] [CrossRef] [PubMed]
- European Food Safety Authority. Dietary exposure assessment to pyrrolizidine alkaloids in the European population European Food Safety Authority (EFSA). EFSA J. 2016, 14, 4572. [Google Scholar] [CrossRef] [Green Version]
- Crews, C.; Beuerle, T. The Analysis of Pyrrolizidine Alkaloids in Honey. In Analysis of Food Toxins and Toxicants; Wong, Y.-C., Lewis, R.J., Eds.; John Wiley & Sons Ltd.: Hoboken, NJ, USA, 2017; pp. 237–266. [Google Scholar]
- Fu, P.P. Pyrrolizidine Alkaloids: Metabolic Activation Pathways Leading to Liver Tumor Initiation. Chem. Res. Toxicol. 2017, 30, 81–93. [Google Scholar] [CrossRef] [PubMed]


| Compound | Formula | Average RT (min) | Precursor Ion (MH+) | Product Ions | |||||
|---|---|---|---|---|---|---|---|---|---|
| Echimidine (7) | C20H31NO7 | 12.86 | 398.2173 | 120.0809 | 83.0497 | 55.0550 | |||
| Echimidine N-oxide | C20H31NO8 | 12.80 | 414.2122 | 396.2004 | 352.1745 | 254.1379 | 220.1326 | 137.0833 | |
| Erucifoline | C18H23NO6 | 6.23 | 350.1598 | 322.1642 | 220.1329 | 164.1066 | 138.0911 | 120.0807 | |
| Erucifoline N-oxide | C18H23NO7 | 8.03 | 366.1547 | 278.1386 | 218.1172 | 164.1067 | 136.0756 | 119.0729 | |
| Europine | C16H27NO6 | 6.97 | 330.1911 | 254.1385 | 156.1019 | 138.0914 | 120.0810 | 96.0812 | |
| Europine N-oxide | C16H27NO7 | 7.86 | 346.1860 | 328.1743 | 270.1328 | 256.1172 | 172.0964 | 155.0937 | |
| Helioamplexine | C16H27NO5 | 9.21 | 314.1962 | 156.1017 | 138.0913 | 120.0808 | 94.0655 | ||
| Helioamplexine N-oxide | C16H27NO6 | 10.42 | 330.1911 | 172.0966 | 155.0938 | 138.0913 | 111.0913 | 94.0653 | |
| Heliotrine | C16H27NO5 | 9.56 | 314.1962 | 156.1017 | 138.0913 | 120.0808 | 94.0655 | ||
| Heliotrine N-oxide | C16H27NO6 | 10.46 | 330.1911 | 172.0966 | 155.0938 | 138.0913 | 111.0913 | 94.0653 | |
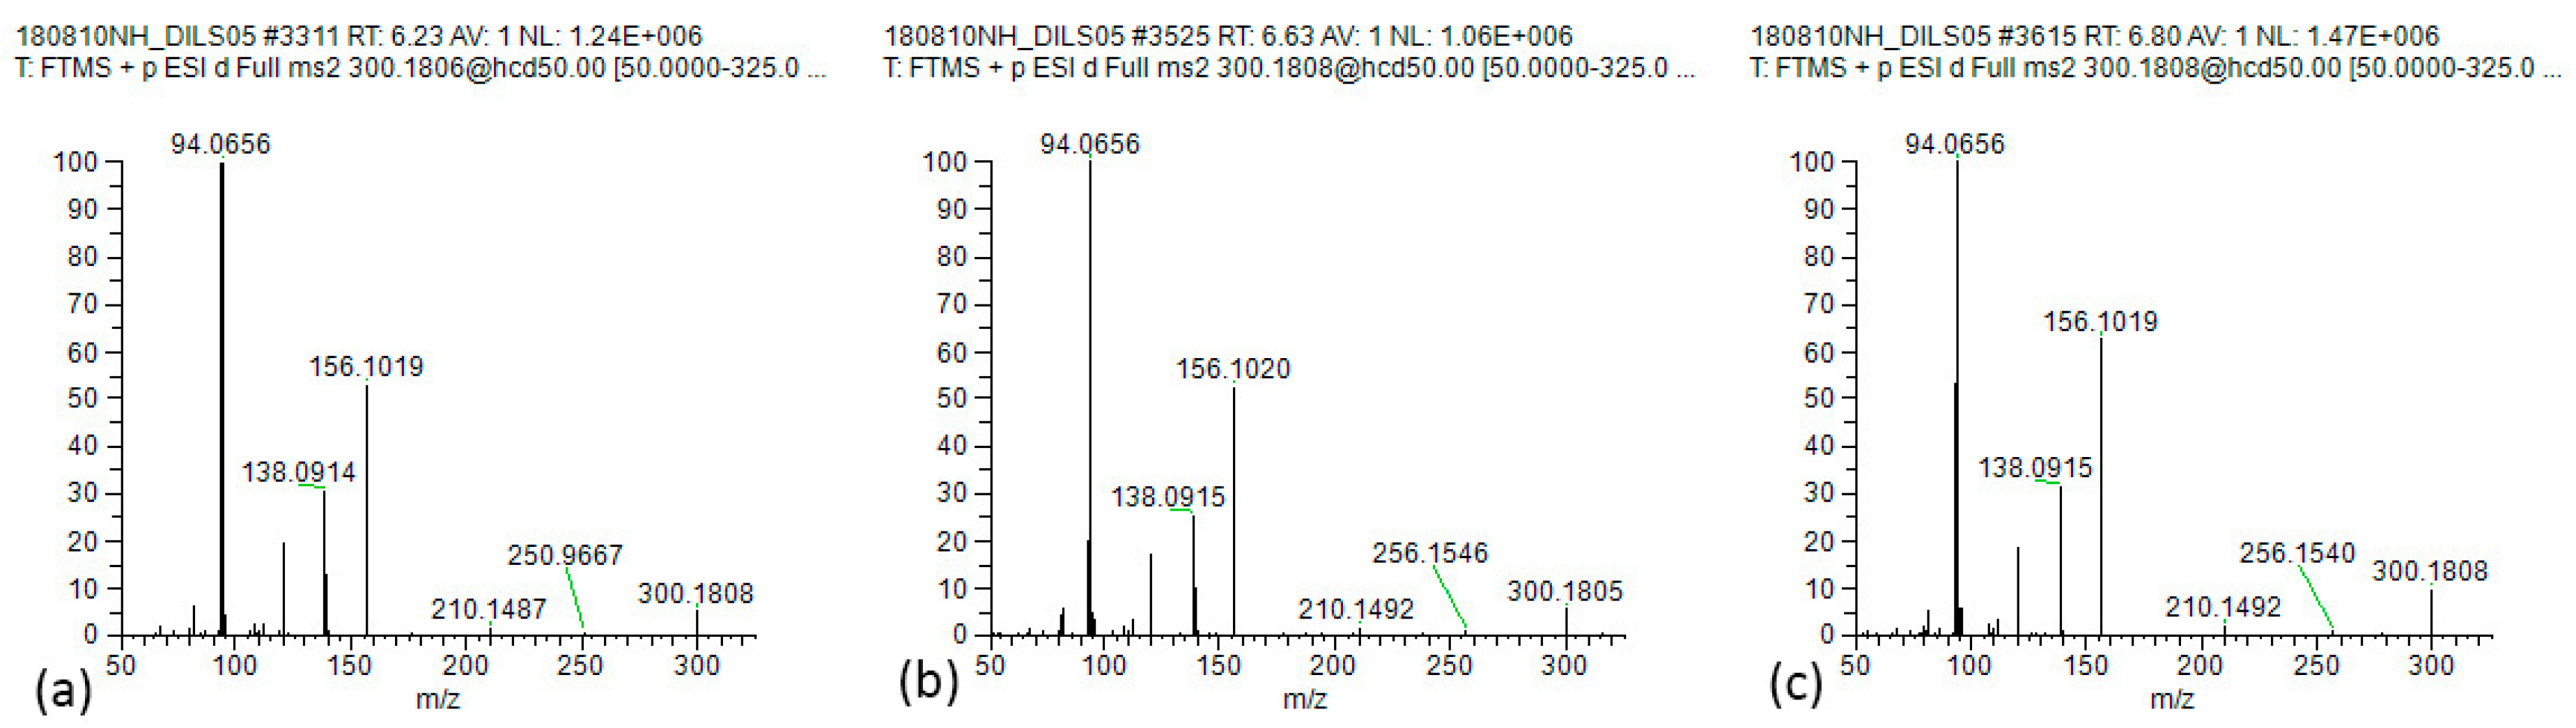
| Indicine (2) | C15H25NO5 | 6.67 | 300.1806 | 156.1019 | 138.0914 | 120.0810 | 94.0656 | 82.0657 | |
| Indicine N-oxide (5) and intermedine N-oxide (4) (n.r.) a | C15H25NO6 | 8.20 | 316.1755 | 226.1437 | 172.0968 | 155.0941 | 138.0914 | 111.0682 | 94.0656 |
| Intermedine (1) | C15H25NO5 | 6.26 | 300.1806 | 210.1488 | 156.1019 | 138.0914 | 120.0810 | 94.0656 | |
| Jacobine | C18H25NO6 | 6.56 | 352.1755 | 308.1485 | 280.1539 | 262.1432 | 234.1483 | 155.1063 | |
| Jacobine N-oxide | C18H25NO7 | 7.91 | 368.1704 | 296.1485 | 190.1222 | 139.0989 | 121.0885 | 120.0807 | |
| Lasiocarpine | C21H33NO7 | 14.92 | 412.2330 | 238.1435 | 156.1020 | 138.0914 | 120.0810 | 94.0656 | |
| Lasiocarpine N-oxide | C21H33NO8 | 16.14 | 428.2279 | 410.2168 | 352.1746 | 328.1753 | 254.1384 | 220.1333 | 137.0835 |
| Lycopsamine (3) | C15H25NO5 | 6.80 | 300.1806 | 156.1017 | 138.0914 | 120.0808 | 94.0655 | ||
| Lycopsamine N-oxide (6) | C15H25NO6 | 8.65 | 316.1755 | 172.0964 | 155.0937 | 138.0911 | 136.0755 | 94.0654 | |
| Monocrotaline | C16H23NO6 | 2.88 | 326.1598 | 280.1548 | 237.1354 | ||||
| Monocrotaline N-oxide | C16H23NO7 | 7.19 | 342.1547 | 314.1590 | 296.1487 | 236.1274 | 137.0833 | 119.0729 | |
| Retrorsine | C18H25NO6 | 9.13 | 352.1755 | 324.1802 | 138.0913 | 120.0808 | 94.0655 | ||
| Retrorsine N-oxide | C18H25NO7 | 9.64 | 368.1704 | 220.1340 | 154.0862 | ||||
| Senecionine | C18H25NO5 | 11.13 | 336.1806 | 308.1864 | 120.0809 | ||||
| Senecionine N-oxide | C18H25NO6 | 11.83 | 352.1755 | 324.1825 | 220.1332 | ||||
| Seneciphylline | C18H23NO5 | 9.52 | 334.1649 | 306.1706 | 120.0811 | ||||
| Seneciphylline N-oxide | C18H23NO6 | 10.46 | 350.1598 | 322.1656 | 246.1495 | ||||
| Senecivernine | C18H25NO5 | 10.84 | 336.1806 | 308.1848 | 153.0907 | 138.0911 | 120.0807 | 94.0654 | |
| Senecivernine N-oxide | C18H25NO6 | 11.45 | 352.1755 | 324.1795 | 220.1327 | 154.0859 | 136.0755 | 120.0807 | |
| Senkirkine | C19H27NO6 | 13.62 | 366.1911 | 168.1020 | 150.0915 | ||||
| Trichodesmine | C18H27NO6 | 8.79 | 354.1911 | 308.1857 | 223.1203 | 222.1489 | 164.1071 | 121.0889 | |
| Display Name | Spiking Level (ng/g) | LOD (3s) | LOQ (9s) | LOR | Units | Recovery (%) | Calculated Standard Uncertainty (% RSD) |
|---|---|---|---|---|---|---|---|
| Echimidine (7) | 5 | 0.7 | 2 | 5 | ng/g | 88 | 11 |
| Echimidine N-oxide | 5 | 0.5 | 2 | 5 | ng/g | 60 | 15 |
| Erucifoline | 5 | 0.7 | 2 | 5 | ng/g | 34 | 26 |
| Erucifoline N-oxide | 5 | 0.5 | 2 | 5 | ng/g | 26 | 31 |
| Europine | 5 | 1 | 2 | 5 | ng/g | 98 | 16 |
| Europine N-oxide | 5 | 0.5 | 1 | 5 | ng/g | 94 | 6 |
| Heliotrine | 5 | 0.5 | 0.7 | 5 | ng/g | 108 | 4 |
| Heliotrine N-oxide | 5 | 0.2 | 0.5 | 5 | ng/g | 83 | 2 |
| Indicine | 5 | 0.5 | 2 | 5 | ng/g | 98 | 8 |
| Indicine N-oxide (5) and intermedine N-oxide (4) as indicine N-oxide (5) | 5 | 0.5 | 1 | 5 | ng/g | 78 | 7 |
| Intermedine (1) | 5 | 0.5 | 2 | 5 | ng/g | 94 | 8 |
| Jacobine | 5 | 2 | 5 | 5 | ng/g | 61 | 30 |
| Jacobine N-oxide | 5 | 1 | 5 | 5 | ng/g | 36 | 51 |
| Lasiocarpine | 5 | 0.5 | 1 | 5 | ng/g | 82 | 6 |
| Lasiocarpine N-oxide | 5 | 0.5 | 0.7 | 5 | ng/g | 79 | 6 |
| Lycopsamine (3) | 5 | 0.2 | 0.7 | 5 | ng/g | 95 | 4 |
| Lycopsamine N-oxide (6) | 5 | 0.7 | 2 | 5 | ng/g | 81 | 14 |
| Monocrotaline | 5 | 2 | 5 | 5 | ng/g | 89 | 24 |
| Monocrotaline N-oxide | 5 | 0.7 | 2 | 5 | ng/g | 89 | 13 |
| Retrorsine | 5 | 1 | 2 | 5 | ng/g | 96 | 13 |
| Retrorsine N-oxide | 5 | 0.7 | 2 | 5 | ng/g | 58 | 22 |
| Senecionine | 5 | 0.7 | 2 | 5 | ng/g | 90 | 11 |
| Senecionine N-oxide | 5 | 0.5 | 2 | 5 | ng/g | 58 | 16 |
| Seneciphylline | 5 | 0.7 | 2 | 5 | ng/g | 70 | 15 |
| Seneciphylline N-oxide | 5 | 0.5 | 1 | 5 | ng/g | 16 | 36 |
| Senecivernine | 5 | 0.5 | 2 | 5 | ng/g | 86 | 9 |
| Senecivernine N-oxide | 5 | 0.7 | 2 | 5 | ng/g | 53 | 20 |
| Senkirkine | 5 | 0.5 | 0.7 | 5 | ng/g | 91 | 5 |
| Trichodesmine | 5 | 3 | 7 | 7 | ng/g | 78 | 69 |
| Alkaloid | Typical RT (min) | Molecular Ion Formula | Calculated [M+H]+ | Observed [M+H]+ | Mass Spectral Data (Rel. Int. %) |
|---|---|---|---|---|---|
| Intermedine (1) | 6.27 | [C15H25NO5 + H] + | 300.1805 | 300.1804 | 300.1804 (6) 256.1539 (1) 156.1019 (53) 139.0992 (11) 138.0914 (31) 120.0809 (18) 112.0759 (2) 108.0811 (2) 96.0812 (4) 95.0733 (4) 94.0656 (100) 82.0657 (4) |
| Lycopsamine (3) | 6.80 | [C15H25NO5 + H] + | 300.1805 | 300.1805 | 300.1805 (9) 256.1539 (0.3) 156.1020 (59) 139.0993 (13) 138.0915 (31) 120.0811 (19) 112.0760 (3) 108.0813 (1) 96.0813 (5) 95.0734 (5) 94.0656 (100) 82.0657 (6) |
| Intermedine N-oxide (4) | 8.19 | [C15H25NO6 + H] + | 316.1755 | 316.1752 | 316.1752 (41) 298.1631 (1) 272.1491 (2) 172.0967 (100) 155.0940 (18) 154.0862 (8) 138.0914 (55) 137.0837 (6) 136.0757 (15) 112.0759 (5) 111.0682 (12) 94.0655 (19) 93.0577 (13) 82.0419 (3) |
| Lycopsamine N-oxide (6) | 8.64 | [C15H25NO6 + H] + | 316.1755 | 316.1752 | 316.1752 (46) 298.1653 (1) 272.1491 (2) 172.0967 (100) 155.0940 (17) 154.0862 (10) 138.0913 (63) 137.0835 (6) 136.0758 (17) 112.0759 (5) 111.0681 (13) 94.0655 (22) 93.0577 (16) 82.0419 (4) |
| Alkaloid | Typical RT (min) | Molecular Ion Formula | Calculated [M+H]+ | Observed [M+H]+ | Mass Spectral Data (Rel. Int. %) |
|---|---|---|---|---|---|
| * Tessellatine (9) or isomer | 6.34 | [C15H25NO5 + H] + | 300.1805 | 300.1801 | 300.1801 (5) 156.1019 (100) 139.0990 (1) 138.0913 (6) 120.0809 (2) 112.0759 (4) 108.0810 (6) 96.0811 (1) 94.0656 (4) 82.0655 (1) |
| Lycopsamine isomer (isomer of 3) | 5.91 | [C15H25NO5 + H] + | 300.1805 | 300.1803 | 300.1803 (7) 210.1485 (1) 156.1019 (42) 139.0992 (14) 138.0914 (26) 120.0809 (18) 112.0759 (2) 108.0812 (2) 96.0813 (5) 95.0734 (6) 94.0656 (100) 82.0657 (5) |
| * Helioamplexine isomer I (isomer of 8) | 8.51 | [C16H27NO5 + H] + | 314.1962 | 314.1958 | 314.1958 (7) 270.1704 (0.5) 224.1643 (2) 156.1019 (44) 139.0992 (19) 138.0914 (25) 120.0810 (18) 112.0759 (2) 96.0812 (5) 95.0734 (8) 94.0656 (100) 82.0657 (7) |
| * Helioamplexine isomer II (isomer of 8) | 9.30 | [C16H27NO5 + H] + | 314.1962 | 314.1958 | 314.1960 (5) 270.1698 (0.5) 224.1643 (2) 156.1019 (33) 139.0992 (14) 138.0914 (25) 120.0809 (18) 112.0759 (2) 96.0812 (4) 95.0733 (7) 94.0656 (100) 82.0657 (6) |
| * Helioamplexine isomer (C7-isomer of 8) | 8.34 | [C16H27NO5 + H] + | 314.1962 | 314.1959 | 314.1959 (4) 156.1019 (100) 139.0992 (2) 138.0914 (6) 126.0916 (1) 120.0808 (2) 112.0759 (5) 108.0810 (10) 94.0655 (1) 86.0605 (2) 82.0656 (1) 80.0500 (1) |
| * 3′-O-Acetylintermedine | 8.91 | [C17H27NO6 + H] + | 342.1911 | 342.1924 | 342.1924 (1) 282.1700 (4) 156.1019 (16) 139.0991 (7) 138.0913 (17) 120.0809 (20) 108.0812 (1) 96.0812 (2) 96.0450 (2) 95.0734 (3) 94.0655 (100) 82.0657 (3) |
| * 3′-O-Acetyllycopsamine | 9.64 | [C17H27NO6 + H] + | 342.1911 | 342.1905 | 342.1905 (1) 282.1703 (2) 156.1019 (14) 139.0992 (3) 138.0913 (19) 120.0809 (19) 108.0812 (1) 96.0812 (2) 96.0448 (1) 95.0734 (2) 94.0655 (100) 82.0657 (3) 67.0549 (1) |
| Ideamine A (10) isomer I | 2.43 | [C14H23NO5 + H] + | 286.1649 | 286.1648 | 286.1648 (11) 242.1392 (1) 196.1335 (2) 156.1019 (43) 139.0992 (11) 138.0914 (26) 120.0809 (18) 112.0758 (2) 108.0810 (2) 96.0813 (7) 95.0734 (5) 94.0656 (100) 82.0657 (5) |
| Ideamine A (10) isomer II | 3.70 | [C14H23NO5 + H] + | 286.1649 | 286.1649 | 286.1649 (8) 156.1019 (35) 139.0992 (8) 138.0913 (30) 120.0808 (18) 96.0813 (4) 95.0734 (4) 94.0655 (100) 94.0593 (1) 82.0657 (3) 80.0500 (1) 67.0547 (1) |
| Ideamine A (10) isomer III | 4.37 | [C14H23NO5 + H] + | 286.1649 | 286.1649 | 286.1649 (0) 156.1018 (46) 139.0992 (7) 138.0913 (26) 120.0807 (17) 98.2419 (3) 95.0733 (3) 94.0656 (100) 93.0705 (3) 82.0655 (4) 67.0549 (4) |
| Ideamine A (10) isomer IV | 5.10 | [C14H23NO5 + H] + | 286.1649 | 286.1651 | 286.1651 (16) 258.9584 (3) 190.8082 (4) 188.1787 (3) 158.5305 (3) 156.1016 (48) 138.0913 (29) 124.0405 (3) 120.0807 (18) 94.0655 (100) |
| Ideamine A C7 isomer | 1.72 | [C14H23NO5 + H] + | 286.1649 | 286.1656 | 286.1656 (10) 156.1019 (100) 138.0915 (5) 124.0757 (2) 120.0813 (1) 112.0760 (5) 108.0811 (7) 106.0656 (4) 94.0651 (2) 86.0603 (1) |
| Lycopsamine N-oxide isomer | 7.61 | [C15H25NO6 + H] + | 316.1755 | 316.1751 | 316.1754 (46) 172.0967 (100) 155.0940 (21) 154.0862 (13) 138.0914 (94) 137.0836 (8) 136.0757 (25) 112.0759 (8) 111.0681 (14) 108.0811 (6) 94.0656 (35) 93.0577 (24) |
| 7-Isomer of lycopsamine N-oxide | 7.19 | [C15H25NO6 + H] + | 316.1755 | 316.1751 | 316.1751 (5) 172.0968 (100) 155.0940 (6) 154.0863 (2) 138.0914 (3) 137.0836 (3) 136.0757 (2) 111.0681 (11) 106.0654 (6) 102.0555 (2) 94.0657 (1) |
| Helioamplexine N-oxide isomer I | 9.87 | [C16H27NO6 + H] + | 330.1911 | 330.1908 | 330.1908 (39) 286.1642 (4) 240.1594 (7) 172.0967 (100) 155.0940 (30) 154.0862 (11) 138.0914 (84) 136.0758 (22) 112.0760 (8) 111.0681 (18) 94.0655 (36) 93.0577 (20) 82.0419 (9) |
| Helioamplexine N-oxide isomer II | 10.63 | [C16H27NO6 + H] + | 330.1911 | 330.1909 | 330.1909 (46) 172.0967 (100) 155.0940 (30) 154.0862 (12) 138.0914 (91) 137.0835 (9) 136.0757 (23) 112.0759 (8) 111.0681 (20) 94.0655 (38) 93.0577 (26) 82.0419 (11) |
| 3′-O-Acetyllycopsamine N-oxide isomer I | 10.25 | [C17H27NO7+ H] + | 358.1860 | 358.1856 | 358.1856 (15) 316.1758 (4) 298.1649 (40) 172.0968 (100) 155.0941 (23) 154.0863 (10) 138.0914 (73) 136.0758 (21) 111.0682 (19) 94.0656 (33) 93.0577 (21) 89.0602 (19) 87.0446 (14) |
| 3′-O-Acetyllycopsamine N-oxide isomer II | 10.92 | [C17H27NO7+ H] + | 358.1860 | 358.1859 | 358.1859 (19) 316.1748 (4) 298.1648 (39) 172.0967 (100) 155.0940 (19) 154.0862 (14) 138.0914 (89) 137.0835 (8) 136.0758 (27) 112.0759 (7) 111.0681 (16) 94.0656 (44) 93.0577 (31) |
| 7-O-Acetyllycopsamine N-oxide | 10.03 | [C17H27NO7+ H] + | 358.1860 | 358.1857 | 358.1857 (21) 214.1073 (100) 180.1019 (48) 178.0863 (14) 137.0836 (53) 136.0758 (17) 120.0810 (16) 119.0731 (14) 106.0654 (13) 101.0601 (25) 89.0602 (15) 73.0291 (20) |
| Ideamine A N-oxide isomer I | 4.87 | [C14H23NO6+ H] + | 302.1598 | 302.1595 | 302.1595 (67) 212.1275 (4) 172.0966 (91) 155.0939 (18) 154.0864 (10) 138.0913 (100) 137.0834 (7) 136.0757 (20) 112.0759 (7) 111.0681 (11) 108.0810 (6) 94.0655 (31) 93.0577 (23) |
| Ideamine A N-oxide isomer II | 6.27 | [C14H23NO6+ H] + | 302.1598 | 302.1596 | 302.1596 (65) 172.0968 (96) 158.1181 (7) 155.0941 (18) 154.0861 (12) 138.0913 (100) 137.0835 (10) 136.0757 (26) 112.0759 (9) 111.0680 (9) 94.0656 (31) 93.0577 (24) |
| * 3′-O-Glucosyllycopsamine | 8.94 | [C21H35NO10 + H] + | 462.2336 | 462.2336 | 300.1806 (12) 156.1021 (16) 139.0994 (4) 138.0915 (40) 120.0810 (16) 97.0289 (3) 96.0813 (2) 96.0451 (2) 94.0657 (100) 85.0290 (7) |
| * 3′-O-Glucosylintermedine | 7.41 | [C21H35NO10 + H] + | 462.2336 | 462.2335 | 300.1807 (17) 156.1019 (20) 139.0993 (5) 138.0914 (48) 120.0810 (19) 97.0289 (4) 96.0813 (2) 94.0656 (100) 91.0580 (2) 85.0290 (10) |
| * 3′-O-Glucosyllycopsamine N-oxide | 9.89 | [C21H35NO11 + H] + | 478.2283 | 478.2286 | 316.1754 (100) 172.0968 (90) 155.0941 (15) 154.0860 (10) 138.0914 (74) 137.0837 (6) 136.0758 (19) 120.0809 (6) 112.0762 (5) 111.0680 (7) 94.0657 (47) 93.0578 (12) |
| * 3′-O-Glucosylintermedine N-oxide | 8.58 | [C21H35NO11 + H] + | 478.2283 | 478.2289 | 316.1758 (100) 172.0968 (76) 155.0943 (13) 154.0863 (9) 138.0916 (56) 137.0838 (7) 136.0757 (15) 120.0808 (7) 111.0681 (7) 94.0656 (29) 93.0578 (12) |
| Potential Plant Source of PAs in Honey | Pyrrolizidine Alkaloids | Number of Honey Samples | PA Content (ng/g) | ||
|---|---|---|---|---|---|
| Mean | Median | Max | |||
| Parsonsia straminea (Monkey rope) | |||||
| Lycopsamine | 274 | 210 | 33 | 3100 | |
| Lycopsamine N-oxide | 31 | 320 | 51 | 1900 | |
| Intermedine | 217 b | 32 | 18 | 290 | |
| Intermedine N-oxide a | 30 c | 86 | 21 | 660 | |
| Heliotropium amplexicaule (Blue heliotrope) | |||||
| Indicine | 221 | 120 | 31 | 1700 | |
| Indicine N-oxide/intermedine N-oxide (n.r.) a | 30 c | 86 | 21 | 660 | |
| Intermedine | 217 b | 32 | 18 | 290 | |
| Helioamplexine d | 78 | 23 | 13 | 130 | |
| Helioamplexine N-oxide e | 5 | 28 | 35 | 51 | |
| Echium plantagineum (Paterson’s curse) | |||||
| Echimidine | 93 | 36 | 20 | 260 | |
| Lycopsamine Intermedine | 76 f 37 g | ||||
| Heliotropium europaeum (Potato weed) | |||||
| Europine | 26 | 30 | 11 | 160 | |
| Europine N-oxide | 4 | 11 | 7 | 24 | |
| Heliotrine | 17 | 23 | 15 | 75 | |
| Heliotrine N-oxide | 1 | 9 | 9 | 9 | |
| Lasiocarpine | 10 | 20 | 14 | 59 | |
| Senecio species | |||||
| Senecivernine | 19 | 24 | 14 | 150 | |
| Senecionine | 7 | 13 | 8 | 41 | |
| Retrorsine | 18 | 20 | 12 | 91 | |
| No occurrence/Below LOR | |||||
| Echimidine N-oxide | 0 | ||||
| Erucifoline | 0 | ||||
| Erucifoline N-oxide | 0 | ||||
| Jacobine | 0 | ||||
| Jacobine N-oxide | 0 | ||||
| Lasiocarpine N-oxide | 0 | ||||
| Monocrotaline | 0 | ||||
| Monocrotaline N-oxide | 0 | ||||
| Retrorsine N-oxide | 0 | ||||
| Senecionine N-oxide | 0 | ||||
| Seneciphylline | 0 | ||||
| Seneciphylline N-oxide | 0 | ||||
| Senecivernine N-oxide | 0 | ||||
| Senkirkine | 0 | ||||
| Trichodesmine | 0 | ||||
© 2019 by the authors. Licensee MDPI, Basel, Switzerland. This article is an open access article distributed under the terms and conditions of the Creative Commons Attribution (CC BY) license (http://creativecommons.org/licenses/by/4.0/).
Share and Cite
Hungerford, N.L.; Carter, S.J.; Anuj, S.R.; Tan, B.L.L.; Hnatko, D.; Martin, C.L.; Sharma, E.; Yin, M.; Nguyen, T.T.P.; Melksham, K.J.; et al. Analysis of Pyrrolizidine Alkaloids in Queensland Honey: Using Low Temperature Chromatography to Resolve Stereoisomers and Identify Botanical Sources by UHPLC-MS/MS. Toxins 2019, 11, 726. https://doi.org/10.3390/toxins11120726
Hungerford NL, Carter SJ, Anuj SR, Tan BLL, Hnatko D, Martin CL, Sharma E, Yin M, Nguyen TTP, Melksham KJ, et al. Analysis of Pyrrolizidine Alkaloids in Queensland Honey: Using Low Temperature Chromatography to Resolve Stereoisomers and Identify Botanical Sources by UHPLC-MS/MS. Toxins. 2019; 11(12):726. https://doi.org/10.3390/toxins11120726
Chicago/Turabian StyleHungerford, Natasha L., Steve J. Carter, Shalona R. Anuj, Benjamin L. L. Tan, Darina Hnatko, Christopher L. Martin, Elipsha Sharma, Mukan Yin, Thao T. P. Nguyen, Kevin J. Melksham, and et al. 2019. "Analysis of Pyrrolizidine Alkaloids in Queensland Honey: Using Low Temperature Chromatography to Resolve Stereoisomers and Identify Botanical Sources by UHPLC-MS/MS" Toxins 11, no. 12: 726. https://doi.org/10.3390/toxins11120726