
Aflatoxin Biosynthesis Is a Novel Source of Reactive Oxygen Species—A Potential Redox Signal to Initiate Resistance to Oxidative Stress?

Abstract
:1. Introduction
2. Results
2.1. Enzymes in Aflatoxin Biosynthesis Are a Potential Source of Secondary ROS

| Gene ID in A. flavus genome database | Gene symbol (old gene symbol) | Gene/enzyme name | Reaction, reference |
|---|---|---|---|
| AFLA_139140 | aflYa (nadA) | NADH oxidase | formation of AFG1 from HOMST [27] |
| AFLA_139160 | aflX (ordB) | monooxygenase/oxidase | - |
| AFLA_139170 | aflW (moxY) | monooxygenase | - |
| AFLA_139180 | aflV (cypX) | cytochrome P450 monooxygenase | - |
| AFLA_139200 | aflQ (ordA) | cytochrome P450 monooxygenase, CYP64 | OMST to AFB1 |
| AFLA_139230 | aflI (avfA) | cytochrome P450 monooxygenase | oxidation of averufin to VHA |
| AFLA_139240 | aflLa (HypB) | oxidase | oxidation of ST to AF (?) [28] |
| AFLA_139250 | aflL (verB) | desaturase/P450 monooxygenase | - |
| AFLA_139260 | aflG (avnA) | cytochrome P450 monooxygenase | AVN to HAVN |
| AFLA_139280 | aflN (verA) | cytochrome P450 monooxygenase | VHA to ST |
| AFLA_139400 | aflCa (HypC) | oxidase | NORA anthrone to NORA [28] |
| AFLA_139430 | aflU (cypA) | cytochrome P450 monooxygenase | hydroxylate to NORA anthrone (?) |
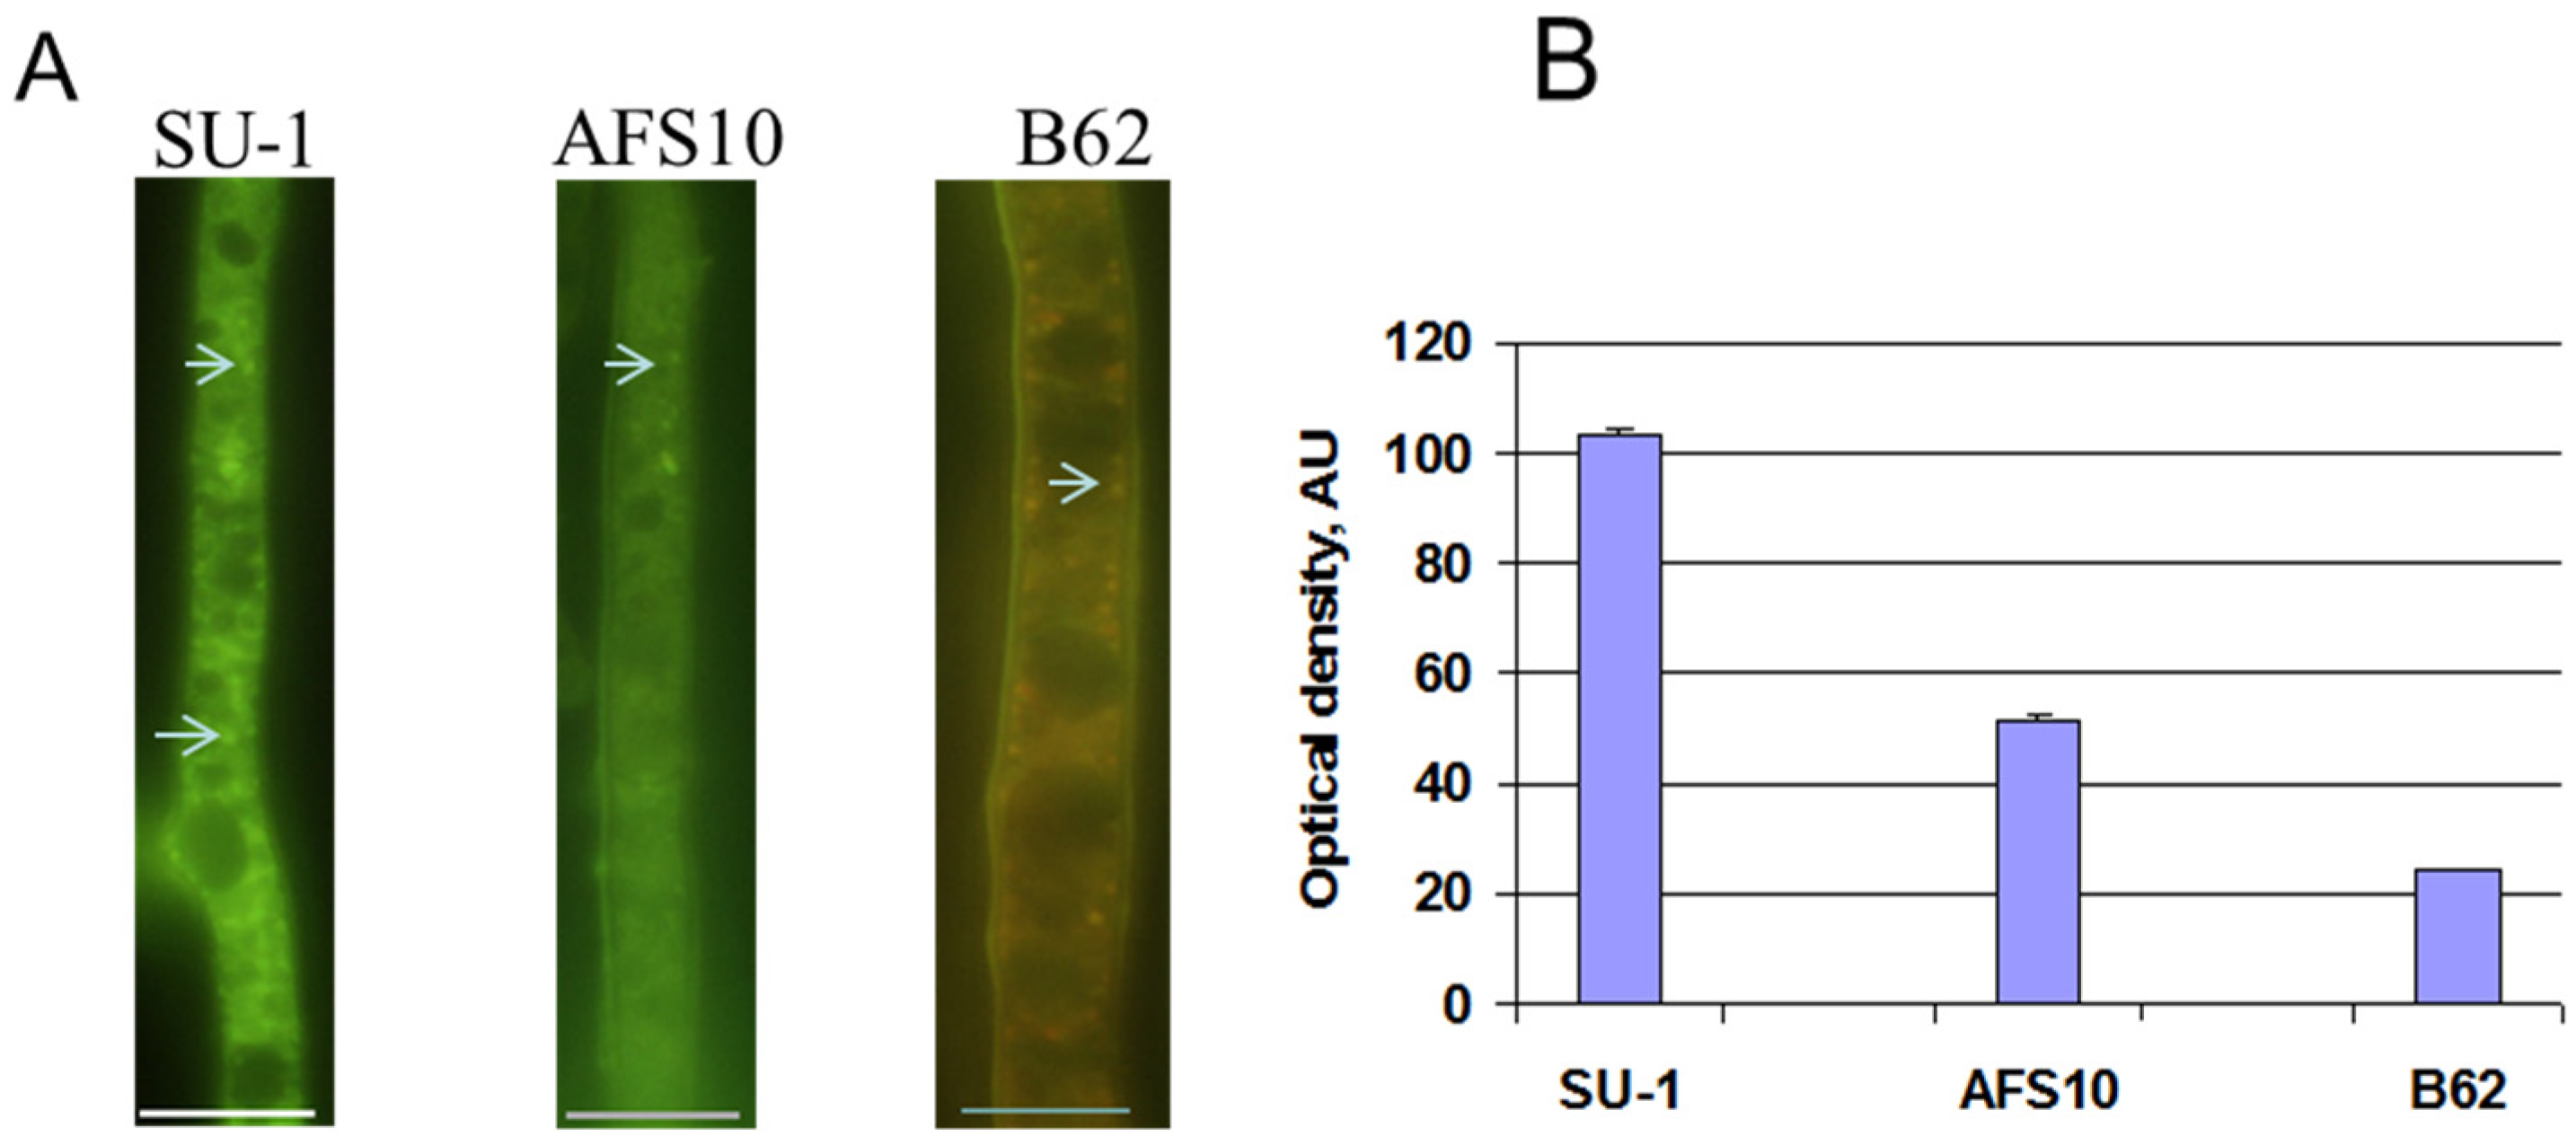
2.2. Blocking Aflatoxin Biosynthesis Limits ROS Accumulation in Whole Live Mycelia of A. parasticus


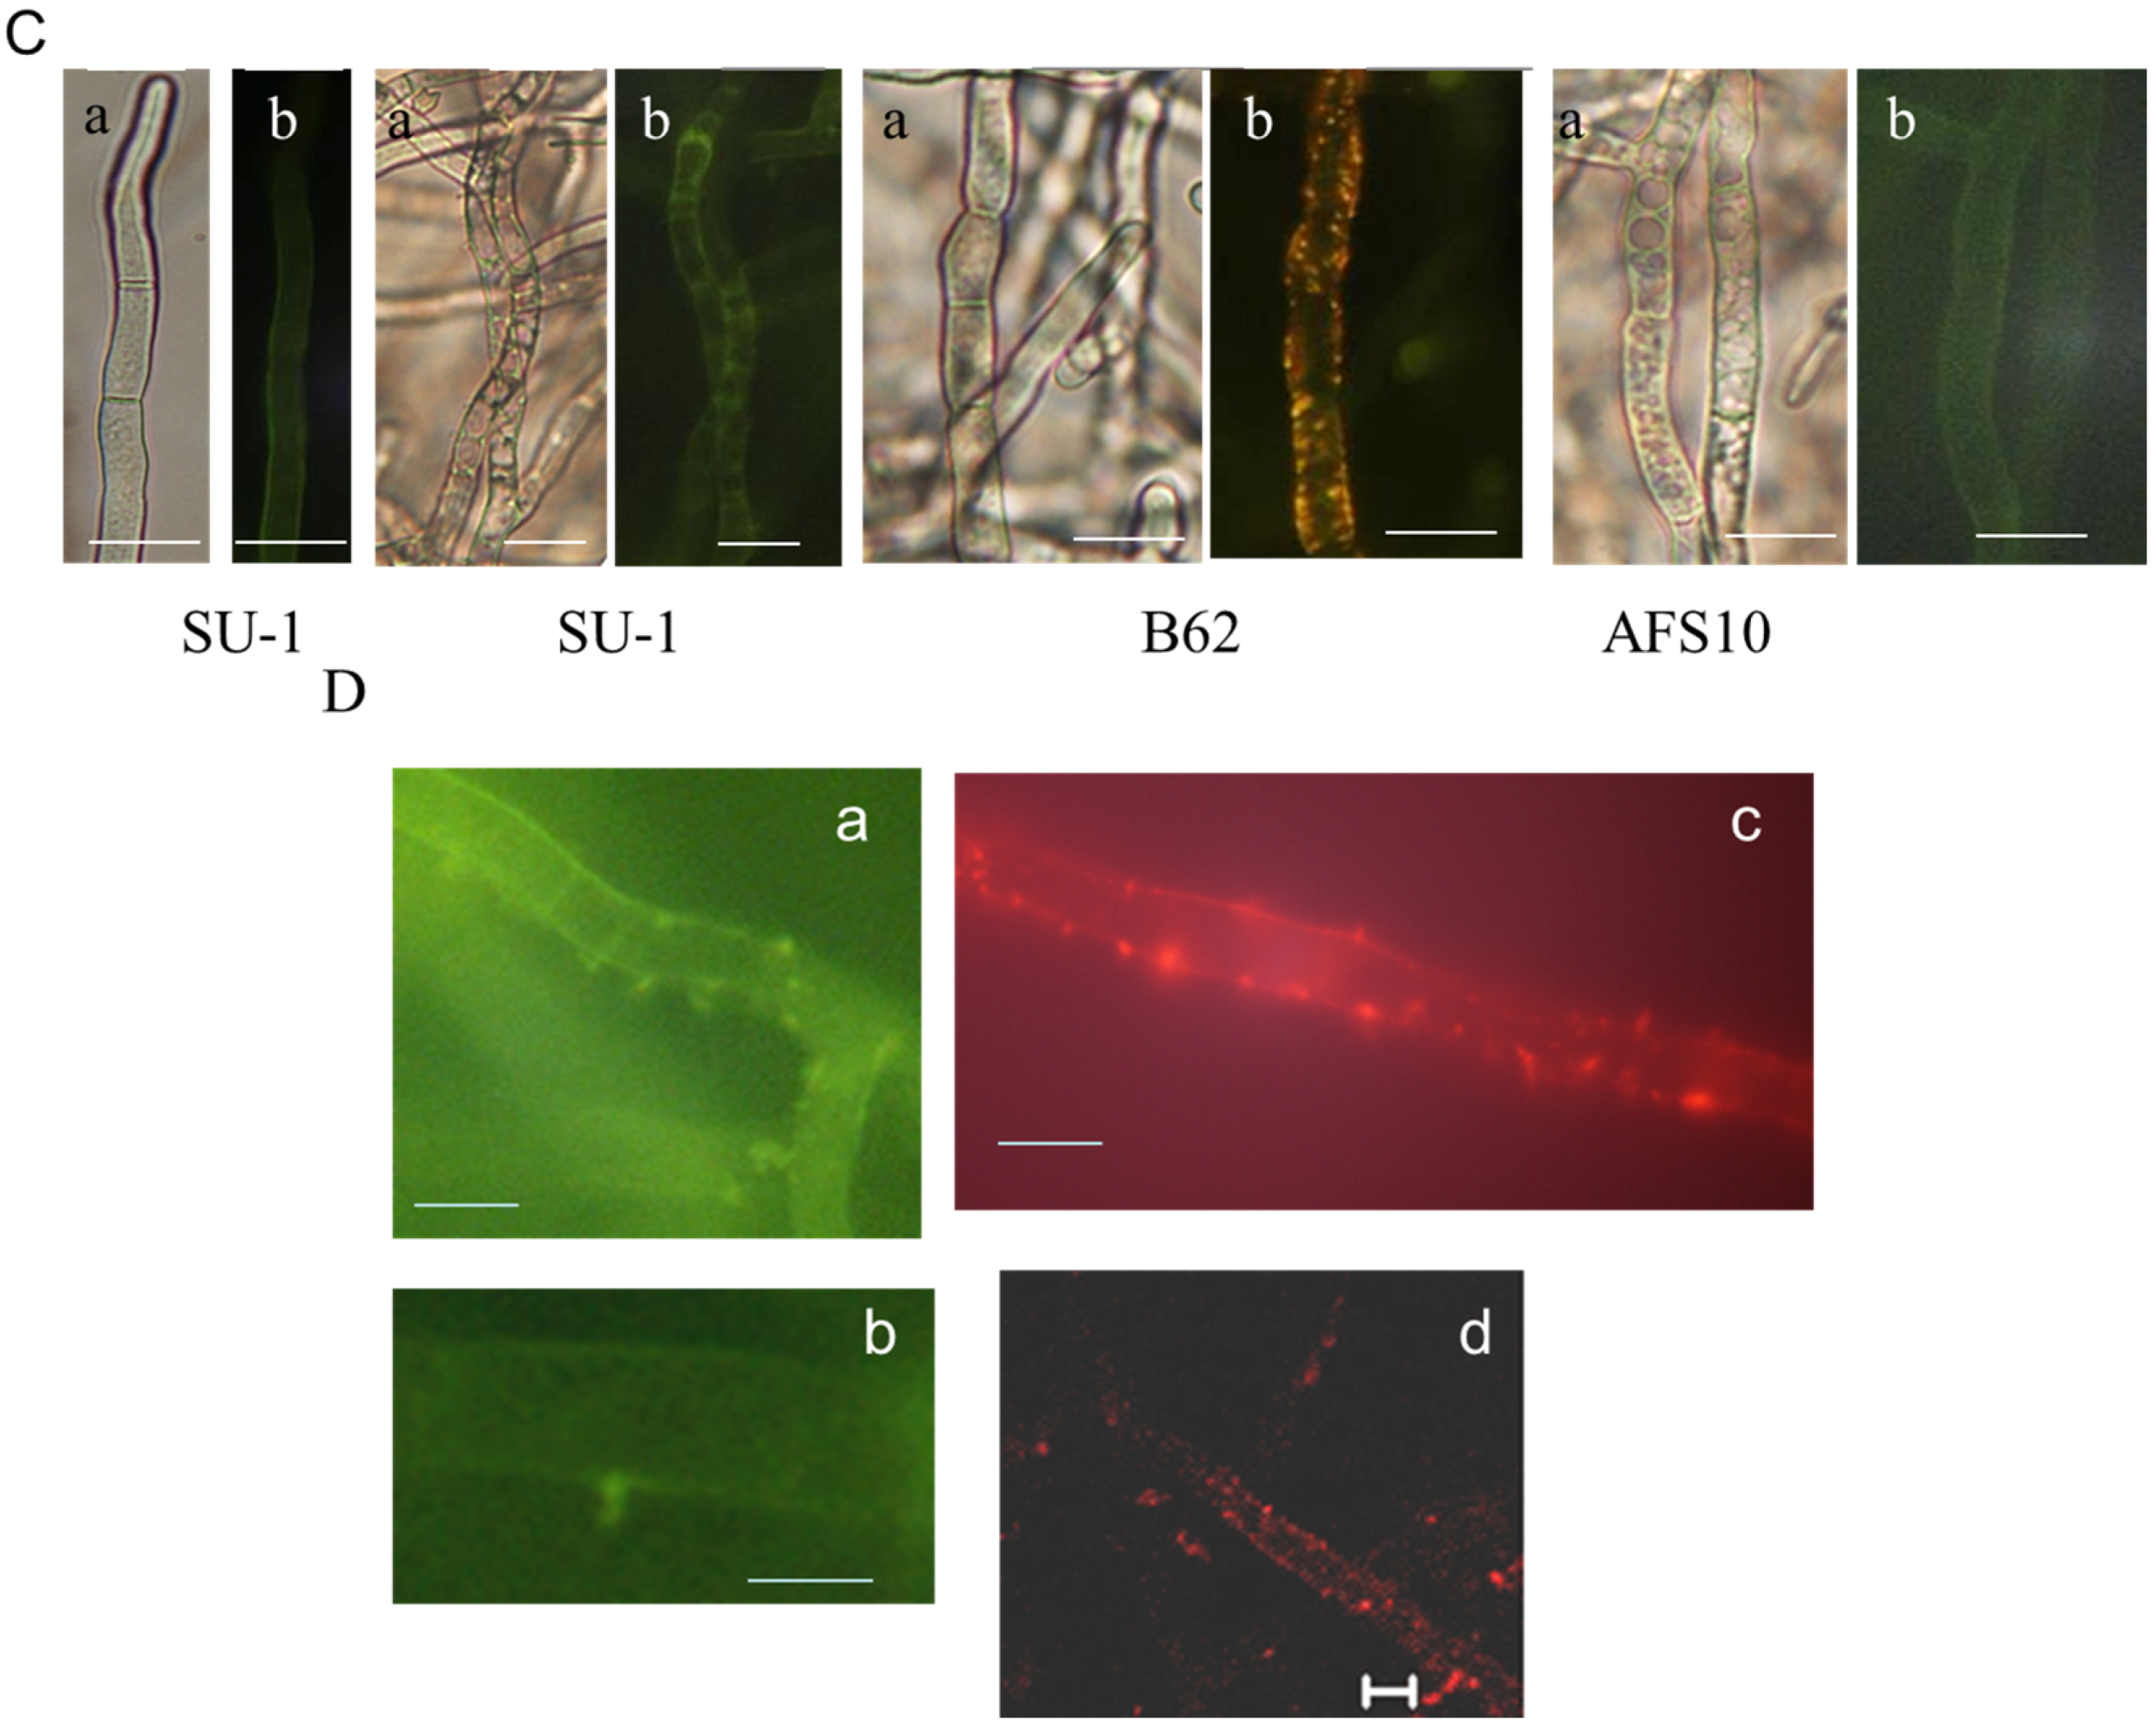
2.3. Disruption of AvaA (vb1, ypt7) Stimulates Aflatoxin Biosynthesis and ROS Accumulation in Whole Mycelia of A. parasiticus


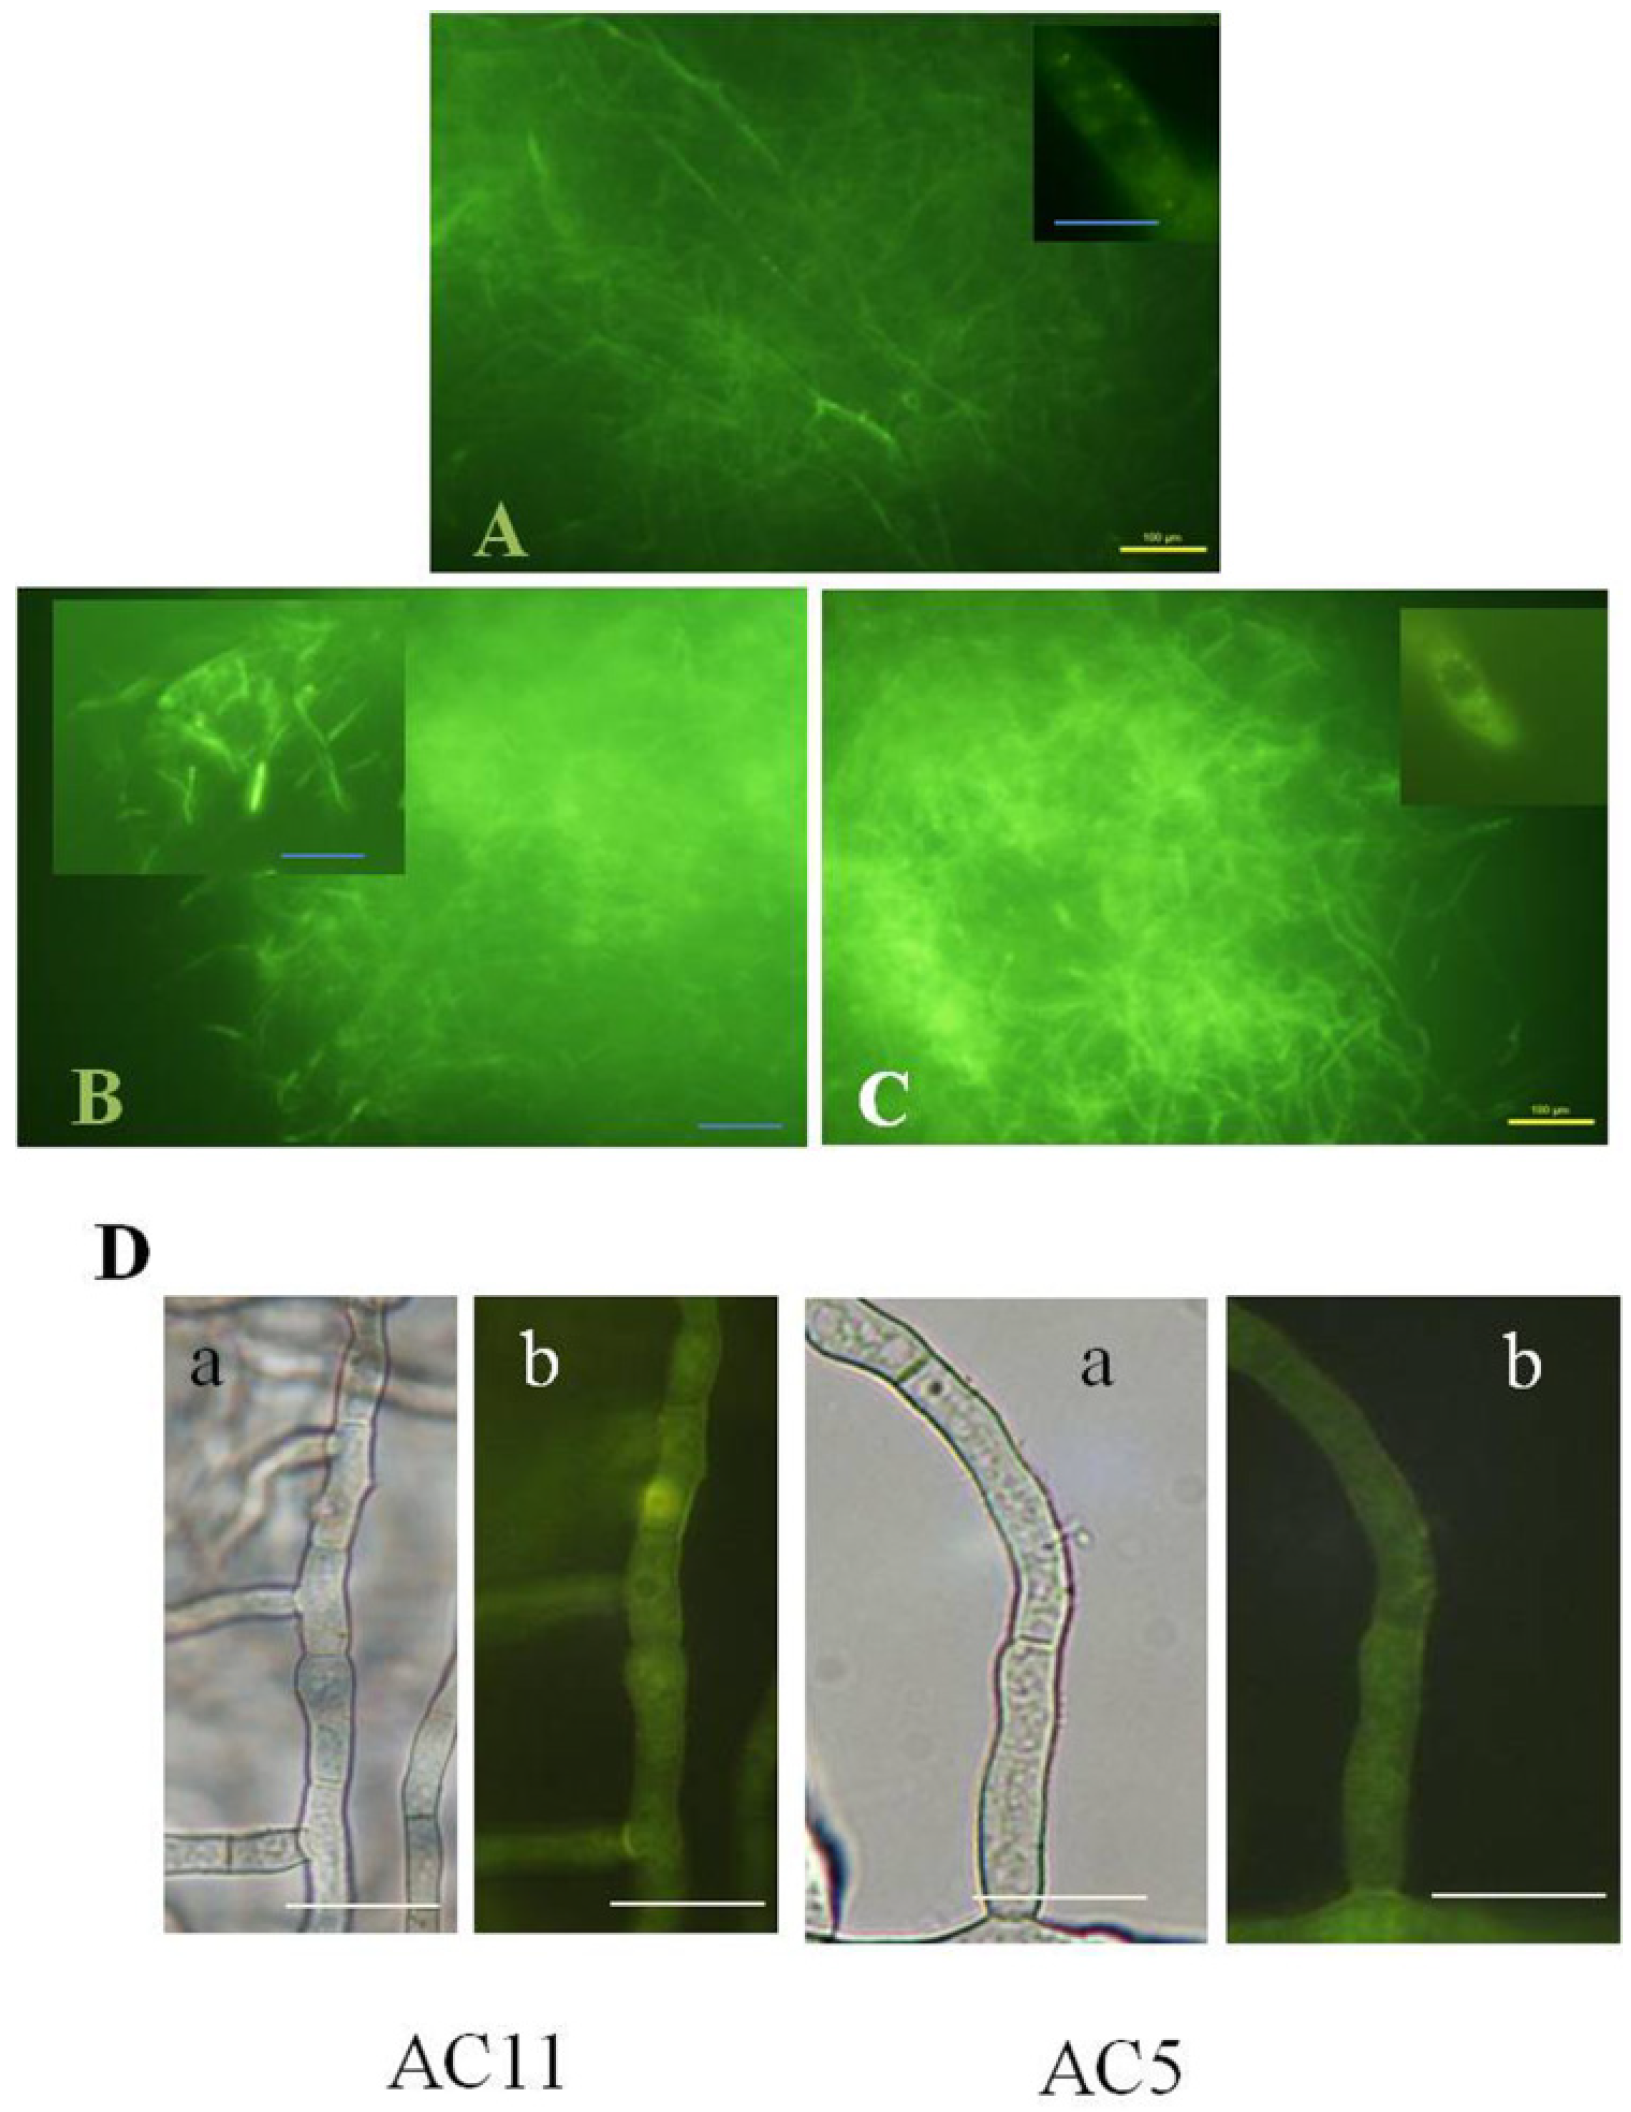
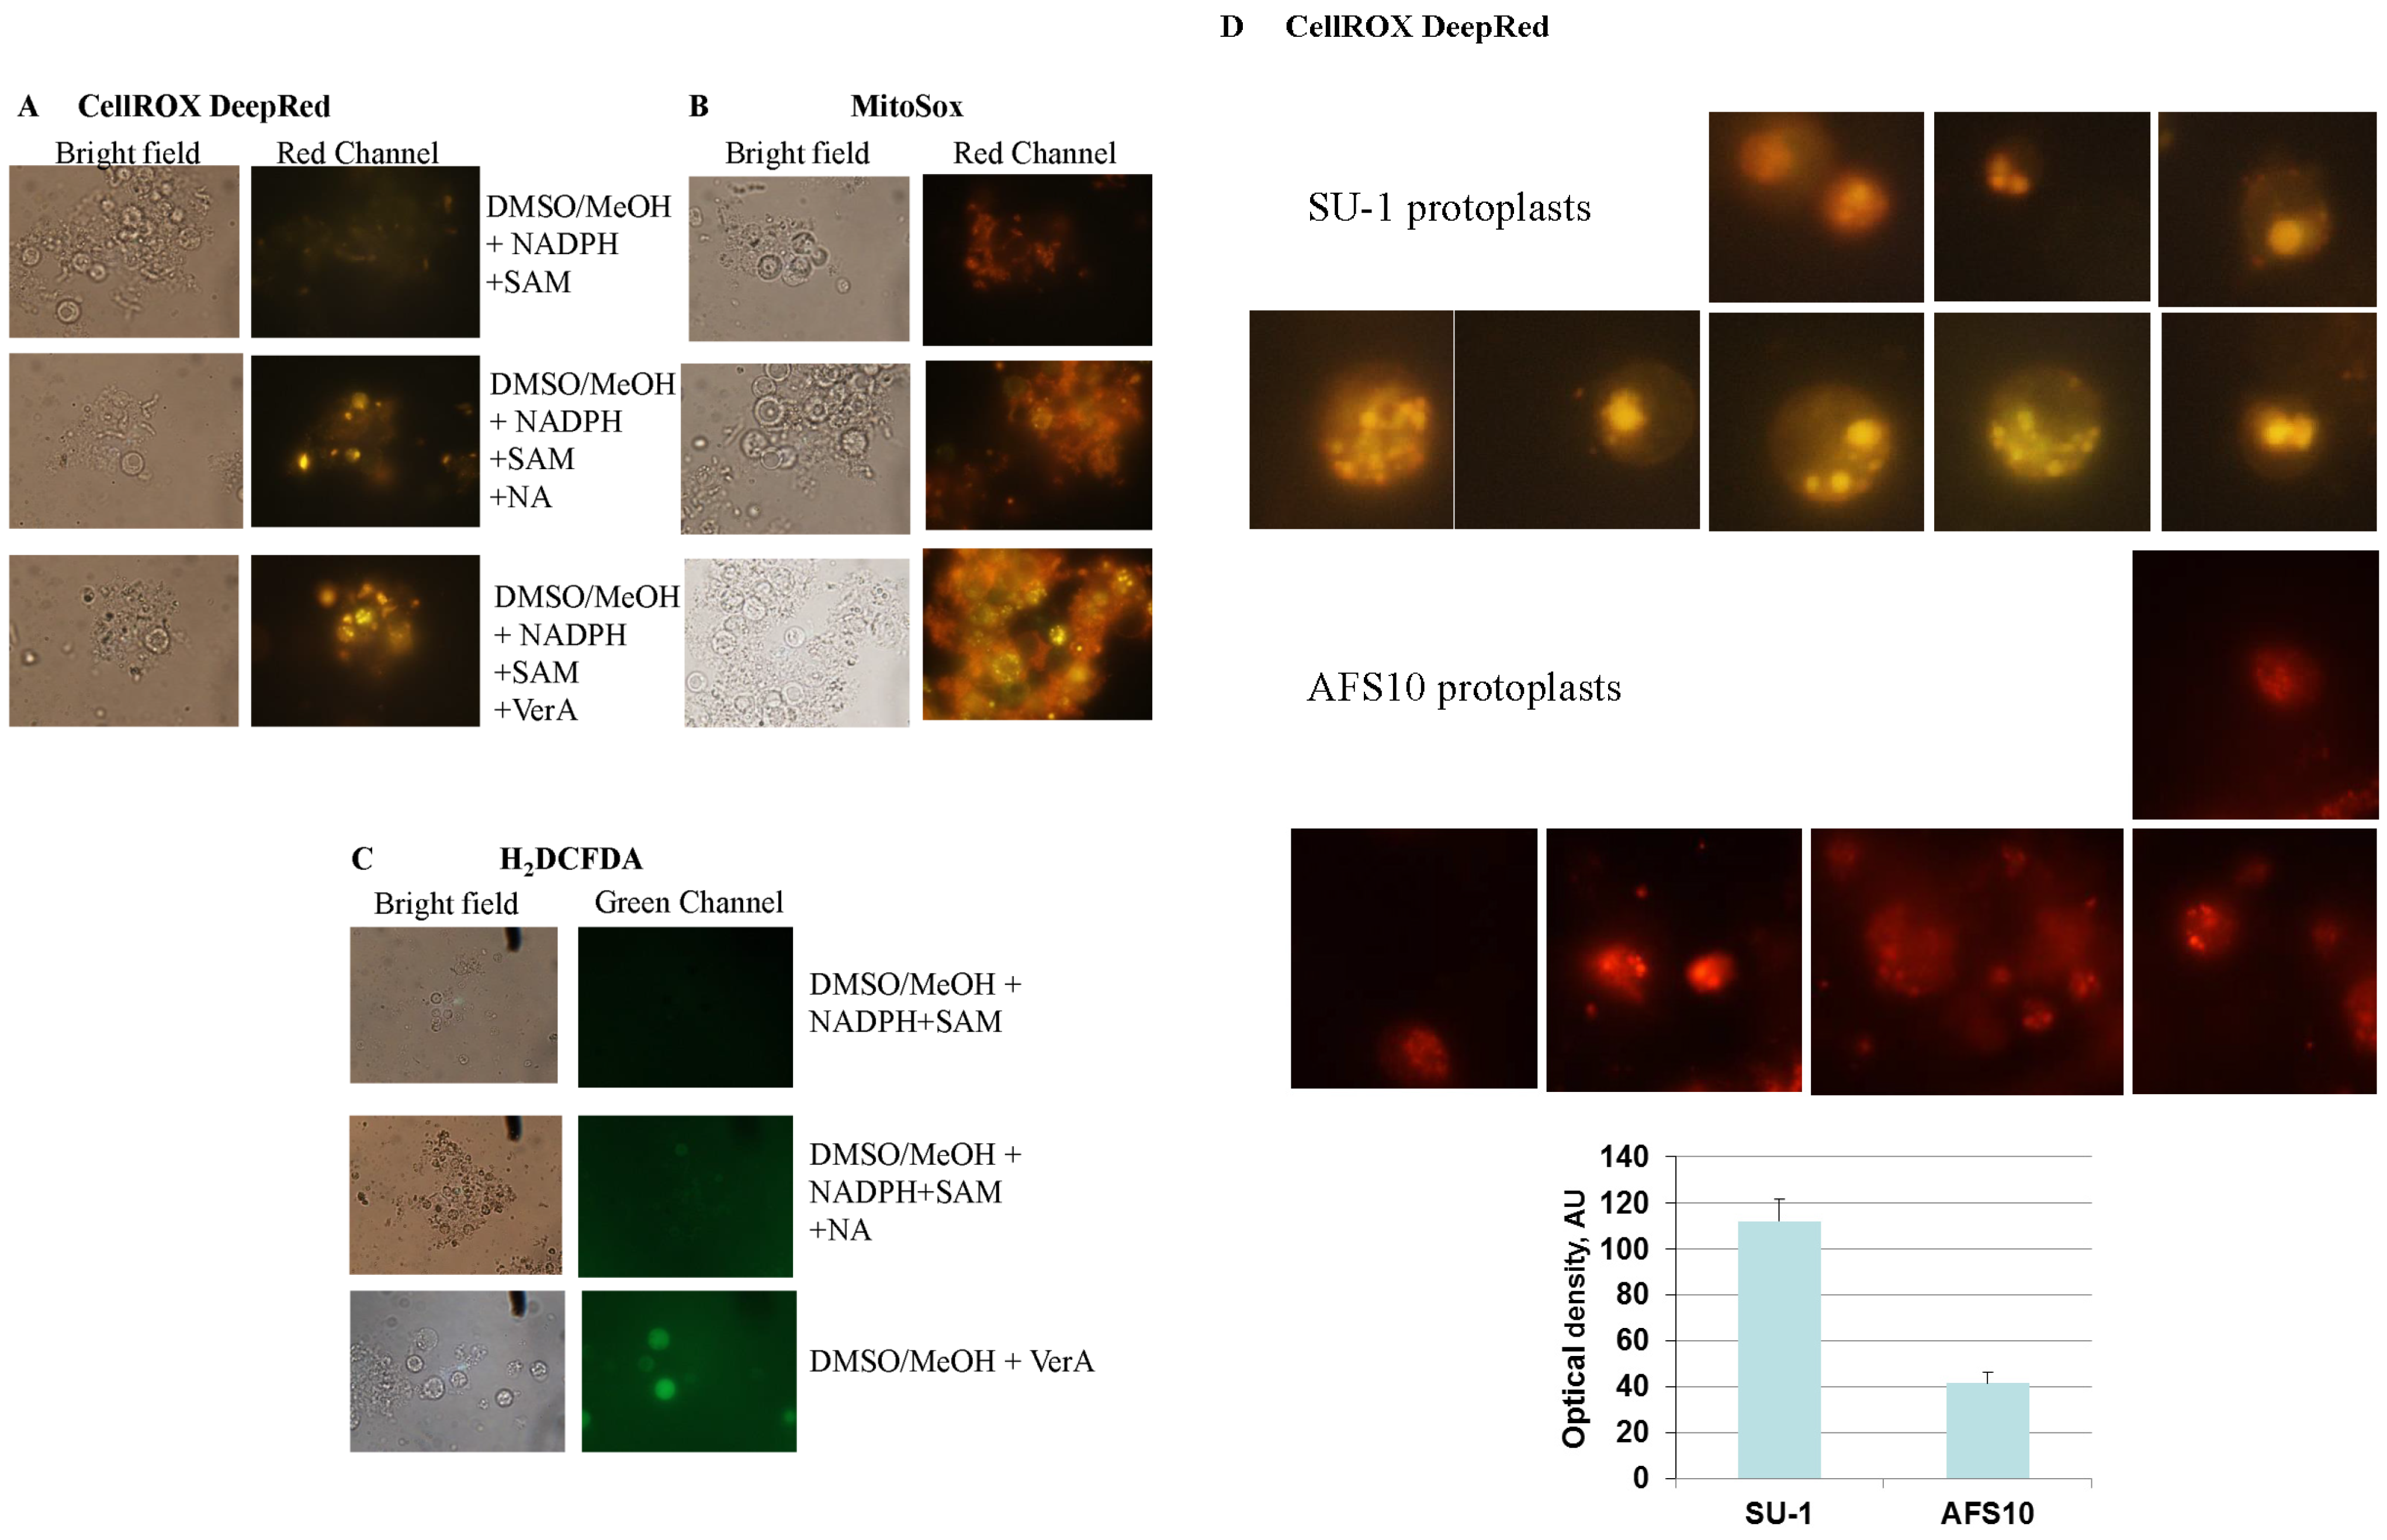
2.4. Feeding Aflatoxin Pathway Intermediates to Protoplasts Stimulates Intracellular “Secondary” ROS Accumulation
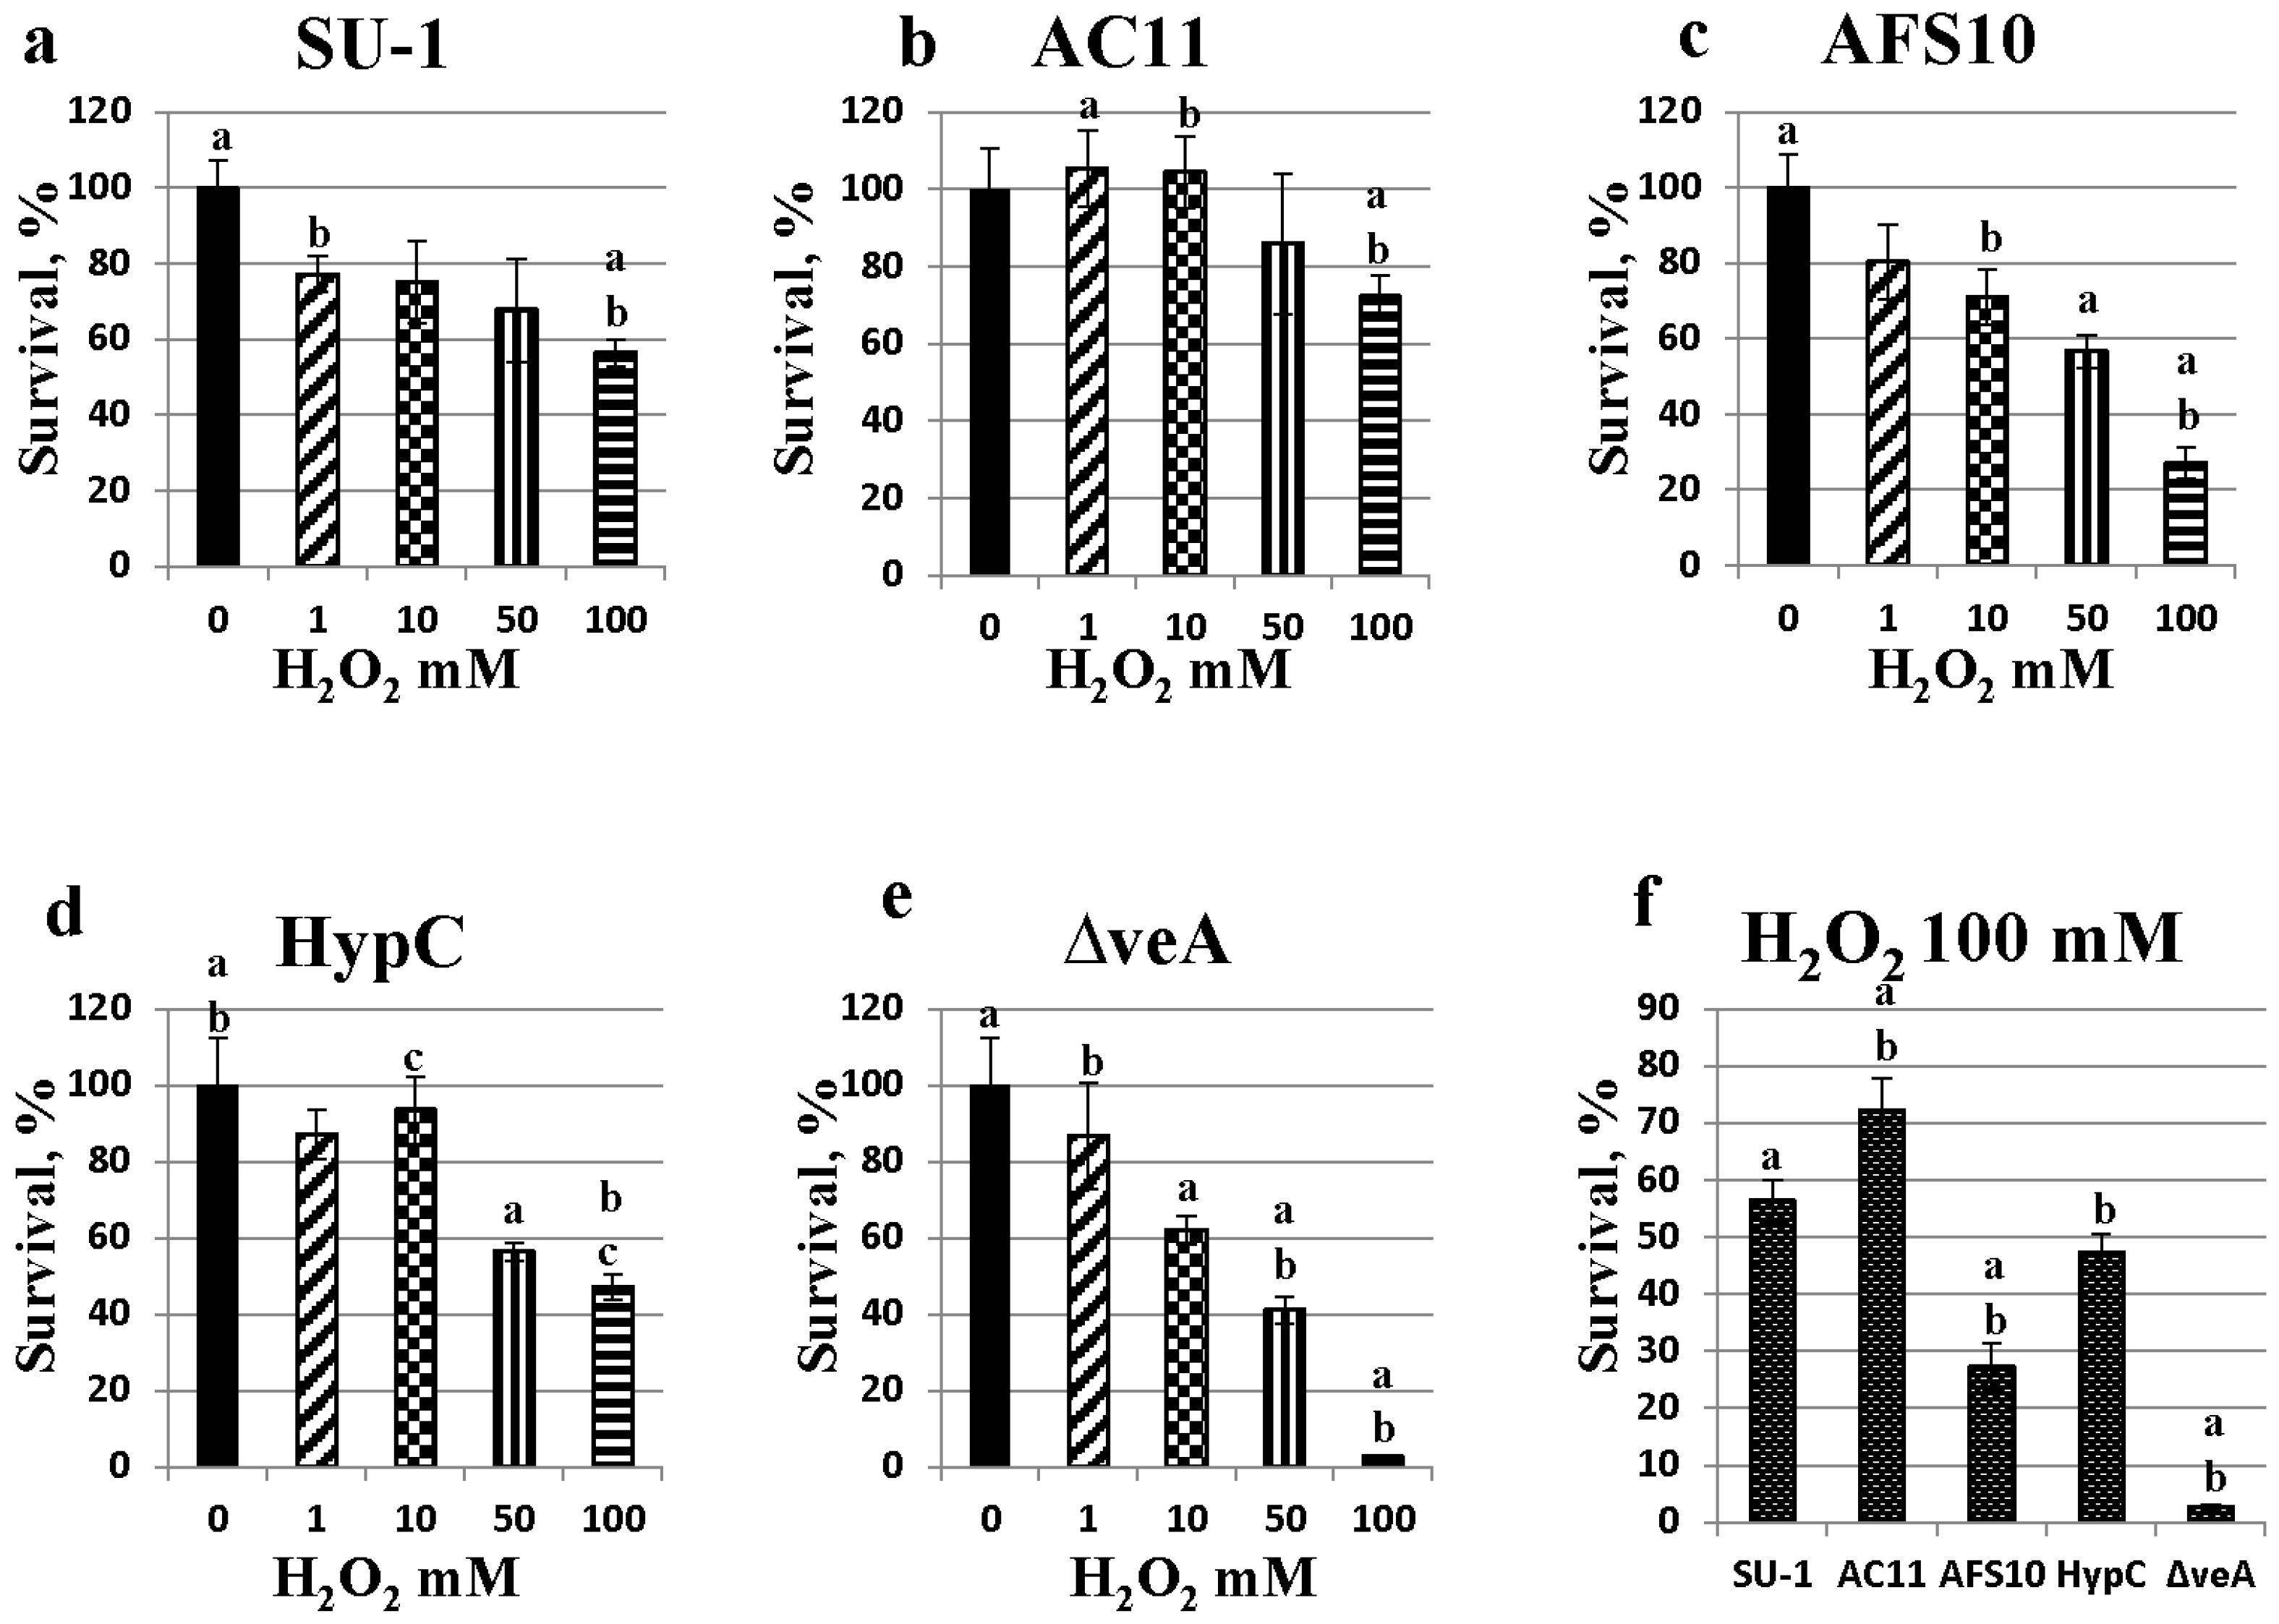
2.5. Fungal Sensitivity to Hydrogen Peroxide Treatment Is Inversely Proportional to Aflatoxin Production

| SU-1 | AFS10 | ΔveA |
|---|---|---|
| 3.0 ± 0.1 | * 1.6 ± 0.1 | ND |
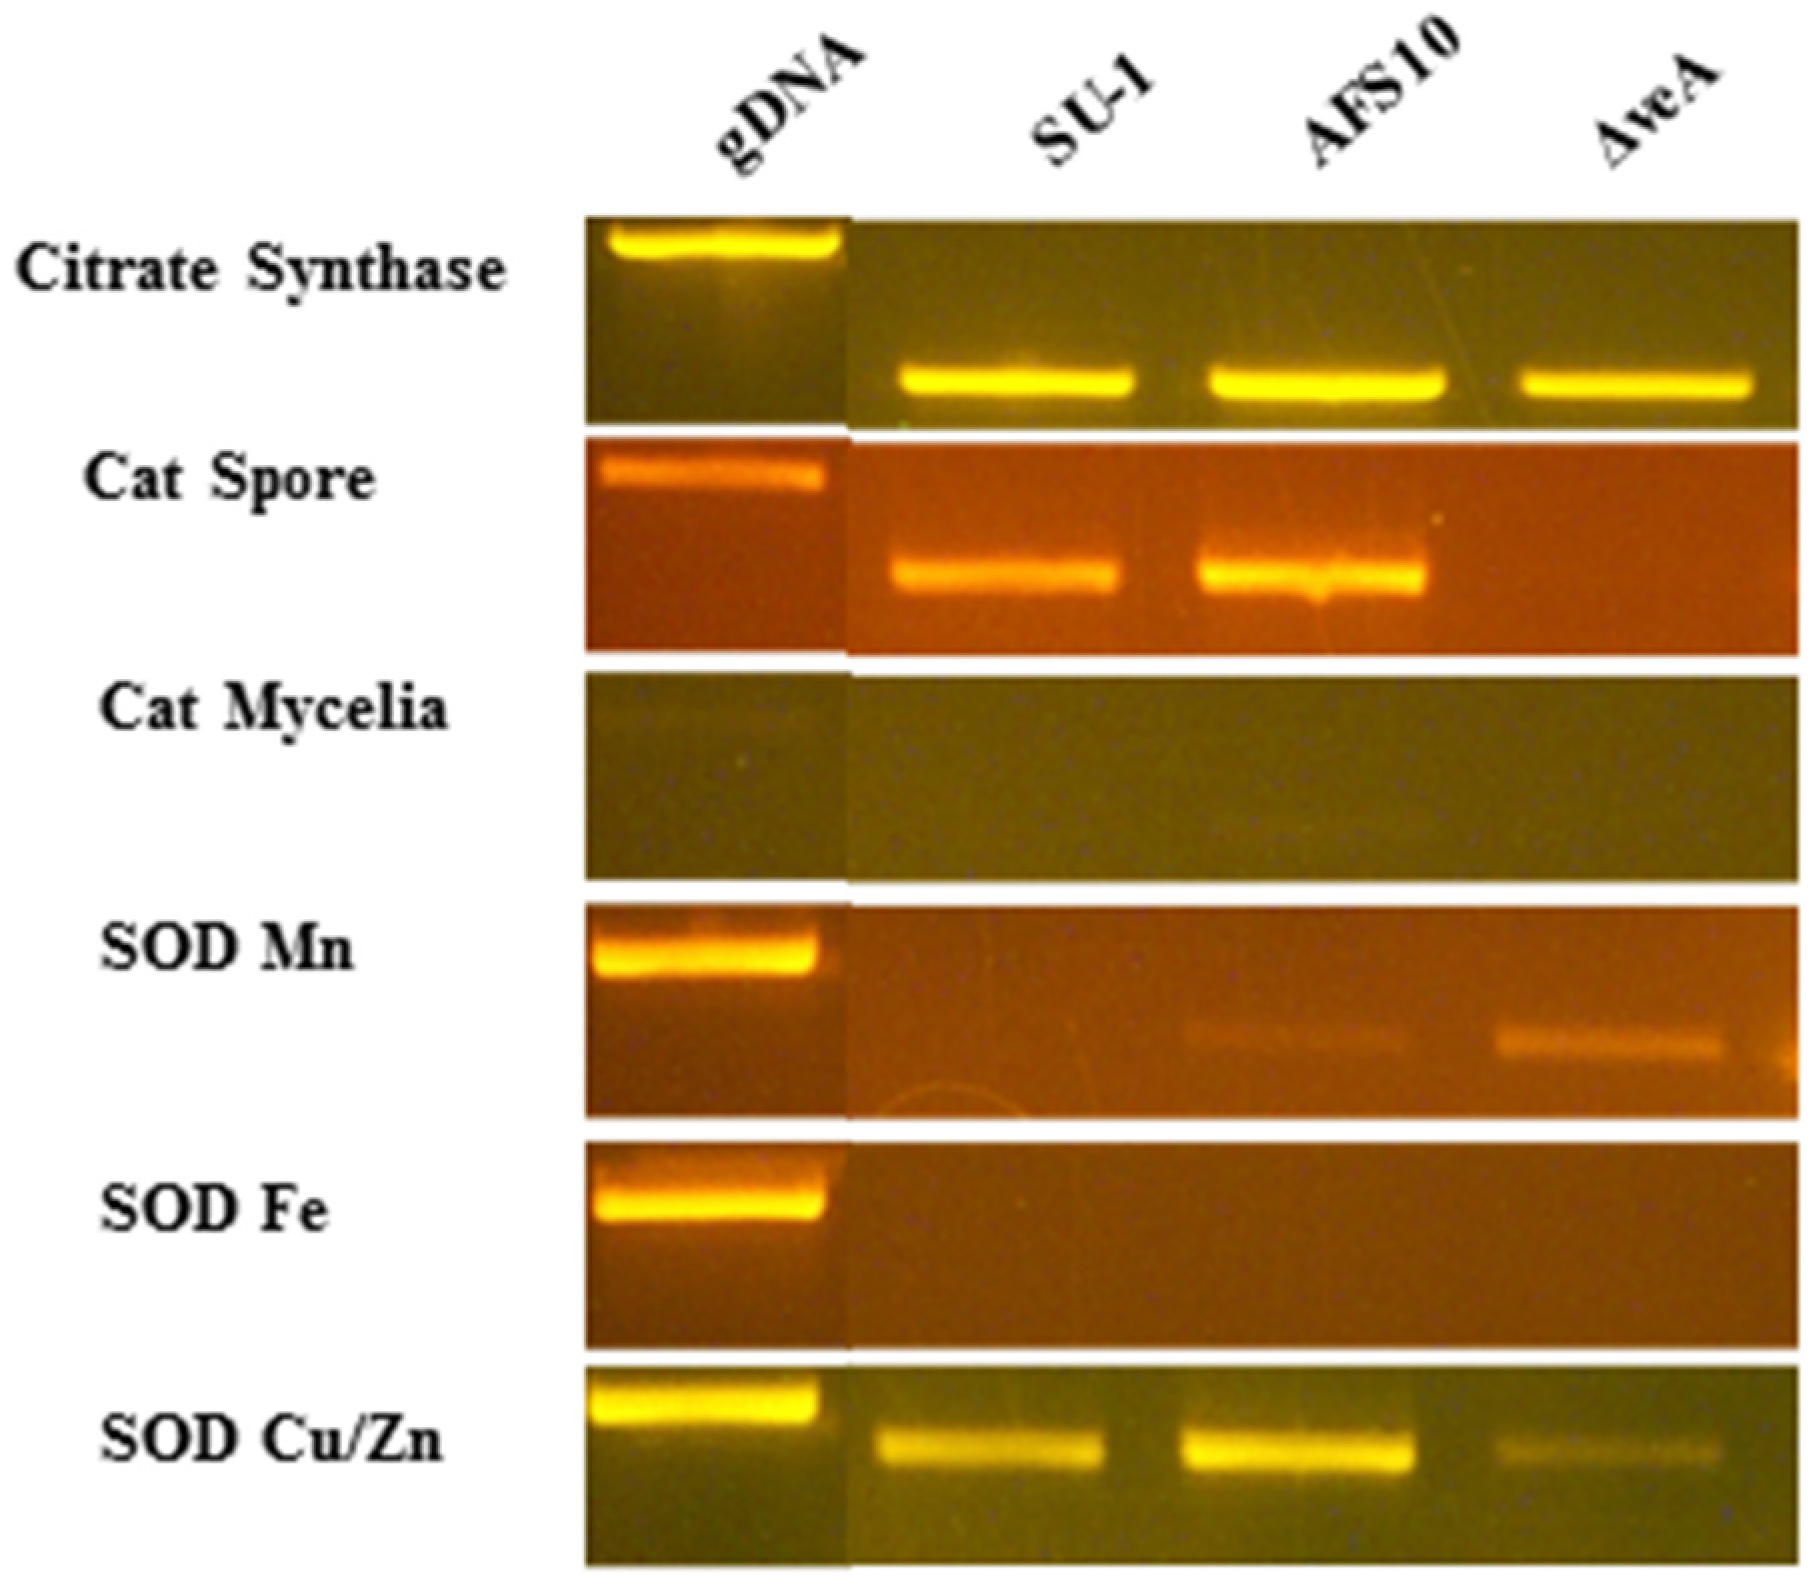
| Gene | Primer sequence a | PCR product b (bp) | Intron c |
|---|---|---|---|
| Citrate Synthase AFLA_007020 | F-5' TGCAGTCCGTTGCCTTCAATG 3' R-5' TAGCGTAGGCCTTGGCGAAAG 3' | 518 (827) | 5 |
| Cat Spore AFLA056170 | F-5' AATGTACAGTCCAGCAAGG 3' R-5' CGGGTGAAGATAGACAAAG 3' | 537 (648) | 2 |
| Cat Mycelia AFLA090690 | F-5' ATGACACATTCCTGACCTC 3' R-5' TCTCATTGTCACCATGAG 3' | 456 (583) | 2 |
| SOD Mn AFLA033420 | F-5' CATTCTCCCTCCCACCTCTC 3 R-5'TCCAGATGCCCTCCACATAC 3' | 549 (676) | 2 |
| SOD Fe AFLA027580 | F-5' TGGGAGAGTTCCAGAGCAAG 3' R-5' TGTCGATGCCTTTCGGAG 3' | 530 (796) | 3 |
| SOD Cu/Zn cytosol AFLA068080 | F-5' GAAGCTGTTCTCCAGGAC 3' R-5' GACACCAGGTGGAAGTTAC 3' | 434 (492) | 1 |

2.6. Transcript Accumulation in Seven-Hour Germlings
3. Discussion

4. Materials and Methods
4.1. Strains, Media, Growth Conditions
4.2. Detection of ROS in Live Cells
4.3. Measuring Catalase and SOD Activities
4.4. Analysis of Aflatoxin Accumulation
4.5. Analysis of Transcript Accumulation
4.6. Feeding Protoplasts with Aflatoxin Biosynthesis Intermediates
4.7. Assessment of Fungal Resistance to Hydrogen Peroxide Treatment
4.8. Microscopy
4.9. Statistical Analysis
5. Conclusions and Perspectives for Future Studies
Acknowledgments
Author Contributions
Conflicts of Interest
References
- Malagnac, F.; Lalucque, H.; Lepere, G.; Silar, P. Two NADPH oxidase isoforms are required for sexual reproduction and ascospore germination in the filamentous fungus Podospora anserina. Fungal Genet. Biol. 2004, 41, 982–997. [Google Scholar] [CrossRef] [PubMed]
- Aguirre, J.; Lambeth, J.D. Nox enzymes from fungus to fly to fish and what they tell us about Nox function in mammals. Free Radic. Biol. Med. 2010, 49, 1342–1353. [Google Scholar] [CrossRef] [PubMed]
- Lara-Ortiz, T.; Riveros-Rosas, H.; Aguirre, J. Reactive oxygen species generated by microbial NADPH oxidase NoxA regulate sexual development in Aspergillus nidulans. Mol. Microbiol. 2003, 50, 1241–1255. [Google Scholar] [CrossRef] [PubMed]
- Cano-Dominguez, N.; Alvarez-Delfin, K.; Hansberg, W.; Aguirre, J. NADPH oxidases NOX-1 and NOX-2 require the regulatory subunit NOR-1 to control cell differentiation and growth in Neurospora crassa. Eukaryot. Cell 2008, 7, 1352–1361. [Google Scholar] [CrossRef] [PubMed]
- Osiewacz, H.D.; Scheckhuber, C.Q. Impact of ROS on ageing of two fungal model systems: Saccharomyces cerevisiae and Podospora anserina. Free Radic. Res. 2006, 40, 1350–1358. [Google Scholar] [CrossRef] [PubMed]
- Giesbert, S.; Schurg, T.; Scheele, S.; Tudzynski, P. The NADPH oxidase Cpnox1 is required for full pathogenicity of the ergot fungus Claviceps purpurea. Mol. Plant Pathol. 2008, 9, 317–327. [Google Scholar] [CrossRef] [PubMed]
- Egan, M.J.; Wang, Z.Y.; Jones, M.A.; Smirnoff, N.; Talbot, N.J. Generation of reactive oxygen species by fungal NADPH oxidases is required for rice blast disease. Proc. Natl. Acad. Sci. USA 2007, 104, 11772–11777. [Google Scholar] [CrossRef] [PubMed]
- Kim, H.J.; Chen, C.; Kabbage, M.; Dickman, M.B. Identification and characterization of Sclerotinia sclerotiorum NADPH oxidases. Appl. Environ. Microbiol. 2011, 77, 7721–7729. [Google Scholar] [CrossRef] [PubMed]
- Kayano, Y.; Tanaka, A.; Akano, F.; Scott, B.; Takemoto, D. Differential roles of NADPH oxidases and associated regulators in polarized growth, conidiation and hyphal fusion in the symbiotic fungus Epichloe festucae. Fungal Genet. Biol. 2013, 56, 87–97. [Google Scholar] [CrossRef] [PubMed]
- Grintzalis, K.; Vernardis, S.I.; Klapa, M.I.; Georgiou, C.D. Role of oxidative stress in Sclerotial differentiation and aflatoxin B1 biosynthesis in Aspergillus flavus. Appl. Environ. Microbiol. 2014, 80, 5561–5571. [Google Scholar] [CrossRef] [PubMed]
- Aguirre, J.; Rios-Momberg, M.; Hewitt, D.; Hansberg, W. Reactive oxygen species and development in microbial eukaryotes. Trends Microbiol. 2005, 13, 111–118. [Google Scholar] [CrossRef] [PubMed]
- Reverberi, M.; Zjalic, S.; Ricelli, A.; Fabbri, A.A.; Fanelli, C. Oxidant/antioxidant balance in Aspergillus parasiticus affects aflatoxin biosynthesis. Mycotoxin Res. 2006, 22, 39–47. [Google Scholar] [CrossRef] [PubMed]
- Chen, Q.; Vazquez, E.J.; Moghaddas, S.; Hoppel, C.L.; Lesnefsky, E.J. Production of reactive oxygen species by mitochondria: Central role of complex III. J. Biol. Chem. 2003, 278, 36027–36031. [Google Scholar] [CrossRef] [PubMed]
- Puntarulo, S.; Cederbaum, A.I. Production of reactive oxygen species by microsomes enriched in specific human cytochrome P450 enzymes. Free Radic. Biol. Med. 1998, 24, 1324–1330. [Google Scholar] [CrossRef] [PubMed]
- Skulachev, V.P. SkQ1 treatment and food restriction—Two ways to retard an aging program of organisms. Aging 2011, 3, 1045–1050. [Google Scholar] [PubMed]
- Jiang, F.; Zhang, Y.; Dusting, G.J. NADPH oxidase-mediated redox signaling: Roles in cellular stress response, stress tolerance, and tissue repair. Pharmacol. Rev. 2011, 63, 218–242. [Google Scholar] [CrossRef] [PubMed]
- Montezano, A.C.; Touyz, R.M. Reactive oxygen species and endothelial function—Role of nitric oxide synthase uncoupling and Nox family nicotinamide adenine dinucleotide phosphate oxidases. Basic Clin. Pharmacol. Toxicol. 2012, 110, 87–94. [Google Scholar] [CrossRef] [PubMed]
- Cantu-Medellin, N.; Kelley, E.E. Xanthine oxidoreductase-catalyzed reactive species generation: A process in critical need of reevaluation. Redox Biol. 2013, 1, 353–358. [Google Scholar] [CrossRef] [PubMed]
- Lewis, D.F.; Sheridan, G. Cytochromes P450, oxygen, and evolution. Sci. World J. 2001, 1, 151–167. [Google Scholar] [CrossRef]
- Gessler, N.N.; Aver’yanov, A.A.; Belozerskaya, T.A. Reactive oxygen species in regulation of fungal development. Biochemistry 2007, 72, 1091–1109. [Google Scholar] [PubMed]
- Bondy, S.C.; Naderi, S. Contribution of hepatic cytochrome P450 systems to the generation of reactive oxygen species. Biochem. Pharmacol. 1994, 48, 155–159. [Google Scholar] [CrossRef] [PubMed]
- Shimamoto, N. A pathophysiological role of cytochrome p450 involved in production of reactive oxygen species. Yakugaku Zasshi 2013, 133, 435–450. [Google Scholar] [CrossRef] [PubMed]
- Sun, X.; Ai, M.; Wang, Y.; Shen, S.; Gu, Y.; Jin, Y.; Zhou, Z.; Long, Y.; Yu, Q. Selective induction of tumor cell apoptosis by a novel P450-mediated reactive oxygen species (ROS) inducer methyl 3-(4-nitrophenyl) propiolate. J. Biol. Chem. 2013, 288, 8826–8837. [Google Scholar] [CrossRef] [PubMed]
- Chanda, A.; Roze, L.V.; Kang, S.; Artymovich, K.A.; Hicks, G.R.; Raikhel, N.V.; Calvo, A.M.; Linz, J.E. A key role for vesicles in fungal secondary metabolism. Proc. Natl. Acad. Sci. USA 2009, 106, 19533–19538. [Google Scholar] [CrossRef] [PubMed]
- Trail, F.; Mahanti, N.; Rarick, M.; Mehigh, R.; Liang, S.H.; Zhou, R.; Linz, J.E. Physical and transcriptional map of an aflatoxin gene cluster in Aspergillus parasiticus and functional disruption of a gene involved early in the aflatoxin pathway. Appl. Environ. Microbiol. 1995, 61, 2665–2673. [Google Scholar] [PubMed]
- Narasaiah, K.V.; Sashidhar, R.B.; Subramanyam, C. Biochemical analysis of oxidative stress in the production of aflatoxin and its precursor intermediates. Mycopathologia 2006, 162, 179–189. [Google Scholar] [CrossRef] [PubMed]
- Zeng, H.; Hatabayashi, H.; Nakagawa, H.; Cai, J.; Suzuki, R.; Sakuno, E.; Tanaka, T.; Ito, Y.; Ehrlich, K.C.; Nakajima, H.; et al. Conversion of 11-hydroxy-O-methylsterigmatocystin to aflatoxin G1 in Aspergillus parasiticus. Appl. Microbiol. Biotechnol. 2011, 90, 635–650. [Google Scholar] [CrossRef] [PubMed]
- Ehrlich, K.C.; Li, P.; Scharfenstein, L.; Chang, P.K. HypC, the anthrone oxidase involved in aflatoxin biosynthesis. Appl. Environ. Microbiol. 2010, 76, 3374–3377. [Google Scholar] [CrossRef] [PubMed]
- Cai, J.J.; Zeng, H.M.; Shima, Y.; Hatabayashi, H.; Nakagawa, H.; Ito, Y.; Adachi, Y.; Nakajima, H.; Yabe, K. Involvement of the nadA gene in formation of G-group aflatoxins in Aspergillus parasiticus. Fungal Genet. Biol. 2008, 45, 1081–1093. [Google Scholar] [CrossRef] [PubMed]
- Roze, L.V.; Arthur, A.E.; Hong, S.Y.; Chanda, A.; Linz, J.E. The initiation and pattern of spread of histone H4 acetylation parallel the order of transcriptional activation of genes in the aflatoxin cluster. Mol. Microbiol. 2007, 66, 713–726. [Google Scholar] [CrossRef] [PubMed]
- Yu, J.; Chang, P.; Bhatnagar, D.; Cleveland, T.E. Cloning of a sugar utilization gene cluster in Aspergillus parasiticus. Biochim. Biophys. Acta 2000, 1493, 211–214. [Google Scholar] [CrossRef] [PubMed]
- Price, M.S.; Yu, J.; Nierman, W.C.; Kim, H.S.; Pritchard, B.; Jacobus, C.A.; Bhatnagar, D.; Cleveland, T.E.; Payne, G.A. The aflatoxin pathway regulator AflR induces gene transcription inside and outside of the aflatoxin biosynthetic cluster. FEMS Microbiol. Lett. 2006, 255, 275–279. [Google Scholar] [CrossRef] [PubMed]
- Miyoshi, A.; Rochat, T.; Gratadoux, J.J.; Le Loir, Y.; Oliveira, S.C.; Langella, P.; Azevedo, V. Oxidative stress in Lactococcus lactis. Genet. Mol. Res. 2003, 2, 348–359. [Google Scholar] [PubMed]
- Chanda, A.; Roze, L.V.; Linz, J.E. A possible role for exocytosis in aflatoxin export in Aspergillus parasiticus. Eukaryot. Cell 2010, 9, 1724–1727. [Google Scholar] [CrossRef] [PubMed]
- Chanda, A.; Roze, L.V.; Pastor, A.; Frame, M.K.; Linz, J.E. Purification of a vesicle-vacuole fraction functionally linked to aflatoxin synthesis in Aspergillus parasiticus. J. Microbiol. Methods 2009, 78, 28–33. [Google Scholar] [CrossRef] [PubMed]
- Towner, R.A.; Qian, S.Y.; Kadiiska, M.B.; Mason, R.P. In vivo identification of aflatoxin-induced free radicals in rat bile. Free Radic. Biol. Med. 2003, 35, 1330–1340. [Google Scholar] [CrossRef] [PubMed]
- Aslan, A.; Agar, G.; Alpsoy, L.; Kotan, E.; Ceker, S. Protective role of methanol extracts of two lichens on oxidative and genotoxic damage caused by AFB1 in human lymphocytes in vitro. Toxicol. Ind. Health 2012, 28, 505–512. [Google Scholar] [CrossRef] [PubMed]
- Rohlfs, M.; Albert, M.; Keller, N.P.; Kempken, F. Secondary chemicals protect mould from fungivory. Biol. Lett. 2007, 3, 523–525. [Google Scholar] [CrossRef] [PubMed]
- Doll, K.; Chatterjee, S.; Scheu, S.; Karlovsky, P.; Rohlfs, M. Fungal metabolic plasticity and sexual development mediate induced resistance to arthropod fungivory. Proc. Biol. Sci. 2013, 280, 1–8. [Google Scholar] [CrossRef]
- Edreva, A.; Velikova, V.; Tsonev, T.; Dagnon, S.; Gurel, A.; Aktas, L.; Gesheva, E. Stress-protective role of secondary metabolites: Diversity of functions and mechanisms. Gen. Appl. Plant Physiol. 2008, 34, 67–78. [Google Scholar]
- Menke, J.; Weber, J.; Broz, K.; Kistler, H.C. Cellular development associated with induced mycotoxin synthesis in the filamentous fungus Fusarium graminearum. PLoS One 2013, 8, e63077. [Google Scholar] [CrossRef] [PubMed]
- Linz, J.E.; Chanda, A.; Hong, S.Y.; Whitten, D.A.; Wilkerson, C.; Roze, L.V. Proteomic and biochemical evidence support a role for transport vesicles and endosomes in stress response and secondary metabolism in Aspergillus parasiticus. J. Proteome Res. 2012, 11, 767–775. [Google Scholar] [CrossRef] [PubMed]
- Mahanti, N.; Bhatnagar, D.; Cary, J.W.; Joubran, J.; Linz, J.E. Structure and function of fas-1A, a gene encoding a putative fatty acid synthetase directly involved in aflatoxin biosynthesis in Aspergillus parasiticus. Appl. Environ. Microbiol. 1996, 62, 191–195. [Google Scholar] [PubMed]
- Keller, N.P.; Turner, G.; Bennett, J.W. Fungal secondary metabolism—From biochemistry to genomics. Nat. Rev. Microbiol. 2005, 3, 937–947. [Google Scholar] [CrossRef] [PubMed]
- Forseth, R.R.; Amaike, S.; Schwenk, D.; Affeldt, K.J.; Hoffmeister, D.; Schroeder, F.C.; Keller, N.P. Homologous NRPS-like gene clusters mediate redundant small-molecule biosynthesis in Aspergillus flavus. Angew. Chem. Int. Ed. Engl. 2013, 52, 1590–1594. [Google Scholar] [CrossRef] [PubMed]
- Rodriguez-Urra, A.B.; Jimenez, C.; Nieto, M.I.; Rodriguez, J.; Hayashi, H.; Ugalde, U. Signaling the induction of sporulation involves the interaction of two secondary metabolites in Aspergillus nidulans. ACS Chem. Biol. 2012, 7, 599–606. [Google Scholar] [CrossRef] [PubMed]
- Roze, L.V.; Hong, S.Y.; Linz, J.E. Aflatoxin biosynthesis: Current frontiers. Annu. Rev. Food Sci. Technol. 2013, 4, 293–311. [Google Scholar] [CrossRef] [PubMed]
- Chen, Z.H.; Yoshida, Y.; Saito, Y.; Niki, E. Adaptation to hydrogen peroxide enhances PC12 cell tolerance against oxidative damage. Neurosci. Lett. 2005, 383, 256–259. [Google Scholar] [CrossRef] [PubMed]
- Amin, V.M.; Olson, N.F. Selective increase in hydrogen peroxide resistance of a coagulase-positive Staphylococcus. J. Bacteriol. 1968, 95, 1604–1607. [Google Scholar] [PubMed]
- Xu, F.J.; Jin, C.W.; Liu, W.J.; Zhang, Y.S.; Lin, X.Y. Pretreatment with H2O2 alleviates aluminum-induced oxidative stress in wheat seedlings. J. Integr. Plant Biol. 2011, 53, 44–53. [Google Scholar] [CrossRef] [PubMed]
- Guzel, S.; Terzi, R. Exogenous hydrogen peroxide increases dry matter production, mineral content and level of osmotic solutes in young maize leaves and alleviates deleterious effects of copper stress. Bot. Stud. 2013, 54, 26. [Google Scholar] [CrossRef]
- Calvo, A.M. The VeA regulatory system and its role in morphological and chemical development in fungi. Fungal Genet. Biol. 2008, 45, 1053–1061. [Google Scholar] [CrossRef] [PubMed]
- Varga, J.; Frisvad, J.C.; Samson, R.A. Two new aflatoxin producing species, and an overview of Aspergillus section Flavi. Stud. Mycol. 2011, 69, 57–80. [Google Scholar] [CrossRef] [PubMed]
- Zhou, R.; Linz, J.E. Enzymatic function of the nor-1 protein in aflatoxin biosynthesis in Aspergillus parasiticus. Appl. Environ. Microbiol. 1999, 65, 5639–5641. [Google Scholar] [PubMed]
- Dutton, M.F. Enzymes and aflatoxin biosynthesis. Microbiol. Rev. 1988, 52, 274–295. [Google Scholar] [PubMed]
- Amare, M.G.; Keller, N.P. Molecular mechanisms of Aspergillus flavus secondary metabolism and development. Fungal Genet. Biol. 2014, 66, 11–18. [Google Scholar] [CrossRef] [PubMed]
- Nelson, D.R. Progress in tracing the evolutionary paths of cytochrome P450. Biochim. Biophys. Acta 2011, 1814, 14–18. [Google Scholar] [CrossRef] [PubMed]
© 2015 by the authors; licensee MDPI, Basel, Switzerland. This article is an open access article distributed under the terms and conditions of the Creative Commons Attribution license (http://creativecommons.org/licenses/by/4.0/).
Share and Cite
Roze, L.V.; Laivenieks, M.; Hong, S.-Y.; Wee, J.; Wong, S.-S.; Vanos, B.; Awad, D.; Ehrlich, K.C.; Linz, J.E. Aflatoxin Biosynthesis Is a Novel Source of Reactive Oxygen Species—A Potential Redox Signal to Initiate Resistance to Oxidative Stress? Toxins 2015, 7, 1411-1430. https://doi.org/10.3390/toxins7051411
Roze LV, Laivenieks M, Hong S-Y, Wee J, Wong S-S, Vanos B, Awad D, Ehrlich KC, Linz JE. Aflatoxin Biosynthesis Is a Novel Source of Reactive Oxygen Species—A Potential Redox Signal to Initiate Resistance to Oxidative Stress? Toxins. 2015; 7(5):1411-1430. https://doi.org/10.3390/toxins7051411
Chicago/Turabian StyleRoze, Ludmila V., Maris Laivenieks, Sung-Yong Hong, Josephine Wee, Shu-Shyan Wong, Benjamin Vanos, Deena Awad, Kenneth C. Ehrlich, and John E. Linz. 2015. "Aflatoxin Biosynthesis Is a Novel Source of Reactive Oxygen Species—A Potential Redox Signal to Initiate Resistance to Oxidative Stress?" Toxins 7, no. 5: 1411-1430. https://doi.org/10.3390/toxins7051411