

Summary
Total cellular RNA provides a poor template for studying short-term changes in RNA synthesis and decay as well as the kinetics of RNA processing. Here, we describe metabolic labeling of newly transcribed RNA with 4-thiouridine followed by thiol-specific biotinylation and purification of newly transcribed RNA allowing to overcome these limitations.
Abstract
The development of whole-transcriptome microarrays and next-generation sequencing has revolutionized our understanding of the complexity of cellular gene expression. Along with a better understanding of the involved molecular mechanisms, precise measurements of the underlying kinetics have become increasingly important. Here, these powerful methodologies face major limitations due to intrinsic properties of the template samples they study, i.e. total cellular RNA. In many cases changes in total cellular RNA occur either too slowly or too quickly to represent the underlying molecular events and their kinetics with sufficient resolution. In addition, the contribution of alterations in RNA synthesis, processing, and decay are not readily differentiated.
We recently developed high-resolution gene expression profiling to overcome these limitations. Our approach is based on metabolic labeling of newly transcribed RNA with 4-thiouridine (thus also referred to as 4sU-tagging) followed by rigorous purification of newly transcribed RNA using thiol-specific biotinylation and streptavidin-coated magnetic beads. It is applicable to a broad range of organisms including vertebrates, Drosophila, and yeast. We successfully applied 4sU-tagging to study real-time kinetics of transcription factor activities, provide precise measurements of RNA half-lives, and obtain novel insights into the kinetics of RNA processing. Finally, computational modeling can be employed to generate an integrated, comprehensive analysis of the underlying molecular mechanisms.
Introduction
Gene expression profiling is a key tool used to study cellular processes and the associated complex interaction network. Studies on mRNA abundance have typically been the method of choice to obtain basic insights into the underlying molecular mechanisms. The development of whole-transcriptome microarrays 1 and, more recently, next-generation sequencing of RNA (RNA-seq) 2-4 fueled this approach. While these technologies have revolutionized our understanding of the complexity of cellular gene expression, they face major limitations due to intrinsic properties of their template sample, i.e. total cellular RNA. First, short-term changes in total RNA levels do not match changes in transcription rates, but are inherently dependent on the RNA half-life of the respective transcripts. While a fivefold induction of a short-lived transcript, e.g. encoding for a transcription factor, will be readily detectable in total RNA within an hour, the same induction of a long-lived transcript, e.g. encoding for a metabolic enzyme, will remain virtually invisible. In addition, even a complete shut-down (>1,000-fold down-regulation) in the transcription rate of an average gene with an RNA half-life of five hours will simply take five hours for its total RNA levels to decrease by only twofold. Therefore, analysis of total RNA favors the detection of up-regulation of short-lived transcripts, many of which encode for transcription factors and genes with regulatory functions 5. In addition, the true kinetic cascade of regulation is obscured and primary signaling events cannot be differentiated from secondary. Both, in turn, may result in substantial bias in downstream bioinformatics analyses. Second, alterations in total RNA levels cannot be attributed to changes in RNA synthesis or decay. Measurements of the latter require cell invasive approaches, e.g. blocking transcription using actinomycin D 6, and extended monitoring of ongoing RNA decay over time. With a mean mRNA half-life in mammalian cells of 5 - 10 hr 5,7, mRNA levels of most genes will only have decreased by less than twofold following several hours of transcriptional arrest. These rather small differences result in grossly imprecise measurements of mRNA half-lives for the majority of cellular genes due to the exponential nature of the underlying mathematical equations. Finally, while RNA-seq of total cellular RNA revealed that approximately half of our genes are subject to alternative splicing events8, the underlying kinetics as well as the dynamic mechanisms guiding tissue- and context-specific regulation of RNA processing remain poorly understood. In addition, the contribution of RNA processing to differential gene expression, particularly for non-coding RNAs, remains to be determined. Altogether, these limitations represent major obstacles for bioinformatic kinetic modeling of the underlying molecular mechanisms.
We recently developed an approach, termed high resolution gene expression profiling, to overcome these problems 5,7,9. It is based on metabolic labeling of newly transcribed RNA using 4-thiouridine (4sU-tagging), a naturally occurring uridine derivative, and provides direct access to newly transcribed transcripts with minimal interference in cell growth and gene expression (see Figure 1) 5,10-12. Exposure of eukaryotic cells to 4sU results in its rapid uptake, phosphorylation to 4sU-triphosphate, and incorporation into newly transcribed RNA. Following isolation of total cellular RNA, the 4sU-labeled RNA fraction is thiol-specifically biotinylated generating a disulfide bond between biotin and the newly transcribed RNA. 'Total cellular RNA' can then be quantitatively separated into labeled ('newly transcribed') and unlabeled ('pre-existing') RNA with high purity using streptavidin-coated magnetic beads. Finally, labeled RNA is recovered from the beads by simply adding a reducing agent (e.g. dithiothreitol) cleaving the disulfide bond and releasing the newly transcribed RNA from the beads.
Newly transcribed RNA depicts the transcriptional activity of every gene during the timeframe of 4sU exposure. 4sU-tagging in the timescale of minutes thus provides a snapshot picture of eukaryotic gene expression and an ideal template for down-stream bioinformatic analyses (e.g. promoter analysis). In cases where steady-state conditions can be assumed, the ratios of newly transcribed/total, newly transcribed/unlabeled and unlabeled/total RNA provide non-invasive access to precise RNA half-lives 7,13. In addition, it is important to note that newly transcribed RNA purified after as little as 5 min of 4sU-tagging (5 min 4sU-RNA) is younger than 15 and 60 min 4sU-RNA. When performing both ultra-short and progressively longer 4sU-tagging in a single experimental setting combined with RNA-seq, the kinetics of RNA processing are revealed at nucleotide resolution 9. Finally, time-course analyses of newly transcribed and total RNA combined with computational modeling allow an integrative analysis of RNA synthesis and decay 14.
In conclusion, this approach allows for the direct analysis of the dynamics of RNA synthesis, processing, and degradation in eukaryotic cells. It is applicable in all major model organisms including mammals, insects (Drosophila), amphibians (Xenopus), and yeast 5,15,16. It is directly compatible with microarray analysis 5,17, RNA-seq 9,13,14, and is applicable in vivo12,15. Here, we detail the methodology to label, isolate, and purify newly transcribed RNA in cultured mammalian cells. In addition, potential problems and pitfalls are discussed.
Subscription Required. Please recommend JoVE to your librarian.
Protocol
1. Metabolic Labeling with 4-thiouridine
Make a detailed plan of the experimental setup/schedule, e.g. when to add the 4sU to cell culture and when to harvest the samples. Plan for at least 5 min in between each condition. Only treat cells of one condition at a time. Handle max. 3 - 5 dishes at a given time. Handle cells as quickly as possible to minimize changes in temperature and CO2 levels. Avoid exposing the cells to bright light after 4sU is added as this may result in crosslinking of 4sU-labeled RNA to cellular proteins.
Start of labeling
- Thaw 4-thiouridine (4sU) just before use and pipette required amount of 4sU for each condition into a sterile Falcon tube.
- Take the required amount of cell culture medium (5 ml per 10 cm dish) off the dishes and add to 4sU-containing Falcon tube and mix thoroughly. Remove and discard the remaining medium from the dishes.
- Apply 4sU-containing medium back to the dishes.
End of labeling
- Remove cell culture medium from cells. Add 5 ml of Trizol to each plate. For complex experiments including multiple time points or conditions, this step is best done by two people, one removing the medium, the other adding Trizol and harvesting the lysate.
- Incubate for 5 min at room temperature for complete cell lysis.
- Use a 10 ml pipette to rinse the plate carefully with the added Trizol. This aids complete cell lysis and sample recovery. Handle with care as Trizol is extremely hazardous when getting in contact with skin or eyes! Have antidote for phenol burns at hand (e.g. Polyethylene glycol 300 or 400 in industrial methylated spirits (70:30)). Transfer samples to polypropylene tubes. Please note that standard Falcon tubes do not resist these high g forces). Samples can be stored at -20 °C for at least one month until total RNA is prepared.
2. RNA Preparation Using Modified Trizol Protocol
- Add 1 ml chloroform (0.2 ml per ml Trizol) and shake vigorously for 15 sec. Incubate at room temperature for 2 - 3 min.
- Centrifuge at 13,000 × g for 15 min at 4 °C.
- Transfer aqueous upper phase (containing the RNA) to a new 15 ml polypropylene tube.
- Add ½ the reaction volume of both RNA precipitation buffer and isopropanol (e.g. to 3 ml supernatant add 1.5 ml RNA precipitation buffer and 1.5 ml isopropanol).
- Mix well. Incubate at room temperature for 10 min.
- Centrifuge at 13,000 × g for 10 min at 4 °C. Discard supernatant.
- Spin down briefly (5,000 × g for 30 sec) and remove residual isopropanol with 200 μl pipette.
- Add an equal volume of 75% ethanol and shake tube until the pellet detaches. Avoid breaking it into many small pieces as this may make removal of residual ethanol difficult.
- Centrifuge at 13,000 × g for 10 min at 4 °C. Discard supernatant.
- Spin down RNA briefly and remove remaining ethanol with a 200 μl pipette. Repeat step and remove remaining ethanol with a 20 μl pipette. After these two steps, no further drying of the pellet should be performed.
- Add 100 μl of H2O per 100 μg expected RNA yield and mix well by pipetting up and down 5 - 6 times to aid in dissolving the RNA.
- Dissolve and denature RNA by heating to 65 °C for 10 min (shaker) and immediately place on ice.
- Measure RNA concentration at 260 nm using a NanoDrop spectrophotometer, following manufacturer's instructions. This RNA can be stored at -80 °C for at least one month.
3. Thiol-specific Biotinylation of Newly Transcribed RNA
- Start with 60 - 80 μg of total cellular RNA.
- Constitute labeling reaction. Pipette in the following order (per μg RNA):
- 1 μl 10x Biotinylation Buffer
- 7 μl RNA (containing 1 μg RNA diluted in nuclease-free H2O)
- 2 μl biotin-HPDP (1 mg/ml DMF)
Always add the biotin-HPDP last and mix immediately by pipetting. In case the biotin precipitates, DMF content can be increased to a final concentration of 40%.
- Incubate at room temperature for 1.5 hr with rotation.
- Add an equal volume of chloroform. Mix vigorously. Incubate for 2 - 3 minutes until the phases begin to separate and bubbles start to disappear.
- Centrifuge at 20,000 × g for 5 min at 4 °C. Carefully transfer the upper aqueous phase into a new tube.
- Repeat steps 3.4 and 3.5 once. You may want to perform this step in 2 ml Phase Lock Gel Heavy tubes to reduce loss of RNA.
- RNA precipitation: add 1/10 the volume of 5 M NaCl and an equal volume of isopropanol to the water phase.
- Centrifuge at 20,000 × g for 20 min at 4 °C. Discard supernatant.
- Add an equal volume of 75% ethanol, centrifuge at 20,000 × g for 10 min at 4 °C, discard supernatant.
- Spin briefly and remove residual ethanol with 200 μl pipette.
- Spin briefly and remove residual ethanol with 20 μl pipette.
- Do not allow RNA to dry. Re-suspend it in 50 - 100 μl H2O (~1 μl per 1 μg input RNA). Mix well by pipetting up and down 5 - 6 times.
- Check RNA quality by electrophoretical analysis to exclude RNA degradation.
4. Dot Blot Analysis of 4sU-incorporation (Optional)
4sU incorporation can be readily determined by dot blot analysis of biotinylated RNA. This is an optional step that allows trouble shooting and estimation of 4sU incorporation rates relative to a biotinylated DNA oligo control. For this assay we recommend using iodoacetyl-biotin instead of biotin-HPDP for biotinylation of 4sU-labeled RNA in step 3.2. This results in an irreversible biotinylation of 4sU-RNA. Therefore, column-based methods (e.g. RNeasy) can be used for recovery of much smaller amounts of biotinylated RNA (e.g. 5 μg). While RNA biotinylated using biotin-HPDP is also suitable for this assay, the resulting signal is weaker and the signal-noise ratio less favorable (Figure 3).
- Follow the protocol for 4sU-labeling and isolation of total cellular RNA as described in sections 1 and 2.
- Biotinylate 4sU-labeled RNA as described in section 3 replacing biotin-HPDP with iodoacetyl-biotin and perform two chloroform extractions to completely remove excessive iodoacetyl-biotin residues.
- Recover biotinylated RNA by isopropanol/ethanol precipitation as described or using a column-based approach (e.g. RNeasy) in case small amounts of RNA (<10 μg) are used.
- Incubate the Zeta membrane in nuclease-free water with rocking for 10 min.
- Take the membrane out of the nuclease-free water and remove excessive fluids by placing membrane in between two clean paper towels and pressing firmly. Air-drying the membrane for 5 min will result in nicer dots.
- For each sample, prepare 20 μl of 200 ng/μl RNA using ice cold dot blot binding buffer (10 mM NaOH, 1 mM EDTA). Apply 5 μl of this dilution (i.e. 1 μg of RNA) as well as three subsequent 10-fold dilutions (i.e. 100, 10, and 1 ng RNA, respectively) to the Zeta membrane by pipetting. Pipetting through an empty rack of pipette tips can be employed to provide evenly distributed spacing. Alternatively, use a dot blot apparatus according to the manufacturer's instructions.
- Apply 5 μl of the biotin-labeled DNA oligo at concentrations ranging from 20 ng/μl to 20 pg/μl (i.e. 100 to 0.1 ng oligo) as a positive control to the membrane by pipetting. Use a biotinylated, 4sU-naive sample as negative control.
- Air-dry the membrane for 5 min.
- Incubate the membrane for 30 min in 40 ml blocking buffer with rocking.
- Incubate the membrane with 10 ml of 1:1,000 streptavidin-horseradish peroxidase for 15 min (5 ml PBS + 5 ml 20% SDS + 10 μl streptavidin-horseradish peroxidase)
- Wash membrane twice in 40 ml PBS + 10% SDS (20 ml PBS + 20 ml 20% SDS) for 5 min.
- Wash membrane twice in 40 ml PBS + 1% SDS (38 ml PBS + 2 ml 20% SDS) for 5 min.
- Wash membrane twice in 40 ml PBS + 0.1% SDS (40 ml PBS + 200 μl 20% SDS) for 5 min.
- Remove excessive fluid by placing membrane in between two clean paper towels and pressing on them firmly.
- Visualize membrane-bound HRP using ECL per manufacturer's instructions.
- Place the membrane in plastic foil/bag, remove air bubbles and incubate for 2 min in the dark.
- Expose membrane to film for 1 - 5 min.
5. Separation of Labeled and Unlabeled RNA Using Streptavidin-coated Magnetic Beads
- Heat washing buffer (3 ml per sample) to 65 °C in a water bath.
- Prepare fresh 100 mM dithiothreitol (DTT) in nuclease-free H2O. Do so by decanting 15 - 30 mg of DTT powder into a clean 50 ml Falcon tube placed on the ultra-fine scale. Weigh and add required amount of nuclease-free H2O.
- Heat biotinylated RNA samples to 65 °C for 10 min to denature and immediately place on ice.
- Place μMacs columns into the magnetic stand. We recommend not to process more than 12 samples at a time (6 - 8 samples are optimal).
- Pre-equilibrate Miltenyi columns with 1 ml room temperature washing buffer. This will take about 15 min.
- Meanwhile, add 100 μl of streptavidin beads to 50 - 100 μl of biotinylated RNA. Incubate at room temperature for 15 min with rotation.
- If any of the columns has not initiated draining by now this can be facilitated by gently pressing on the top of the column with a gloved finger. Once the flow has started the columns drain readily.
- Apply the RNA/beads to the columns. Discard the flow-through unless you want to recover the unlabeled RNA fraction (see section 7).
- Wash three times with 0.9 ml of 65 °C washing buffer (1 ml pipette tips shrink when pipetting buffers at 65 °C).
- Wash three times with 0.9 ml room temperature washing buffer.
- Pipette 700 μl Buffer RLT (RNeasy MinElute Cleanup Kit, Qiagen) into new 2 ml tubes and place them underneath the columns.
- Elute the newly transcribed RNA into the RLT Buffer by adding 100 μl of 100 mM DTT to the columns.
- Perform a second elution round 3 min later into the same tube by adding another 100 μl of 100 mM DTT.
6. Recovery of Newly Transcribed RNA
Continue with the RNeasy MinElute Cleanup (Qiagen) protocol following the manufacturer's instructions. Elute in 25 μl nuclease-free H2O. Measure RNA concentrations using a Nanodrop Spectrophotometer. To avoid the need to thaw and re-freeze RNA before submitting it to a high-throughput assay, we recommend preparing cDNA immediately after the newly transcribed RNA is purified. Use 2.5 μl of the newly transcribed RNA in 20 μl cDNA synthesis mix for cDNA synthesis following the manufacturer's instructions. Perform qRT-PCR controls using 1:10 dilutions of the cDNA mix. Store RNA at -80 °C.
7. Recovery of Unlabeled, Unbound RNA (Optional)
In case the unbound RNA needs to be recovered; collect and combine the flow-through (after adding the RNA-streptavidin beads solution to the columns) and the first wash for subsequent precipitation. Usually it is sufficient to precipitate only 50% of the unbound RNA as this will contain >80% of the starting material.
- Add an equal volume of isopropanol (no salt needs to be added as the washing buffer already contains 1 M NaCl).
- Centrifuge at 20,000 × g for 20 min at 4 °C. Discard supernatant.
- Add an equal volume of 75% ethanol, centrifuge at 20,000 × g for 10 min at 4 °C, discard supernatant.
- Spin briefly and remove residual ethanol with 200 μl pipette.
- Spin briefly and remove residual ethanol with 20 μl pipette.
- Do not allow RNA to dry. Resuspend it in 100 μl H2O. Mix well by pipetting up and down 5 - 6 times. Incubate at 65 °C for 10 min with shaking and transfer directly to ice.
- Check RNA quality by electrophoretical analysis to exclude RNA degradation.
Subscription Required. Please recommend JoVE to your librarian.
Representative Results
1. Starting Material and Expected Yields
Following 1 hour (hr) of 4sU-exposure newly transcribed RNA represents about 1 - 4% of total cellular RNA. This will be lower in growth-arrested cells as they no longer synthesize RNA to account for cell growth/replication. When labeling for 1 hr, we recommend starting the assay with 60 - 80 μg of total RNA. Starting with less than 30 μg of total RNA results in small RNA pellets that are hard to see after the biotinylation step and thus may be easily lost. Input RNA levels may be increased to as much as 150 μg for very short durations of labeling (e.g. 5 - 10 min). When the duration of RNA labeling is shortened from 1 hr to 5 min the contribution of short-lived intronic sequences in newly transcribed RNA increases from ~60% to ~80% 9. As introns are substantially longer compared to coding sequences as well as 5'- and 3'-UTRs, the amount of newly transcribed RNA, which can be purified following short- or even ultra-short 4sU-tagging, does not drop linearly. As such, we obtained >0.5% of total RNA following 5 min of 4sU-tagging in non-adherent human B-cell lines 9. It should, however, be noted that higher concentration of 4sU and slightly longer durations of labeling may be required to achieve similar 4sU incorporation rates in adherent cells. While even a low 4sU-incorporation rate will allow efficient capture and purification of large, uridine-rich transcripts, very short transcript with low uridine content (e.g. miRNAs) are likely to escape purification even when using high 4sU concentrations (>1 mM). In NIH-3T3 murine fibroblasts, 1 hr of 200 μM 4sU exposure labeled newly transcribed RNA with about one 4sU residue per 50 - 100 nucleotides (nt) 5. This should allow highly efficient recovery of transcripts >500 - 1000 nt in length. Accordingly, we only observed a minor transcript size bias when labeling for 1 hr using 200 μM 4sU in both murine fibroblasts and human B-cells 7. While 1 hr of 200 μM 4sU did not result in any significant alterations in cellular transcripts levels in murine fibroblasts, prolonged exposure of cells to ≥200 μM 4sU does result in a measurable growth deficit within 24 hr (unpublished data). Therefore, both the duration of labeling and the employed 4sU-concentration should be minimized to avoid ectopic or toxic effects. An easy way to determine the minimal 4sU-concentration required for efficient recovery of newly transcribed RNA is to purify newly transcribed RNA following 4sU-labeling with increasing concentrations of 4sU (e.g. 50 - 1600 μM). As shown in Figures 2A and 2B, recovery of newly transcribed RNA labeled for 1 hr in primary human fibroblasts increased substantially from 50 to 200 μM 4sU but then started to plateau.
2. Dot Blot Quantification of 4sU Incorporation (optional)
In some cases it may be of interest to measure the amount of 4sU incorporation in total RNA. This is best done by dot blot analysis on the biotinylated RNA using a streptavidin conjugate. Due to its chemical nature iodoacetyl-biotin is more reactive to thiol-groups than biotin-HPDP resulting in the biotinylation of virtually all 4sU residues in newly transcribed RNA. It is important to note that, like biotin-HDPD, iodoacetyl-biotin is not water-soluble and is thus efficiently removed by chloroform extraction as performed for biotin-HPDP. Therefore, identical reaction conditions and concentrations can be employed as when using biotin-HPDP. However, iodoacetyl-biotin is not reversible. It can thus not be used for the purification of newly transcribed RNA in column based approaches. While the use of iodoacetyl-biotin allows to quantify 4sU-incorporation, biotin-HPDP based measurements consider both 4sU-incorporation and biotinylation efficiency. Employing the two biotinylation reagents to the same sample allows for the measurement of the biotinylation efficiency of RNA-incorporated 4sU. Biotinylation efficiency of biotin-HPDP for 4sU-labeled RNA seems to be approximately three fold less than that of iodoacetyl-biotin indicating that only about one in three 4sU residues in newly transcribed RNA is actually biotinylated by biotin-HPDP(Figure 3). By comparing the sample signal intensities with the biotinylated control DNA oligo, biotinylation densities can be measured. For most mammalian cell lines a positive signal should still be detectable in 10 ng of biotinylated RNA following 1 hr of 200 μM 4sU labeling. A weak background signal is usually detectable for the highest concentration (1 μg) of unlabeled RNA.
3. Purification of Newly Transcribed RNA
Recovery of newly transcribed RNA is highly quantitative. If you started with the same RNA concentration you can expect to obtain the same amounts of newly transcribed RNA for all samples. Like many column-based assays, collection of newly transcribed RNA using the RNeasy MinElute kit may result in additional absorption at 230 - 260 nm (presence of detergents derived from the washing buffers) which may interfere with OD260 measurements. This is seen to a lesser extent when using a fresh 2 ml collection tube for each centrifugation step. Nevertheless, any unreasonably high OD measurements (>2-fold greater than other samples) should be considered with care, particularly if OD260/280 ratios are <1.7. For down-stream analyses it is thus often best to use the same amount of template RNA volume for all samples. In cases where the yields of labeled RNA are lower than expected check for signs of RNA degradation by electrophoretical analysis. Newly transcribed RNA contains significantly greater amounts of large, unspliced transcripts with the typical rRNA bands being much less prominent (Figure 4).
4. Quantification of Newly Transcribed RNA
Finally, incorporation rates of 4sU in newly transcribed RNA can be directly quantified by spectrophotometric analysis based on the absorption maximum of 4sU at 330 nm and the OD330/260 ratio 5,18. This requires >3 μg of labeled RNA concentrated in a small volume (10 - 20 μl) by isopropanol/ethanol precipitation. To avoid losing the small RNA pellet co-precipitation with 30 μg of nuclease-free glycogen (Fermentas, #R0551) should be performed. An additional peak is visible at 330 nm reflecting the incorporation rate of 4sU into newly transcribed RNA (Figure 5).

Figure 1. Principle of metabolic labeling with 4-thiouridine (4sU). 4sU is added to cells for the required (5 - 120 min) time followed by preparation of total cellular RNA. Following thiol-specific biotinylation, total cellular RNA is separated into 4sU-labeled, newly transcribed RNA, and unlabeled, pre-existing RNA using streptavidin-coated magnetic beads. Newly transcribed RNA is recovered from the beads using a reducing agent which cleaves the disulfide bonds that link the newly transcribed RNA to the beads. Click here to view larger figure.
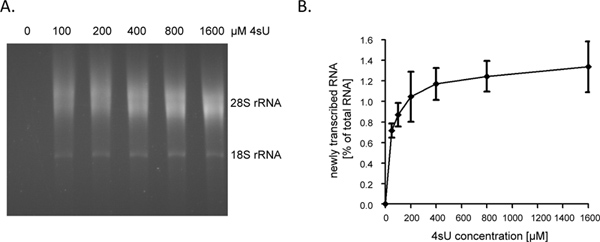
Figure 2. Recovery of newly transcribed RNA following increasing concentrations of 4sU. (A) Primary human foreskin fibroblasts (HFF) were incubated with 100, 200, 400, 800 or 1,600 μM of 4sU. Newly transcribed RNA was purified from 50 μg total cellular RNA and subjected to electrophoretical analysis. As expected, a concentration dependent increase in recovered newly transcribed RNA was observed which started to plateau at higher concentrations. (B) Amounts of purified newly transcribed RNA were quantified using the ImageJ 1.45s software. Combined data of four independent experiments on the amounts of newly transcribed RNA recovered following different concentrations of 4sU-labeling ranging from either 50 - 800 μM 4sU (n = 2) or 100 - 1,600 μM 4sU (n = 2) are shown. Click here to view larger figure.

Figure 3. Estimation of 4sU incorporation in 4sU-labeled total RNA using dot blot analysis. Total RNA was isolated from NIH-3T3 murine fibroblasts or human foreskin fibroblasts (HFF) incubated with 200 μM 4sU for one hour. No 4sU was added to one dish as negative control. For HFF both contact inhibited (n = non-growing cells) and growing cells (y) were included. RNA was isolated using Trizol reagent and subsequently conjugated to biotin-HPDP or iodoacetyl-biotin. Concentration of each sample was adjusted to 200 ng/μl and 5 μl of this dilution (i.e. 1 μg of RNA), as well as three subsequent 10-fold dilutions (i.e. 100, 10, and 1 ng RNA, respectively), were all spotted on a piece of Zeta membrane. 5 μl dilutions of biotin-labeled DNA oligo were placed on the membrane as positive controls at concentrations ranging from 20 ng/μl down to 20 pg/μl (i.e. 100 to 0.1 ng, respectively). Biotin density was probed using a streptavidin-horseradish peroxidase conjugate.
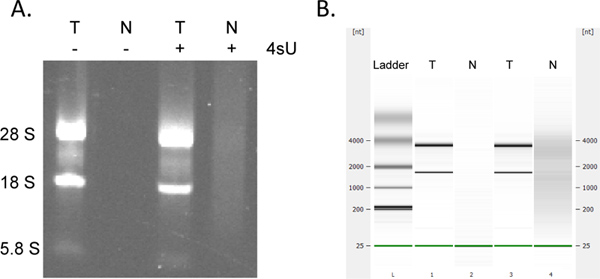
Figure 4. Electrophoretical analysis of newly transcribed and total RNA. Total RNA (T) and newly transcribed RNA (N) prepared from murine NIH-3T3 fibroblasts cultured both in presence and absence of 500 μM 4sU for 1 hr was analyzed by agarose gel electrophoresis (A) and (in the same order) using the Agilent Bioanalyser (B). No RNA was recovered without 4sU treatment of cells. Purified newly transcribed RNA contains greater amounts of high molecular weight mRNAs and significantly less mature rRNAs than total RNA as notable between the 28S, 18S, and 5.8S rRNA bands. Click here to view larger figure.
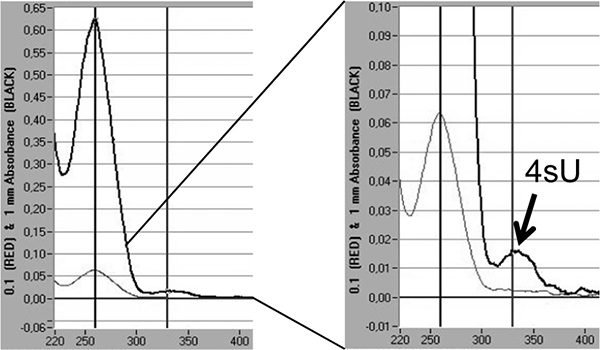
Figure 5. Quantification of 4sU incorporation in newly transcribed RNA by spectrophotometric analysis. Newly transcribed RNA purified from 2 x 100 μg total RNA following 1 hr of 200 μM 4sU in murine NIH-3T3 fibroblasts. Newly transcribed RNA was precipitated with isopropanol/ethanol after adding 30 μg of nuclease-free glycogen. Spectrophotometric analysis of newly transcribed RNA obtained by a Nanodrop 1000 spectrophotometer is shown. The light grey lines represent measurements at 0.1 mm while the thicker, dark grey lines represent measurements at 1 mm fluid column. On the right, a magnification of the peak of extinction representing the incorporated 4sU-residues is shown. Based on the extinction co-efficient of 4sU 18 the incorporation rates of 4sU can be estimated.
| Duration of labeling [min] | Recommended 4sU concentration [μM] |
| 120 | 100 - 200 |
| 60 | 200 - 500 |
| 15 - 30 | 500 - 1000 |
| <10 | 500 - 2000 |
Table 1. Recommended 4sU concentrations.
Subscription Required. Please recommend JoVE to your librarian.
Discussion
Metabolic labeling of newly transcribed RNA substantially enhances the power of high-throughput technologies like microarrays and RNA-seq by providing more suitable templates to address the biological question of interest. The present protocol underwent extensive optimization. It allows >1,000-fold enrichment of newly transcribed RNA and provides highly reproducible results.
The experimental design of a 4sU-tagging experiment is of crucial importance as newly transcribed RNA will depict the real-time transcriptional activity only during the time of exposure of cells to 4sU. If the actual changes in transcription rates following a stimulus have already subsided, these will be missed when analyzing newly transcribed RNA even though the changes in total RNA levels may still be detectable. Therefore, a good understanding of the underlying biology is important to define the experimental setup as well as the optimal periods of time for 4sU exposure. Below, we provide recommendations and ways for avoiding common pitfalls for the most crucial steps.
Preparation of stock solutions and plastic ware
All stock solutions must be prepared using nuclease-free water. Using in-house purified deionized water may result in problems if the water contains reducing agents. In one case, this resulted in the complete loss of all labeled RNA. Therefore, we strongly recommend buying pre-made nuclease-free NaCl, Tris-Cl, EDTA, sodium citrate and water. Ensure nuclease-free conditions at all times. Dimethylformamide (DMF) dissolves some plastic materials. We found that using 25 ml cell culture plastic pipettes to transfer DMF from its stock glass bottle to 50 ml Falcon tubes to prepare the biotin-HPDP stock solution was sufficient to substantially reduce yields of newly transcribed RNA from the whole assay. Interestingly, this did not negatively affect the biotinylation efficiency (as tested by dot blot) but resulted in a 75 to >90% loss of newly transcribed RNA that could be recovered from the beads. The loss was most pronounced when the duration of labeling was reduced from 60 to 30 min or less. Most likely, a substance eluted from the plastic pipettes by the DMF partially destroyed the coating of the streptavidin beads. Therefore, the use of plastic materials not known to be compatible with DMF should be avoided by all means. For the same reasons, cell scrapers should not be used to enhance recovery of Trizol samples from cell culture plates. It is interesting to note that the putative substances eluted from the plastics by the DMF or Trizol were apparently neither removed by chloroform extraction nor isopropanol/ethanol precipitation.
Cell culture
Cell density on the plates is of crucial importance. In one experiment where the cells appeared to be slightly too confluent (90 - 100%), we treated NIH-3T3 murine fibroblasts for 30 min with 100 U/ml of interferon (IFN) α or γ. In less confluent cells even 15 min of IFN treatment already resulted in a 5- to 8-fold induction of genes like irf1 or socs3 5. With cells being slightly too confluent microarray analysis did not show any induction of IFN-inducible genes for even the most rapidly inducible genes like irf1 or socs3. Therefore, cell density is a crucial factor for 4sU-labeling experiments and all cell culture plates should be carefully examined before starting the labeling.
4sU is a photoactivatable ribonucleoside and 4sU-containing RNA is efficiently crosslinked to proteins after exposure to 365 nm light source. 4sU-treated cells should be cultured in the dark and exposure to bright light should be avoided. After the removal of cellular proteins by Trizol RNA isolation this risk is substantially reduced.
4sU is not incorporated into cellular DNA. It should, however, be noted that total RNA will still contain small amounts of cellular DNA. When using 4sU-tagging and q-RT-PCR analysis to study viral gene expression in cytomegalovirus infection we found it necessary to include a DNaseI digest step in the protocol to remove the concatemeric viral genomes19. This is probably not necessary when using downstream protocols which are not sensitive to the presence of DNA.
4sU incorporation rates and optimal 4sU concentration
4sU is readily taken up by cells with intra- and extra-cellular levels most likely equilibrating within less than a minute 9,16. Uptake and incorporation rates of 4sU are concentration-dependent. Therefore, 4sU concentration can be conveniently adjusted according to the employed duration of labeling. Table 1 provides advice on 4sU concentrations in relation to the duration of labeling based on our best personal experience. For 1 hr of 4sU labeling in mammalian cells, 200 μM 4sU will be sufficient for most applications resulting in about one 4sU residue per 50 to 100 nucleotides in newly transcribed RNA in fibroblasts.
In the last couple of years, we have applied 4sU-tagging to a broad range of cell types of human and murine origin including fibroblasts, endothelial cells, epithelial cells, bone marrow stroma cells, macrophages and T-cells. In addition, cells from Drosophila and xenopus were successfully used. In all of these experiments, 4sU incorporation was found to be highly efficient requiring minimal adjustments in 4sU concentration for the different cell types. When setting up the method for new cell types, we would recommend to label cells with increasing 4sU-concentrations (e.g. ranging from 50 to 1600 μM) and analyze the relation of purified newly transcribed RNA to the applied 4sU-concentrations (see Figure 2A/B). The 4sU-concentration at which the amount of purified newly transcribed RNA enters a plateau should be chosen.
In cases where highly confluent, contact inhibited cells are used, we would recommend to use slightly higher 4sU concentrations (e.g. 500 instead of 200 μM) to ensure efficient 4sU incorporation. Additionally, in cases where capture of very short newly transcribed transcripts (<200 nt) is of particular interest, the 4sU concentration may also need to be increased. This should not be combined with prolonged labeling times (e.g. >1 hr) in order to avoid ectopic effects or toxicity. Finally, we found that using too small a volume of cell culture media may reduce 4sU incorporation efficiency. We therefore recommend using 5 ml or 10 ml of medium per 10 cm or 15 cm dish, respectively.
Preparation of total cellular RNA
For the success of this protocol it is crucial to obtain clean, RNase-free total cellular RNA. Using 5 ml Trizol per 15 cm dish produces clean RNA free of nucleases. We recommend using the modified Trizol protocol by Chomczynski et al.20. First, it is better suited to isolate large amounts of RNA (>100 μg) as the enhanced centrifugal force results in firmer pellets which are easier to handle during the washing steps. However, this requires the use of special polypropylene tubes and adaptors as the regular 15 ml laboratory Falcon tubes do not survive more than 6,000 × g. Secondly, it improves the removal of DNA and glycoproteins. This becomes particularly obvious when preparing RNA from organs or tissues. Thirdly, it does not limit the maximum amount of total RNA which can be isolated. Although we also found column-based RNA isolation methods (e.g. RNeasy) to provide RNA of suitable quality, standard columns are only able to capture up to 100 μg of total RNA thereby limiting the amount of starting material. Finally, by removing the remaining ethanol twice with a pipette, drying of the RNA to remove residual ethanol is no longer required. This eliminates the risk of over-drying the RNA, which may be difficult to dissolve again afterwards. In principle, 4sU-tagging is applicable in vivo, e.g. by i.v. injection of mice. However, we noted that RNA purity represents a major problem requiring the purification of polyA transcripts before purification of newly transcribed RNA (unpublished data).
Biotinylation and removal of unbound biotin
Biotin-HPDP is 100% thiol-specific and forms a disulfide bond between the biotin residue and thiol-labeled RNA newly transcribed molecules. Biotinylation efficiency of 4sU-labeled RNA is about 30% as determined by dot blot analysis 5. As biotin-HPDP is not water soluble it can be efficiently removed by chloroform extraction. While a single chloroform extraction step is sufficient to remove the vast majority of unbound biotin we regularly repeat this step to ensure complete removal. To reduce RNA loss during the chloroform extraction step 2 ml Phase Lock Gel Heavy tubes (Eppendorf) may be used following the manufacturer's instructions. Usually we use the Phase Lock tubes only for the second chloroform extraction step as the template volumes of the first step are often too high to be directly compatible with these tubes. Following removal of unbound biotin-HPDP, RNA is recovered by isopropanol/ethanol precipitation. It is important to note that commercial column-based kits to recover the biotinylated RNA (e.g. RNeasy from QIAGEN) should not be used as they contain reducing agents in the buffers provided, which cleave the disulfide bond and remove the biotin from the newly transcribed RNA.
Purification of newly transcribed RNA
Do not add more than 100 μl biotinylated RNA to 100 μl streptavidin beads. Adding less volume is preferred. However, the same volume of RNA should be added for all samples. Adjust the RNA input volume (between samples) which you add to the streptavidin beads by simply adding the required volume of 1x TE to the beads. An easy way to make fresh nuclease-free 100 mM DTT is to decant a sufficient amount of DTT powder into a falcon tube placed on an ultra-sensitive scale and then add the required amount of nuclease-free H2O to generate 100 mM DTT (64.8 μl water per 1 mg DTT).
During the development of 4sU-tagging we tested streptavidin beads from various suppliers. A number of them generated large amounts of background. Therefore, we strongly recommend using the Miltenyi Streptavidin beads as, so far, we have never experienced any problems with carry-over of unlabeled RNA from tissue culture-derived RNA samples. In this way, as little as 150 ng of labeled RNA can be specifically purified from 150 μg biotinylated RNA (in 100 μl of water) using 100 μl of streptavidin beads. Equilibration of the beads with the equilibration buffer supplied with the beads may be performed and may slightly enhance capture rates 13.
Quality controls
We recommend performing q-RT-PCR controls on newly transcribed RNA before subjecting it for high-throughput analyses. This may include quantification of several reference genes known to be differentially regulated in the given experimental setting. In cases where 4sU-tagging is employed to study RNA decay rates, we would recommend to quantify a short-lived transcript (e.g. myc, fos) and a long-lived one (e.g. GAPDH) in both total and newly transcribed RNA. The ratio of newly transcribed/total RNA should be substantially higher (~5- to 10-fold) for the short-lived transcripts. Based on the RNA half-life of a reference gene, RNA half-lives can be determined. If all three RNA fractions (total RNA, newly transcribed RNA and unlabeled pre-existing RNA) are analyzed for four or more genes, normalization of the different RNA subsets can be performed by linear regression analysis and quality control scores can be determined as described7,21.
For q-RT-PCR analysis, we recommend using 2.5 μl of labeled RNA in 20 μl cDNA synthesis mix. For optimal comparison of q-RT-PCR results freeze the cDNA in aliquots of 5 μl before first usage. Thaw tubes just before use, add 45 μl of H2O and subject 5 μl of the dilutions to q-RT-PCR analyses. This significantly enhances comparability between different PCR runs.
Newly transcribed RNA samples should be checked for signs of RNA degradation using the Agilent Bioanalyser before subjecting them to high-throughput analysis (microarrays or RNA-seq). It should, however, be noted that additional bands are sometimes observed by the Agilent Bioanalyser. The biological significance of this remains unclear. As newly transcribed RNA contains significantly less ribosomal RNA, these samples occasionally fail the Agilent Bioanalyser quality controls. If this is not due to visible RNA degradation samples of acceptable quality are usually fine to be subjected to high-throughput analysis.
Compatibility of newly transcribed RNA with down-stream analyses
Newly transcribed RNA contains substantially more mRNA than total RNA. This is mainly due to the larger amounts of intronic sequences in newly transcribed RNA which increase when the duration of 4sU-tagging is shortened. Therefore, we do not regularly undertake the depletion of rRNAs from newly transcribed RNA samples as this requires larger amounts of starting material while providing rather little (~twofold) gain in non-rRNA reads. Finally, it remains to be noted that the greater percentage of unspliced, high molecular weight transcripts present in newly transcribed RNA may require additional fragmentation when preparing cDNA libraries for next-generation sequencing. Results of the size fragmentation step should therefore be quality controlled carefully.
Data normalization for RNA half-live measurements
The standard approach to normalize experimental data for RNA half-life measurements is to normalize all data to the RNA half-life of a well characterized house-keeping gene or the median RNA half-life in a given cell type determined in previous experiments. In mammalian cells, the latter lies in the range of 5 to 10 hr6,7. While this approach also works quite nicely for 4sU-based measurements, other means for normalization are required if the median RNA half-life is not known or if it may even be affected by alterations in the cellular system under study, e.g. by the knock-out of an RNA decay pathway. 4sU-tagging offers a unique way of estimating the median RNA half-life based on the analysis of all three RNA fractions, i.e. total cellular RNA, newly transcribed RNA, and unlabeled pre-existing RNA. As total cellular RNA is separated into the latter two RNA fractions a simple linear regression model can be employed to normalize the three RNA fractions to each other and determine the median RNA half-life7,16. A software package is available online to perform these analyses22.
Inefficient capture of transcripts with low uridine content may affect RNA half-life measurements resulting in artificially low newly transcribed/total RNA ratios and prolonged RNA half-lives. The extent of this problem can be assessed by plotting RNA half-lives or log(newly transcribed/total RNA ratios) against the uridine content of all transcripts7,15. This also provides a good quality control to assess differences in 4sU-incorporation rates between different samples or conditions. In cases where a substantial correlation to uridine content is observed this may be corrected for by bioinformatic means15. However, it should be noted that the contribution of mature transcripts in newly transcribed RNA cannot be easily differentiated from the much larger and thus much more uridine-rich precursors. Unless the processing kinetics of a given transcript are known (which they are usually not) simply correcting for low uridine content (inefficient capture) may grossly distort RNA half-lives. As such, we recently found processing of most human snoRNAs to be highly inefficient9. If we had corrected the newly transcribed/total RNA ratios for the low uridine content of the rather small (70 - 300 nt) snoRNAs, this would have resulted in extremely short snoRNA half-lives (<5 min) with numerous newly transcribed/total RNA ratios exceeding 100%. Therefore, we generally do not recommend correcting for low uridine content when measuring RNA half-lives.
Subscription Required. Please recommend JoVE to your librarian.
Disclosures
The authors declare that they have no competing financial interests.
Acknowledgments
We would like to thank Amie Regan for careful reading of the manuscript. This work was supported by NGFN Plus grant #01GS0801, MRC fellowship grant G1002523 and NHSBT grant WP11-05 to L.D. and DFG grant FR2938/1-1 to C.C.F.
Materials
| Name | Company | Catalog Number | Comments |
| 4-thiouridine | Carbosynth | T4509 | Prepare 50 mM stock in sterile H2O, store at -20 °C in aliquots of 50-500 μl, discard unused reagent, do not refreeze. |
| Trizol | Invitrogen | 15596026 (100 ml), 15596018 (200 ml) | WARNING - CORROSIVE and HAZARDOUS TO HEALTH! Ensure immediate access to Phenol antidote (PEG-Methanol); Store at 4 °C. |
| Chloroform | Sigma | 372978 | WARNING - HAZARDOUS TO HEALTH |
| Isopropanol | Sigma | 650447 | |
| Sodium citrate, nuclease-free | Sigma | C8532 | Prepare 1.6 M stock solution using nuclease-free water. |
| 5M nuclease-free NaCl | Sigma | 71386 | Stock solution |
| Nuclease-free H2O | Sigma | W4502 | Make 1 ml aliquots in nuclease-free tubes. |
| RNA precipitation buffer | 1.2 M NaCl, 0.8 M sodium citrate in nuclease free water. Prepare in advance under strictly nuclease-free conditions. Store at room temperature in 50 ml falcon tubes. | ||
| Ethanol | Sigma | 459844 | Use with nuclease-free water to prepare 80% ethanol, store at -20 °C. |
| 1 M nuclease-free Tris Cl, pH 7.5 | Lonza | 51237 | Stock solution |
| 500 mM nuclease-free EDTA, pH 8.0 | Invitrogen | 15575-020 | Stock solution |
| 10x Biotinylation Buffer (BB) | 100 mM Tris pH 7.4, 10 mM EDTA in nuclease-free water, make aliquots of 1 ml. | ||
| Dimethylformamide (DMF) | Sigma | D4551 | |
| EZ-Link biotin-HPDP | Pierce | 21341 | Prepare 1 mg/ml stock solution by dissolving 50 mg biotin-HPDP in 50 ml DMF. Gentle warming enhances solubilisation. Store at 4 °C in aliquots of 1 ml. |
| Phase Lock Gel Heavy tubes 2.0 ml | Eppendorf | 0032 005.152 | Optional for the chloroform extraction step. |
| Zeta membrane | BIORAD | 162-0153 | |
| 10x Dot blot binding buffer | 100 mM NaOH, 10 mM EDTA | ||
| Biotin-oligo | 5'-biotin, 25 nucleotides, any sequence | ||
| Sodium dodecyl sulphate | Fisher | BPE9738 | For 100 ml 20% stock solution, add 20 g SDS to 80 ml PBS pH 7-8 and adjust volume to 100 ml. Keep all high-percentage SDS solutions above 20 °C. Warm the solutions slightly should SDS precipitate. |
| EZ-Link Iodoacetyl-LC-Biotin | Pierce | 21333 | Prepare 1 mg/ml stock solution by dissolving 50 mg iodoacetyl-biotin in 50 ml DMF. Gentle warming enhances solubilisation. Store at 4 °C in aliquots of 1 ml. Generates irreversible, thiol-specific biotinylation. |
| Phosphate buffer saline | Gibco | 10010-015 | |
| Dot blot blocking buffer | Mix 20 ml 20% SDS with 20 ml 1 x PBS pH 7-8 and add EDTA to the final concentration of 1 mM. | ||
| Streptavidin-horseradish peroxidase | Vector Laboratories | SA5004 | Store at -20 °C. Mix 10 ml 20% SDS with 10 ml 1 x PBS. Add 20 μl Streptavidin-HRP before use. |
| ECL reagent | GE Healthcare | RNP2109 | Use following the manufacturer's instructions. |
| Super RX, X-RA Film, 18x24 cm | Fujifilm | 47410 19236 | |
| μMacs Streptavidin Kit | Miltenyi | 130-074-101 | Store the beads at 4 °C. |
| Tween 20 | Sigma | P1379 | |
| Washing buffer | 100 mM Tris pH 7.4, 10 mM EDTA, 1 M NaCl, 0.1% Tween 20 in nuclease-free H2O. | ||
| Dithiothreitol (DTT) | Sigma | 43817 | Prepare as 100 mM DTT in nuclease-free H2O, always prepare fresh before use. |
| RNeasy MinElute Kit | Qiagen | 74204 | Store columns at 4 °C, remaining components of the kit at room temperature. |
| 1.5 ml screw-top polypropylene tubes | Sarstedt | 72.692.005 | Compatible with Dimethylformamide |
| 2.0 ml screw-top polypropylene tubes | Sarstedt | 72.694.005 | Compatible with Dimethylformamide |
| 15 ml tubes | BD Falcon | 352096 | Compatible with Dimethylformamide |
| 50 ml tubes | BD Falcon | 352070 | Compatible with Dimethylformamide |
| All solutions/reagents should be stored at room temperature unless otherwise specified. | |||
| Equipment | |||
| UV/VIS spectrophotometer | Thermo Scientific | NanoDrop 1000 | Or equivalent. Use low volume (1-2 μl) for measurements of low RNA concentrations to avoid excessive sample loss. |
| Polypropylene 15 ml centrifuge tubes | VWR International | 525-0153 | In contrast to standard 15 ml tubes, these tolerate up to 15,000 × g |
| High-speed centrifuge | Beckman Coulter | Avanti J-25 | Or equivalent equipment capable of reaching 13,000×g |
| High-speed rotor | Beckman Coulter | JLA-16250 | Or equivalent equipment capable of reaching 13,000×g |
| Adaptors for 15 ml tubes | Laborgeräte Beranek | 356964 | Or equivalent equipment capable of reaching 13,000×g |
| Refrigerated table-top centrifuge | Eppendorf | 5430 R | Or equivalent. |
| Thermomixer | Eppendorf | Thermomixer compact | Or equivalent. |
| Magnetic stand | Miltenyi Biotec | 130-042-109 | One stand holds 8 μMacs columns. |
| Waterbath | Grant | SUB Aqua 5 | Or equivalent. |
| Ultra-fine scale | A&D | GR-202 | Or equivalent. |
| E-Gel iBase Power System | Invitrogen | G6400UK | For RNA gels; or equivalent. |
| E-Gel EX 1% agarose precast gels | Invitrogen | G4020-01 | For RNA gels; or equivalent. |
References
- Brown, P. O., Botstein, D. Exploring the new world of the genome with DNA microarrays. Nature Genetics. 21, 33-37 (1999).
- Mortazavi, A., Williams, B. A., Mccue, K., Schaeffer, L., Wold, B. Mapping and quantifying mammalian transcriptomes by RNA-Seq. Nature Methods. 5, 621-628 (2008).
- Nagalakshmi, U., Wang, Z., et al. The transcriptional landscape of the yeast genome defined by RNA sequencing. Science. 320, 1344-1349 (2008).
- Wilhelm, B. T., Marguerat, S., et al. Dynamic repertoire of a eukaryotic transcriptome surveyed at single-nucleotide resolution. Nature. 453, 1239-U1239 (2008).
- Dölken, L., Ruzsics, Z., et al. High-resolution gene expression profiling for simultaneous kinetic parameter analysis of RNA synthesis and decay. RNA. 14, 1959-1972 (2008).
- Yang, E., van Nimwegen, E., et al. Decay rates of human mRNAs: correlation with functional characteristics and sequence attributes. Genome Res. 13, 1863-1872 (2003).
- Friedel, C. C., Dölken, L., Ruzsics, Z., Koszinowski, U. H., Zimmer, R. Conserved principles of mammalian transcriptional regulation revealed by RNA half-life. Nucleic Acids Res. 37, e115 (2009).
- Nilsen, T. W., Graveley, B. R. Expansion of the eukaryotic proteome by alternative splicing. Nature. 463, 457-463 (2010).
- Windhager, L., Bonfert, T., et al. Ultra short and progressive 4sU-tagging reveals key characteristics of RNA processing at nucleotide resolution. Genome Res. , (2012).
- Melvin, W. T., Milne, H. B., Slater, A. A., Allen, H. J., Keir, H. M. Incorporation of 6-thioguanosine and 4-thiouridine into RNA. Application to isolation of newly synthesised RNA by affinity chromatography. Eur. J Biochem. 92, 373-379 (1978).
- Cleary, M. D., Meiering, C. D., Jan, E., Guymon, R., Boothroyd, J. C. Biosynthetic labeling of RNA with uracil phosphoribosyltransferase allows cell-specific microarray analysis of mRNA synthesis and decay. Nature Biotechnology. 23, 232-237 (2005).
- Kenzelmann, M., Maertens, S., et al. Microarray analysis of newly synthesized RNA in cells and animals. Proc. Natl. Acad. Sci. U.S.A. 104, 6164-6169 (2007).
- Schwanhäusser, B., Busse, D., et al. Global quantification of mammalian gene expression control. Nature. 473, 337-342 (2011).
- Rabani, M., Levin, J. Z., et al. Metabolic labeling of RNA uncovers principles of RNA production and degradation dynamics in mammalian cells. Nat. Biotechnol. , (2011).
- Miller, M. R., Robinson, K. J., Cleary, M. D., Doe, C. Q. TU-tagging: cell type-specific RNA isolation from intact complex tissues. Nat. Methods. 6, 439-441 (2009).
- Miller, C., Schwalb, B., et al. Dynamic transcriptome analysis measures rates of mRNA synthesis and decay in yeast. Mol. Syst. Biol. 7, 458 (2011).
- Weintz, G., Olsen, J. V., et al. The phosphoproteome of toll-like receptor-activated macrophages. Mol. Syst. Biol. 6, 371 (2010).
- Lipsett, M. N. The isolation of 4-thiouridylic acid from the soluble ribonucleic acid of Escherichia coli. Journal of Biological Chemistry. 240, 3975-3978 (1965).
- Marcinowski, L., Liedschreiber, M., et al. Real-time Transcriptional Profiling of Cellular and Viral Gene Expression during Lytic Cytomegalovirus Infection. PLoS Pathog. 8, e1002908 (2012).
- Chomczynski, P., Mackey, K. Short technical reports. Modification of the TRI reagent procedure for isolation of RNA from polysaccharide- and proteoglycan-rich sources. Biotechniques. 19, 942-945 (1995).
- Friedel, C. C., Dölken, L. Metabolic tagging and purification of nascent RNA: implications for transcriptomics. Mol. Biosyst. 5, 1271-1278 (2009).
- Friedel, C. C., Kaufmann, S., Dölken, L., Zimmer, R. HALO - A Java framework for precise transcript half-life determination. Bioinformatics. , (2010).
