


Abstract
Sarcoidosis is a systemic inflammatory disease of unknown aetiology, influenced by genetic and environmental factors. However, the loci so far identified for sarcoidosis explain only a part of its assumed heritability.
To identify further susceptibility loci, we performed a genome-wide association analysis using the Affymetrix 6.0 Human GeneChip followed by validation and replication stages.
After quality control, 637 cases, 1233 controls and 677 619 single-nucleotide polymorphisms (SNPs) were available for an initial screening. 99 SNPs were selected for validation in an independent study panel (1664 patients, 2932 controls). SNP rs1050045 was significantly associated with sarcoidosis (corrected p=0.0215) in the validation panel and yielded a p-value of 9.22×10⁻⁸ (OR 1.24) in the meta-analysis of the screening and validation stage. A meta-analysis of three populations from Germany, the Czech Republic and Sweden confirmed this finding (p=0.024; OR 1.14). Fine-mapping and mRNA expression studies pointed to osteosarcoma amplified 9 (OS9) as the most likely candidate for the underlying risk factor.
The OS9 protein plays an important role in endoplasmic reticulum-associated protein degradation and acts during Toll-like receptor induced activation of myeloid cells. Expression analyses of OS9 mRNA provide evidence for a functional mechanism underlying the detected association signal.
- Chronic lung disease
- gene polymorphism
- meta-analysis
- risk factors
- sarcoidosis and other granulomatosis
- susceptibility
Sarcoidosis (MIM: 181000) is a systemic inflammatory disease of unknown aetiology that is characterised by non-caseating epithelioid cell granulomas. Although any organ system can be affected, granulomas are most frequently found in the lung and the lymph nodes. The pathogenesis is characterised by high activity of macrophages and CD4+ helper T-cells after exposure to an as yet elusive antigen under the regulatory influence of cytokines produced by local mononuclear phagocytes, T-cells, dendritic cells and fibroblasts [1, 2]. According to the course of the disease, patients can be classified as being affected by acute or chronic sarcoidosis [3]. In brief, acute sarcoidosis is characterised by sudden complaints and recovery within 2 years. It includes Löfgren syndrome, which is characterised by erythema nodosum, bilateral hilar lymphadenopathy and polyarthritis. By contrast, chronic sarcoidosis patients exhibit subtly intensifying early symptoms, followed by enduring disease activity for 2 years or longer.
Sarcoidosis is a rare disease with a prevalence rate of about 40 per 100 000 inhabitants in Germany, and mainly affects young adults (20–40 years) and is more prevalent among females [4]. It is thought to be triggered by a complex combination of environmental and genetic factors with an estimated heritability of 66% [5]. The genetic underpinning of the disease is supported by the identification of a number of risk genes, for example: BTNL2 [6–8], ANXA11 [9, 10], TNF-α [11] and several HLA-loci [12]. Several candidates await further support e.g. Rab23 [13] and the chemokine receptors CCR2, CCR5 and IL23R [14]. With the present study, we aimed to identify of further susceptibility loci for sarcoidosis using the Affymetrix SNP array 6.0, which comprises nearly one million single-nucleotide polymorphisms (SNPs) and thus yields a significantly higher, and also partially different, coverage than the previously published genome-wide association studies (GWAS) [9, 13]. Since we expected rather small effect sizes and, therefore, no results of genome-wide significance in the initial genome-wide screening, we included an independent validation step and a replication step following a multi-stage design (online supplementary figure E1).
MATERIALS AND METHODS
Patient and control subjects
Sarcoidosis patients were classified as having chronic or acute sarcoidosis, as previously described [9, 15, 16], according to the course and presentation of the disease based on all available information (questionnaires completed by patients and physicians, hospital records and interview information). Briefly, subtly intensifying early symptoms followed by enduring disease activity for 2 years or longer defined the chronic sarcoidosis sample (referred to as “chronic”). Patients in the acute sarcoidosis sample (“acute”) suffered from sudden complaints and recovered within 2 years. Only patients who could be unequivocally categorised as acute or chronic were recruited to those subphenotypes. Thus, for the categorisation into acute and chronic, a disease course of at least 2 years was analysed. All patients showed evidence of disease involvement in the thorax.
Before quality control, the screening panel A comprised 640 patients, including 191 acute and 401 chronic patients, and 1256 control subjects. Panel A almost completely overlapped with the panel (also termed panel A) that was used in a previous sarcoidosis association screen using the Affymetrix 5.0 GeneChip [9]. Moreover, parts of the screening panel A had already been used in the former association analyses [6, 17]. For validation, 1664 sarcoidosis patients, including 563 individuals with acute and 947 individuals with chronic sarcoidosis, and 2932 healthy individuals were available before quality control, together forming panel B. Replication panel C-I comprised 303 German sarcoidosis patients and 281 controls and had no overlap with any other panel. Information on the subphenotype status was only available for a limited number of these patients (acute: n=40; chronic: n=61). Replication panel C-II consisted of 267 sarcoidosis cases and 330 controls from the Czech Republic and substantially overlapped with a sample described elsewhere [10]. No subphenotype information was available for this sample. The Swedish samples (replication panel C-III) comprised 1066 cases recruited at the outpatient clinic at the Pulmonary Division of the Karolinska University Hospital, Solna, Sweden, of which 333 patients were diagnosed with Löfgren syndrome, an acute form of sarcoidosis. For the remaining cases Löfgren syndrome was either excluded or no subphenotype information was available. The 940 Swedish controls were contributed by the Swedish Epidemiological Investigation of Rheumatoid Arthritis (EIRA) study [18]. Fine-mapping (panel D) was carried out in 1829 German sarcoidosis patients, comprising all patients from panel B and parts of panel A, including 597 acutely and 1055 chronically affected patients, and in 1465 German controls from panel B. Among the patients with the acute course of sarcoidosis a total of 123 individuals showed the classical symptoms of Löfgren syndrome. Recruitment and diagnosis of patients in panels A, B, C-I and D were accomplished as described above. All study participants in panels A, B, C-I and D were of German origin. For details on diagnosis and recruitment, see the online supplementary material methods section. The 45 sarcoidosis patients and 45 control individuals (panel E) used for sequencing of the OS9 gene region were selected from fine-mapping panel D in order to enrich carriers of the rs1050045 risk allele, since these individuals have a higher chance of carrying the causative variant(s), which are assumed to be in linkage disequilibrium (LD) with rs1050045.
Genotyping and quality control
Genotyping of panels A and B was performed using the Affymetrix Genome-Wide Human SNP Array 6.0 (Affymetrix, Santa Clara, CA, USA) and SNPlex™ technology (Applied Biosystems, Foster City, CA, USA), respectively. Additional genotyping of panels C-I, C-II, C-III, D and E was performed using Taqman technology (Applied Biosystems). Conservative and established quality filters were used following common practice [19]; for details of the quality control and genotyping of each panel see the online supplementary material. Briefly, all individuals had to have <10% missing genotypes. Samples that showed evidence for cryptic relatedness (identical by state value >0.8; see online supplementary figure E2) to other samples were removed from the dataset. For each panel (screening, validation and replication), SNPs were checked for missing genotypes (threshold for exclusion: <95% in either patients or control subjects), minor allele frequency (<2% in patients or control subjects), and deviation from Hardy–Weinberg equilibrium in the control sample (p≤0.01), which led to the exclusion of 257 349 markers (27.5%) from the GWAS dataset. Any SNP selected for validation underwent visual inspection of its cluster plot (see online supplementary figure E3 for the cluster plot of lead SNP rs1050045).
SNP selection and statistical analysis
Those markers that ranked top with their p-value in the genome-wide association analysis of panel A and for which at least one additional correlated SNP (r2>0.5 with p<10−3) was present were selected for validation. Markers from the HLA region (6p21.1–6p21.3) and from the ANXA11 gene region (chr10, position 81 850–82 000 kb) were not included in the validation stage because a strong disease association of those loci had already been established based on the same study population [6, 9]. Statistical analysis of genotype data was carried out using PLINK v.1.06 [20] unless stated otherwise. In the entire experiment, single-marker allele-based association analysis was performed using a Chi-squared test (1 degree of freedom). Visualisation of LD was carried out with GOLD [21]. Logistic regression, backward model selection using AIC [22] and haplotype analysis using the haplo.stats package [23] were conducted in R v2.10.1 and v2.15.0 [24]. HapMap tagging SNPs were selected for fine-mapping using Haploview [25]. The population attributable risk (PAR) for the GWAS lead SNP was calculated using the following formula: PAR=(f*(rr-1))/(f*(rr-1)+1), where f denotes the allele frequency in the risk population and rr equals the allelic relative risk, as estimated by the corresponding odds ratio [26]. For a detailed description see the online supplementary material methods section. Correction for population stratification in panel A and B was conducted using an estimated genomic inflation factor of 1.149. Meta-analysis of panel A and B was conducted using the inverse normal method [27], while meta-analysis of replication panels C-I, -II and -III was carried out using the fixed-effect model implemented in PLINK v.1.07.
Interaction analysis was performed using the epistasis option in PLINK v.1.07. A significant result in this test indicates a deviation of the combined effects of the associated SNPs from the multiplicative model.
Additionally, the association analysis of markers was adjusted for the effects of previously reported markers using logistic regression models (see online supplementary table E1). All markers were considered under a genotypic risk model. Statistical backward model selection was performed using the step function in R and was based on the default Akaike information criterion (AIC). Only samples that had no missing genotypes at any of the considered markers were included in this analysis (637 cases, 1233 controls). Significance was assessed by a likelihood ratio test.
Sanger sequencing
The exonic, exon-flanking and regulatory regions of OS9 were sequenced using standard Sanger sequencing technology on a ABI PRISM 3700 DNA analyser (Applied Biosystems). Primers were designed using Primer3 [28]. Primer sequences are given in the online supplementary table E2.
Analysis of tissue-specific expression by PCR
For investigation of tissue-specific expression patterns of the candidate genes we used a commercially available tissue and immune cell panel from Clontech (Palo Alto, CA, USA) and a semi-quantitative PCR. Expressions were normalised on GAPDH expression. For the respective primer sequences see online supplementary table E3.
BAL preparation, mRNA isolation and qRT-PCR
Bronchoalveolar lavage (BAL) cell samples of BAL panel I were matched by their portion of alveolar macrophages (see online supplementary material for details). Total RNA was isolated from snap-frozen BAL cells using a commercial kit (RNeasy, Qiagen, Hilden, Germany) and cDNA was synthesised using the Advantage RT-for-PCR kit (Clontech Laboratories) according to the manufacturer's protocol. Sequences of target-specific primers for qRT-PCR are given in the online supplementary table E3. Transcript amounts were normalised to GAPDH mRNA levels. Relative expression levels of the target genes were tested for significant differences between sarcoidosis patients and unaffected individuals (n=4 each) using a non-parametric Mann–Whitney U-test as implemented in the Graphpad statistical software (Graphpad, Inc., La Jolla, CA, USA).
A second BAL series of BAL-samples was obtained from 46 patients with active sarcoidosis and eight controls (BAL panel II). BAL cell smears were dried and stained using May–Grünwald–Gimsa staining. Cell differentials were determined by counting at least 200 cells. For analysis of human leucocyte antigen-DR (HLA-DR) expression on lymphocytes cells were fixed on poly-l-lysine coated slides, incubated with monoclonal antibodies directed against HLA-DR at the concentrations suggested by the supplier and developed with a peroxidase–antiperoxidase technique. The sequences of the primers used for qRT-PCR are given in online supplementary table E4. The primers do not distinguish between the three known isoforms of OS9 mRNA. Cycle numbers of GAPDH and OS9 were equal (35 cycles). A threshold cycle value (Ct) was calculated and used to calculate the relative expression (rE) level of mRNA for each sample by using the following formula: rE=2(CtGAPDH-Ct-Target) ×10 000. The relative expression is given as a dimension-free ratio. Statistical analysis of this cohort was performed using StatView (SAS Institute, Cary, NC, USA) using a Mann–Whitney U-test. DNA was extracted from blood, and genotyping was performed as described above. For a description of the BAL samples and further details see the online supplementary material methods section.
Immunohistochemistry
Sections of lung tissue fixed with HEPES–glutamic acid buffer-mediated organic solvent protection effect from anonymised normal controls (n=4) and active sarcoidosis (n=8) were stained with the rabbit polyclonal OS9 antibody (NB100-519B; Novus biotechnicals, Littleton, CO, USA) using standard protocols at a primary antibody dilution of 1:100 [29]. Omitting the primary antibody and using irrelevant primary antibodies served as the negative and positive control, respectively. Photomicrographs were taken on a Zeiss Axio Imager Z1 (Zeiss, Oberkochen, Germany).
RESULTS
GWAS analysis
After applying conservative and established quality filters to the data set, 1870 samples (panel A: 637 cases, 1233 controls) and 677 619 SNPs were included in the initial genome-wide screening. The assessed population heterogeneity was moderate in panel A, with a genomic inflation factor of λGC=1.15 based on a median Chi-squared distribution [30], where λGC=1.0 corresponds to no inflation. The QQ-plot and association signals for known sarcoidosis risk loci are given in the online supplementary material and supplementary figure E4.
In addition to the SNPs carried forward to the validation stage (see below), multiple SNPs in the BTNL2 gene (rs2076533, rs2076530, rs9268480, rs3806156) and in several HLA loci (rs7194, rs7195, rs3177928, HLA-DRA; rs9277550, rs1431403, rs2856816 HLA-DPB1; rs2071475, rs2071473, HLA-DOB) on chromosome 6p21.3 (online supplementary figure E5), a region that is characterised by patterns of high LD, were found in the GWAS to be significantly associated with sarcoidosis. The respective SNPs were strongly associated, with nominal p-values between 1.01×10⁻¹⁵ (rs2076533) and 9.17×10⁻⁵ (rs2856816).
Validation of lead variants
99 SNPs that passed the pre-defined selection criteria were genotyped in an independent validation sample (panel B). After quality control, 2770 German controls and 1572 German sarcoidosis patients, including 894 chronic and 530 acute patients, comprising 99 individuals with Löfgren syndrome, were included in the analysis. 21 markers showed a nominally significant association with sarcoidosis in the validation stage (table 1). One variant, rs1050045, located at 12q13.3–q14.1, was associated with sarcoidosis with an uncorrected p-value of 7.38×10⁻⁵. Since screening panel A and validation panel B originate from the same German population, we assumed an inflation of the test statistics due to population stratification of λ=1.15 for the combined panel, as estimated for panel A. The result for rs1050045 remained significant after correction for this effect and after Bonferroni correction for multiple testing (corrected p-value (pcorr)=99×2.18×10−4=0.0215; OR 1.20, 95% CI 1.10–1.31). The SNP conferred a PAR of 8%–12% (based on the frequencies obtained in the validation and screening panel, respectively). In a meta-analysis of panels A and B it was associated with sarcoidosis with a pcorr of 9.22×10⁻⁸ (OR 1.24) [31]. No significant SNP–SNP interactions of this SNP with known susceptibility variants for sarcoidosis in the ANXA11, BTNL2, Rab23 and the IL23R loci were observed in panel A (data not shown).
In order to determine whether rs1050045 exerts a statistically independent influence on sarcoidosis from previously reported susceptibility variants in BTNL2, ANXA11, Rab23, IL23R and HLA, we performed a backward model selection in a logistic regression model based on AIC. In addition to marker rs1050045, another 21 markers entered the model before the selection, namely: rs6664119 (IL23R); rs644045 (chr6 p21.33); rs9268402, rs9391858, rs2076533, rs2076530 (all BTNL2); rs3177928, rs7194, rs7195 (all HLA-DRA); rs502771 (HLA-DRB1/5); rs4530903 (HLA-DRB1/DQA1 region); rs9275371, rs9275418, rs2856717, rs9275522, rs9275523 (all HLA-DQ region); rs9277550, rs3117242, rs3128923 (all HLA-DPB); rs3957366 (BEND6); and rs1953600 (ANXA11). All markers were considered under a genotypic risk model. The final model contained, in addition to rs1050045, markers rs6664119, rs644045, rs2076533, rs3177928, rs502771, rs9275371, rs9275418, rs2856717, rs3128923, rs3957366, rs1953600. After adjustment for the other 11 markers, rs1050045 was still significantly associated with sarcoidosis (p=6.2×10⁻⁴).
Subphenotype-specific analysis revealed a stronger association of rs1050045 with acute sarcoidosis after correction for population stratification (corrected pacute=6.75×10⁻⁴; OR 1.30, 95% CI 1.14–1.49) compared to the chronic subphenotype (corrected pchronic=0.021; OR 1.16, 95% CI 1.04–1.30). Patients with Löfgren syndrome showed an even stronger effect (corrected pLöfgren=0.044; OR 1.41, 95% CI 1.05–1.88). Genotypes were verified using TaqMan SNP genotyping as an independent technology (98.74% genotype concordance). Risk allele C had a frequency of 42% in controls, 46% in cases, 48% in patients with acute sarcoidosis and 50% in cases with Löfgren syndrome. Detailed results including genotyping counts for all SNPs under study in the validation stage are presented in the online supplementary table E5.
Replication in independent samples from different European populations
In order to replicate the detected association of lead SNP rs1050045 with sarcoidosis, we performed a meta-analysis of this SNP in independent case-control samples from Germany, the Czech Republic and Sweden (panels C-I, C-II and C-III, respectively). The variant showed significant association with sarcoidosis in a meta-analysis of these three sample sets (p=0.023; OR 1.14). Risk allele frequencies (and corresponding odds ratios) varied between the populations, ranging from 41.9% in controls versus 43.1% in cases (OR 1.05, 95% CI 0.83–1.32) in panel C-I through 37.7% versus 40.1% (OR 1.11, 95% CI 0.97–1.26) in panel C-III up to 42.7% versus 48.6% (OR 1.27, 95% CI 1.00–1.61) in panel C-II. A subphenotype analysis of panel C-I was not promising due to its small sample size (power <15%), and no subphenotype information at all was available for panel C-II. In panel C-III though, we found a significant association with Löfgren syndrome, an acute subform of sarcoidosis (p=0.015; OR 1.26, 95% CI 1.05–1.52).
Fine-mapping around rs1050045 (chromosome 12q13.3–q14.1)
In addition to the lead SNP rs1050045, we selected 57 tagging SNPs from HapMap CEU for fine-mapping of ∼500 kb of the 12q13.3–q14.1 region around rs1050045 in the fine-mapping panel D. After quality control, genotypes of 53 SNPs from 1753 cases, including 570 acute and 1016 chronically affected patients, and 1429 control individuals were available for the analysis. 22 markers yielded a nominal p-value <0.05 in the association analysis. Again, the strongest association signal was observed with the lead SNP rs1050045 (p=1.10×10⁻⁴; OR 1.22, 95% CI 1.10-1.35). Complete analysis results are shown in the online supplementary table E6. Figure 1 gives an overview of the association signals, the genes, recombination rates and LD structure at the 12q13.3–q14.1 locus, showing that the strength of the association signal decreases gradually with increasing genetic and physical distance from the lead SNP rs1050045, which is located in the 3′-UTR of the osteosarcoma amplified 9 (OS9) gene. In panel D, this marker was in strong linkage disequilibrium with rs11172300 (r2=0.96 in controls), which is located 12 kb upstream of OS9 and is also significantly associated with sarcoidosis (p=1.5×10⁻³; OR 1.18, 95% CI 1.06–1.30).

From preceding page. Regional plot of the validated sarcoidosis association at 12q13.3–q14.1. a) Nominal-log10 p-values obtained from an allelic Chi-squared test with one degree of freedom in the fine-mapping in panel D. 53 tagging single nucleotide polymorphisms (SNPs) were genotyped across the 500-kb region surrounding the GWAS lead SNP rs1050045 (highlighted by orange vertical line).The black dashed line corresponds to a threshold of 0.05. b) Plots of the recombination intensity in centimorgans per megabase and the cumulative genetic distance in centimorgans from the lead SNP according to HapMap (CEU trios, phase I + II). c) Position and intron-exon structure of transcripts according to the National Center for Biotechnology Information (NCBI) Reference Sequence (RefSeq) collection. d) rPairwise linkage disequilibrium values (r2) in control individuals. Positions are given as NCBI build 36 coordinates.
Five SNPs, namely rs1689585, rs1628552, rs4760168, rs7979246 and rs10783844, located between rs1050045 and rs11172300 in the OS9 gene region, were in strong LD with each other (r2=0.91–0.99), but neither with the lead SNP rs1050045 nor with rs11172300. One of these five SNPs, namely rs1689585, showed a nominally significant association with the general sarcoidosis phenotype (p=4.0×10⁻²; OR 0.90, 95% CI 0.81–1.00) and a remarkably strong association in the acute subsample (pacute=5.0×10⁻⁴; OR 0.77, 95% CI 0.66–0.89). The remaining four SNPs were significantly associated with acute sarcoidosis only (see online supplementary figure E6 and table E6). Haplotype analysis of these seven SNPs (rs1050045, rs11172300, rs1689585, rs1628552, rs4760168, rs7979246 and rs10783844) revealed a significant difference in the haplotype frequency distribution between sarcoidosis patients and controls (p=9.1×10⁻³) and in patients with the acute subphenotype compared to controls (p=4.7×10⁻³). See online supplementary table E7 for complete results. However, backward model selection for a logistic regression model using AIC gave inconclusive results as to whether rs1050045 represents the only source for phenotypic association in the region (data not shown). Prediction of the functional consequences using the National Institute of Environmental Health Sciences (NIEHS) SNPinfo web server [32] revealed a possible influence of these seven associated SNPs, and SNPs that are in strong LD (r2>0.9) with them, on transcription factor binding sites as well as miRNA binding sites. See online supplementary table E8 for complete results.
Sequencing of OS9 coding regions
In order to verify existing variants and to identify novel mutations at the associated locus, we sequenced the OS9 regulatory and exonic regions of 45 sarcoidosis patients and 45 control individuals (panel E) using Sanger sequencing technology. We detected seven known and two novel SNPs, including a non-synonymous SNP in exon 2, named OS9-SNP1 (table 2 and online supplementary figure E7). Sequencing of exon 10 failed due to technical reasons. Two of the nine detected SNPs (OS9-SNP1 and rs74368191) were confirmed by genotyping and investigated in the fine-mapping panel D, both using Taqman technology. OS9-SNP1 turned out to be an extremely rare variant, with one control individual being the only heterozygous carrier. rs74368191, which was detected only in cases in the sequencing panel E, was slightly more frequent in the cases (minor allele frequency (MAF)=0.014) than in controls (MAF=0.011) in panel D, but showed a weaker effect than the lead SNP rs1050045 (OR=1.22; p>0.05).
Expression analysis of candidate genes in chromosome 12q13.3–q14.1 region
Based on the results of the fine-mapping experiment, we selected eight genes located near to the lead SNP as candidates for the putative susceptibility gene driving the association signal (figure 1). We hypothesised that the causative variant(s) might influence susceptibility to sarcoidosis by changing the expression levels of one or several of these genes, namely OS9, ArfGAP with GTPase domain, ankyrin repeat and PH domain 2 (AGAP2), tetraspanin 31 (TSPAN31), cyclin-dependent kinase 4 (CDK4), membrane-associated ring finger (C3HC4) 9 (MARCH9), cytochrome P450, family 27, subfamily B, polypeptide 1 (CYP27B1), methyltransferase like 1 (METTL1) and family with sequence similarity 119, member B (FAM119B). To prove this hypothesis, we first assessed the expression of the eight transcripts in healthy tissue and in immune cell types that are relevant to the pathogenesis of sarcoidosis by a semi-quantitative PCR. All transcripts showed moderate to high expression in healthy lung tissue. Several transcripts, namely OS9, AGAP2, TSPAN31 and MARCH9, were down-regulated in activated mononuclear cells, CD4+ and CD8+ T-cells compared to their resting counterparts (online supplementary figure E8).
We further hypothesised that the causative variant(s) might confer the increased risk to sarcoidosis by changing the expression levels of one or several of these genes. We therefore analysed the expression levels of the candidate genes in BAL cells from sarcoidosis patients and unaffected persons (BAL panel I, n=4 per group) by performing qRT-PCR on cDNA. Expression of all eight candidate genes was detectable in BAL cells, while expression of OS9, TSPAN31 and FAM119B was significantly increased in sarcoidosis BAL samples compared to controls (each with a nominal p=0.029, fig. 2).
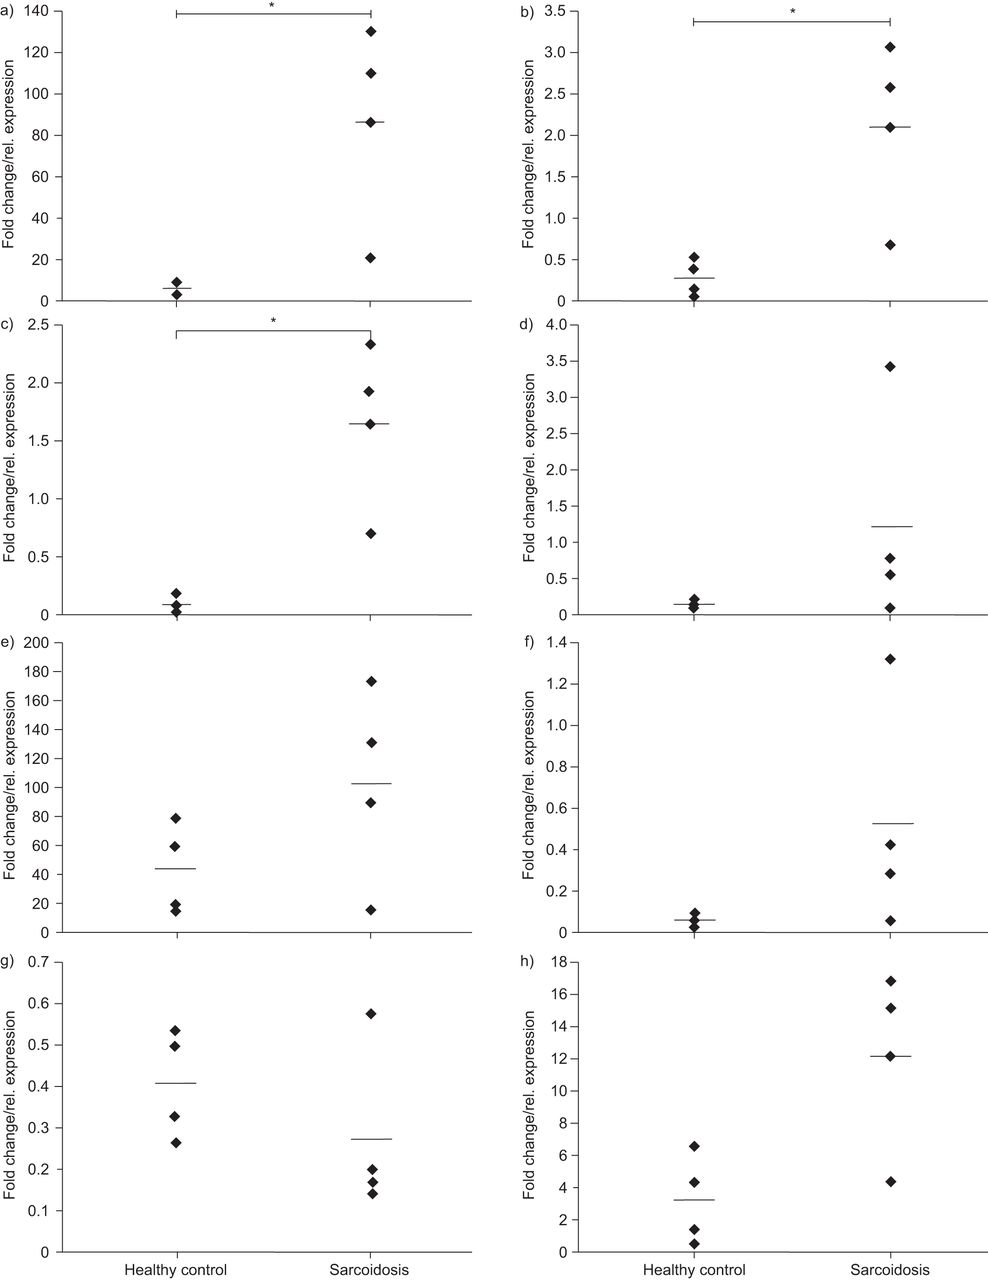
From preceding page. Expression of the eight candidate genes in bronchoalveolar lavages (BALs) from sarcoidosis patients (n=4) compared to unaffected individuals (n=4, BAL panel I). Transcription levels of a) OS9, b) TSPAN31, c) FAM119B, d) AGAP2, e) CDK4, f) MARCH9, g) CYP27B1 and h) METTL1 were normalised on GAPDH mRNA levels. *: significance at a five percent level based on a non-parametric Mann–Whitney U-test.
Allele-specific expression of OS9 and immunohistochemistry
From the results of the fine-mapping experiment and the expression studies, OS9 seemed to be the most promising candidate gene in the associated region. We therefore investigated OS9 expression in the independent BAL panel II. Here, expression of OS9 mRNA was detected in eight of eight healthy controls but only in 38 of 47 sarcoidosis patients using qRT-PCR. A more detailed analysis showed that in patients expressing OS9, termed OS9-positive patients from now on, OS9 expression was significantly higher compared to controls (3774±2794 (n=38) versus 1587±857 (n=8), online supplementary figure E9; p=7.0×10⁻³). Since the BAL of sarcoidosis patients is characterised by a low proportion of alveolar macrophages [33], it is interesting that BAL cell composition differed between OS9-positive patients and patients not expressing OS9 (termed OS9-negative patients) and controls with regards to the percentage of alveolar macrophages (online supplementary figure E10). The two groups also differed significantly with respect to the percentage of HLA-DR+ T-cells, with the highest percentage in OS9-negative cases (online supplementary figure E11). Stratification of the BAL samples from sarcoidosis patients according to the genotype at the lead SNP rs1050045 revealed a significant negative correlation of OS9 mRNA expression level with the CC genotype (AA: 2879; AC: 3078; CC: 824; CC versus AA p=0.019; CC versus AC p=0.016; fig. 3).

Allele-specific expression of OS9. Transcript levels of OS9 were measured using quantitative RT-PCR in the patients of bronchoalveolar lavage panel II (n=46). A change of mRNA expression pattern was significantly associated with the homozygote risk genotype of rs1050045 “CC” (p=0.016).
Next, we verified the in situ localisation of OS9 protein expression by immunohistochemistry in lung biopsies of a third cohort (n=4 normal controls; n=8 active sarcoidosis patients). Ubiquitous OS9 protein expression could be observed with a marked perinuclear and granular cytoplasmic staining pattern concurrent with the reported endoplasmatic reticulum (ER) localisation of OS9. Strong immunoreactivity could be observed in alveolar macrophages and lymphocytic cells in both diseased samples and normal controls. The granuloma structures in the sarcoidosis biopsies also stained positive for OS9 (fig. 4).

OS9 immunohistochemistry staining. Staining for OS9 in lung biopsy material a) respiratory epithelium and b) submucosa of a healthy subject. Note strong OS9 staining (brown) of monocytic and lymphocytic cells. c) and d) Specimen from a sarcoidosis patient demonstrating positive staining of alveolar macrophages. e) Diffuse granular staining of a granulomatous structure in a sarcoidosis specimen. f) Negative control of an adjacent section from d). Pictures show representative results from n=4 healthy subjects and n=8 sarcoidosis patients. Nuclei were counterstained with haematoxylin.
DISCUSSION
We performed a genome-wide association analysis of 677 619 SNPs in 637 German sarcoidosis cases and 1233 controls and identified a new sarcoidosis susceptibility locus at chromosome 12q13.3–q14.1, which was validated in an independent German case–control population. The association of lead SNP rs1050045 was replicated by a meta-analysis of three independent cohorts from Germany, the Czech Republic and Sweden (panel C-I, C-II and C-III). Subphenotype-specific analysis revealed a stronger association of this SNP with the acute subform of sarcoidosis than with the overall sarcoidosis phenotype.
The locus was overlooked in the previous genome-wide studies due to a lack of coverage of the region and different analysis strategies despite use of almost the same primary study population [9, 13].
The region 12q13.3–q14.1 has been reported before to be associated with rheumatoid arthritis [34–36], with SNP rs1678542 showing a similar effect as for sarcoidosis (OR 0.88–0.94), as well as with type I diabetes [37–39], multiple sclerosis [40] and coeliac disease [41]. It therefore represents the first genetic risk locus shared by these clinically distinct diseases. However, since the associated region harbours a number of potential risk genes and no fine-mapping was conducted for any of the mentioned diseases except sarcoidosis, no conclusion can be drawn on whether the different diseases share a single risk factor or are affected by different factors in this region.
For sarcoidosis, fine-mapping of the region and expression studies suggest OS9 as the most likely candidate for the underlying risk gene. Sequencing of the exonic and exon-flanking regions of OS9 revealed two novel SNPs, but no obvious candidate for the causative variant(s). Besides rs1050045, which yielded the strongest association of all investigated SNPs in the fine-mapping, only one additional SNP in the 3′-UTR of OS9 was found. Since 16 SNPs are annotated in this region, according to dbSNP build 132, 14 of which were not detected, this result dramatically reduces the number of potentially regulatory 3′-UTR SNPs and emphasises the potential functional relevance of rs1050045.
In silico functional analysis of the most strongly associated SNPs in the OS9 region suggested an influence on gene expression via altering transcription factor as well as miRNA binding and on splicing events. SNP rs799265 which is in perfect LD with rs1050045 (r2=1 according to HapMap release 27) showed high regulatory potential as well as maximal conservation over 17 vertebrate species making this SNP an interesting candidate for further functional analysis. Analysis of OS9 mRNA from BAL panel I, which contained only samples with a high proportion of macrophages, found elevated OS9 expression levels in sarcoidosis patients compared to controls. This finding was confirmed in a subgroup of patients from BAL panel II, which was characterised by a high percentage of macrophages. In addition, we found that absence of OS9 mRNA co-occurs with a reduced ratio of CD4+/CD8+ T-cells. Although not significant, this finding may indicate that OS9 is involved in the active state of sarcoidosis, which is characterised by a high CD4+/CD8+ ratio [33], while a lack of OS9 mRNA may be associated with the chronic and less active form of sarcoidosis. Preliminary investigation of a potential allele-specific expression of OS9 in BAL (panel II) showed a significant reduction of OS9 expression in homozygote carriers of the rs1050045 risk allele. Possible mechanistic explanations for this differential expression include a shorter half-life of the OS9 mRNA or a different binding behaviour of the microRNA (miRNA)-145. This regulatory miRNA binds to the 3′-UTR of OS9. It is expressed in human trachea and lung tissue according to the UCSC genome browser [42] and has been shown to be involved in airway inflammation in mice [43]. Results from a recent publication showed a 2.8-fold higher expression of this miRNA in full blood of sarcoidosis patients compared to healthy controls (p=3.9×10⁻³) [44]. Further functional experiments are now warranted to elucidate the functional consequences of reasonable candidates for the causative variants, e.g. rs1050045 or rs799265.
The putative risk gene OS9 consists of 15 exons and encodes four different splice variants [45, 46], all of which contain a mannose 6-phosphate receptor homology domain [47]. The OS9 protein plays an important role in the ER-associated degradation of misfolded or unassembled proteins [48, 49]. This may be of importance, since only peptides derived from proteins that are common in the human body were found in the groove of HLA-DR of alveolar macrophages from sarcoidosis patients in a recent study [50]. Moreover, it was demonstrated that these molecules induce an antigenic T-cell response [51]. OS9 may therefore act as an autoimmune component in the immunopathogenesis of sarcoidosis. In addition, it has recently been shown that OS9 interacts with the cytoplasmic tail of the dendritic cell-specific transmembrane protein during toll-like receptor-induced maturation of dendritic cells suggesting a role for OS9 in myeloid differentiation and cell fusion [52]. Dendritic cells have been discussed as important mediators of sarcoidosis immunology [53] and have been widely investigated with regards to various aspects of sarcoidosis [53–56].
Based on our results, we cannot, however, exclude that functional changes in genes at 12q13.3–q14.1 other than OS9 influence susceptibility to sarcoidosis. From a clinical point of view, CYP27B1 represents a further plausible candidate for sarcoidosis susceptibility as discussed similarly for multiple sclerosis [40]. This gene encodes a member of the cytochrome P450 superfamily. The enzyme activates vitamin D3, which has a well-established general immunoregulatory function [57, 58] and also plays a role in lung immunity and in sarcoidosis [59, 60]. Moreover, this gene has very recently been reported to be differentially expressed in sarcoidosis patients with a progressive-fibrotic, compared to a self-limiting, course of the disease [61]. Since the entire 12q13.3–q14.1 locus showed a subphenotype-specific genetic association pattern in our study, it is conceivable that specific genetic variants in the associated region may influence the regulation of CYP27B1 expression restricted to certain stages or subtypes of the disease. To date no obvious functional implication of the remaining gene products, namely, AGAP2, TSPAN31, CDK4, MARCH9, METTL1 and FAM119B, with sarcoidosis pathogenesis can be drawn from the literature.
In summary, this is the first report of an association of chromosomal region 12q13.3–q14.1 with sarcoidosis. Fine-mapping of the region and preliminary expression studies suggest OS9 as the most likely candidate for the underlying susceptibility gene and may support the notion of an autoimmune reaction in the immunopathogenesis of sarcoidosis. Based on the data presented here, more detailed studies on the reported genetic association and OS9 function in the context of sarcoidosis are now needed, in order to define the causative variant(s) and the molecular mechanisms underlying our observations. Moreover, similar studies need to be done in patients with a different ethnic background to determine whether ancestry is linked with the new sarcoidosis susceptibility locus.
Acknowledgments
The authors wish to thank all the patients, families and physicians for their cooperation. The support of the German Sarcoidosis Patients Organisation (Deutsche Sarkoidose-Vereinigung e.V.), the PopGen biobank and of the contributing pulmonologists is gratefully acknowledged. We gratefully acknowledge technical assistance from the staff of the Institute of Clinical Molecular Biology (Kiel, Germany). Leonid Padyukov (Rheumatology Unit, Dept of Medicine, Karolinska Institute, Stockholm, Sweden), contributed with selection of controls for the Swedish cohort and the authors are grateful to members of the Swedish EIRA study for collection of control samples.
The authors’ affiliations are as follows. S. Hofmann: Institute of Clinical Molecular Biology, Christian-Albrechts University, Kiel, Germany; A. Fischer: Institute of Clinical Molecular Biology, Christian-Albrechts University, Kiel, Germany; M. Nothnagel: Institute of Medical Informatics and Statistics, Christian-Albrechts University; Kiel, Germany; G. Jacobs: Institute of Clinical Molecular Biology, Christian-Albrechts University, Kiel and Popgen Biobank, University Hospital Schleswig-Holstein; Kiel, Germany; B. Schmid: Institute of Clinical Molecular Biology, Christian-Albrechts University, Kiel, Germany; M. Wittig: Institute of Clinical Molecular Biology, Christian-Albrechts University, Kiel, Germany; A. Franke: Institute of Clinical Molecular Biology, Christian-Albrechts University, Kiel, Germany; K.I. Gaede: Dept of Pneumology, Research Center Borstel, Borstel, Germany; M. Schürmann: Institute of Human Genetics, University of Lübeck, Lübeck, Germany; M. Petrek: Laboratory of Immunogenomics and Immunoproteomics, Faculty of Medicine and Dentistry, Palacky University, Olomouc, Czech Republic; F. Mrazek: Laboratory of Immunogenomics and Immunoproteomics, Faculty of Medicine and Dentistry, Palacky University, Olomouc, Czech Republic; S. Pabst: Medical Clinic II, Dept of Pneumology, University of Bonn, Germany; C.Grohé: Dept of Respiratory Medicine, Evangelische Lungenklinik Berlin-Buch, Germany; J. Grunewald: Respiratory Medicine Unit, Dept of Medicine, Karolinska Institutet, Stockholm, Sweden; M. Ronninger: Dept of Medicine, Rheumatology Unit, Karolinska Institute, Stockholm, Sweden; A. Eklund: Respiratory Medicine Unit, Dept of Medicine, Karolinska Institutet, Stockholm, Sweden; P. Rosenstiel: Institute of Clinical Molecular Biology, Christian-Albrechts University, Kiel, Germany; K. Höhne: Dept of Pneumology, University of Freiburg, Freiburg, Germany; G. Zissel: Dept of Pneumology, University of Freiburg, Freiburg, Germany; J. Müller-Quernheim: Dept of Pneumology, University of Freiburg, Freiburg, Germany; S. Schreiber: Institute of Clinical Molecular Biology, Christian-Albrechts University, Kiel and Popgen Biobank, University Hospital Schleswig-Holstein; Kiel and Dept of General Internal Medicine, University Hospital Schleswig-Holstein, Kiel, Germany.
Footnotes
This article has supplementary material available from www.erj.ersjournals.com
For editorial comments see page 778.
Support Statement
This work was supported by grants of the Federal Ministry for Education and Research in Germany (BMBF) through the National Genome Research Network (NGFN), by the Cluster of Excellence “Inflammation at Interfaces” and GenPhenReSa MU692/8-1, both German Research Foundation (DFG), by the Network for Diffus Parenchymal Lung Disease (GOLD.net), in part by Palacky University IGA PU LF 2010_08, by the Swedish Heart-Lung Foundation, the Swedish Medical Research Council, and through the regional agreement on medical training and clinical research (ALF) between Stockholm County Council and the Karolinska Institutet.
Statement of Interest
None declared.
- Received February 25, 2012.
- Accepted July 19, 2012.
- ©ERS 2013
REFERENCES


