Article Text

Abstract
Background: Diffusion tensor imaging (DTI) is a sensitive method for detecting white matter damage, and in cross sectional studies DTI measures correlate with age related cognitive decline. However, there are few data on whether DTI can detect age related changes over short time periods and whether such change correlates with cognitive function.
Methods: In a community sample of 84 middle-aged and elderly adults, MRI and cognitive testing were performed at baseline and after 2 years. Changes in DTI white matter histograms, white matter hyperintensity (WMH) volume and brain volume were determined. Change over time in performance on tests of executive function, working memory and information processing speed were also assessed.
Results: Significant change in all MRI measures was detected. For cognition, change was detected for working memory and this correlated with change in DTI only. In a stepwise regression, with change in working memory as the dependent variable, a DTI histogram measure explained 10.8% of the variance in working memory. Change in WMH or brain volume did not contribute to the model.
Conclusions: DTI is sensitive to age related change in white matter ultrastructure and appears useful for monitoring age related white matter change even over short time periods.
Statistics from Altmetric.com
There is increasing evidence that white matter damage plays a prominent role in age related cognitive decline. Post mortem studies show evidence of white matter damage, including loss of myelinated white matter fibres,1 age related activation of microglia2 and microglial cell inclusions believed to represent phagocytosis of myelin.3 MRI white matter hyperintensities (WMH), best seen on T2 weighted and fluid attenuated inversion recovery (FLAIR) sequences, become more common with age,4 and correlate with cognitive impairment.5 6 Correlations are strongest with those cognitive domains, such as executive function, believed to be more sensitive to changes in white matter integrity and deterioration in cortical–subcortical connectivity.7 However, correlations between WMH and cognition are only moderate and some studies have failed to find any correlation.8
Diffusion tensor imaging (DTI) is an MRI technique that may measure white matter functional integrity more directly. Even where white matter appears normal on T2 weighted or FLAIR images, DTI values have indicated reduced white matter integrity,9 suggesting that subtle damage is present even in regions outside WMH. Histopathology studies have also demonstrated the presence of white matter damage outside WMH in Alzheimer’s disease.10 Moreover, cross sectional studies in normal ageing11 and cerebral small vessel disease (SVD)12 13 have shown that DTI measures correlate more strongly with cognition (and particularly executive function) than WMH volume. In these SVD studies, WMH no longer remained independently related to cognition once DTI was entered in multivariate analysis.12 13
DTI provides quantitative measures which are suitable for incorporation into large scale clinical trials. It may provide a useful surrogate marker to evaluate the effect of therapeutic interventions on age related cognitive decline. Before adopting DTI as a surrogate marker, it is first necessary to show that changes in DTI parameters can be detected over short time periods of similar duration to those used in clinical trials. Secondly, it is necessary to show that it is more sensitive to change than other conventional MRI markers such as T2 WMH, and than repeated neuropsychological testing which is currently the usual method of assessment. Thirdly, change in DTI should correlate with change in clinical parameters, including cognition. Currently there are no published longitudinal ageing studies using this technique which can answer these questions. Therefore, we performed serial DTI imaging at baseline and at a 2 year follow-up in a community population of middle-aged and elderly individuals to determine whether changes in DTI parameters could be detected over this time period. Cognitive testing was also performed at both time points.
Methods
Participants
The population sample of 106 people (55 men, 51 women; aged 50–90 years; mean 69) was recruited via a local family practice by random sampling as part of the prospective GENIE study; this sample has been described in detail previously.14 Briefly, participants had no contraindications to MRI, and no prior psychiatric or neurological disorder, all had English as their first language. Out of this sample, 84 participants re-attended at follow-up (48 men, 36 women; mean age (range) 71 (55–91) years). Of those who did not attend follow-up, three were deceased, two declined to participate due to ill health, one had moved away and 16 chose not to provide a reason for withdrawal (an option required by our ethics approval). Of the 84 follow-ups, 82 completed all cognitive assessments and 81 attended for MRI, with two having MRI only. Five did not complete the MRI and had missing data; three had poor quality or missing baseline DTI and were therefore not included in the longitudinal analysis. In summary, longitudinal data were available for: cognition, n = 82; brain volume, n = 80; WMH, n = 79 and DTI, n = 73 (69 people completed the study without any missing variables).
Cognitive testing
Participants underwent a battery of standardised neuropsychological tests. Mean scores were calculated for executive function, working memory and information processing speed, using methods as described previously.14 Briefly, executive function comprised: the Stroop test total correct,15 letter fluency total correct, category fluency (animals and boys names) total correct and the following subtests from the Delis–Kaplan Executive Function System16: the Trails test—number–letter switching minus motor speed—and Towers Total Achievement score. Working memory comprised the digit span backwards and letter–number sequencing subtests from the Wechsler Memory Scale III.17 Information processing speed included subtest A (total completed) from the attention, memory and information processing battery,18 digit symbol number completed from the Wechsler Adult Intelligence Scale Revised19 and the time to complete the grooved pegboard with the dominant hand.20
At baseline, raw scores for each test were transformed into z scores (using means and SDs for the whole group); follow-up data were transformed into z scores using the means and SDs from baseline data. Z scores were re-coded so a high score reflected good performance. Mean scores were calculated from the z scores for each ability at baseline and follow-up.
Magnetic resonance imaging
All MRI was performed on a General Electric 1.5 T (22 mT/m) Signa scanner. Whole brain DTI (acquisition matrix = 96×96, FOV = 240 mm × 240 mm; TE = 80 ms; TR = 7 s, maximum b value = 1000 s/mm2) was acquired in two interleaved series of four repeats, each containing twenty-five 2.8 mm slices, with a gap of 2.8 mm, providing contiguous whole brain coverage. Images were acquired with no diffusion weighting (b = 0 s/mm2) and in six directions, and the negative of those six to eliminate diffusion imaging gradient cross terms. Also acquired were: FLAIR (slices = 28; thickness = 5 mm; acquisition matrix = 256 × 256, FOV = 240 mm × 240 mm; TE = 120 ms; TR = 9000 ms) and T1 weighted whole brain volume scan (slices = 96; thickness = 1.5 mm; acquisition matrix = 256 × 256 × 92, FOV = 240 mm × 240 mm; TE = 3 ms; TR = 17 ms; flip angle = 10°).
Image analysis
All data were analysed on an independent workstation (Sun Blade 1500; Sun Microsystems, Mountain View, California, USA).
Diffusion tensor imaging
The analysis derived measures of mean diffusivity (MD) and fractional anisotropy (FA), two main descriptors of white matter ultrastructural integrity. Images were realigned to remove linear eddy current distortions using automated image registration software.21 22 Diffusion tensor elements were computed at each voxel23 and diagonalised to determine eigenvalues and eigen vectors, from which MD and FA values were generated.
For baseline data, images were segmented (using the EPI-B0 (b = 0 s/mm2 images)) into grey matter, white matter and CSF concentration maps in SPM2 (http://www.fil.ion.ucl.ac.uk/spm/), incorporating a correction for image intensity non-uniformity.24 For each participant, hard segmentations of each tissue type (grey, white, CSF) were generated to include all voxels whose probability was greater than the combined probability of the remaining tissue types. Each segmentation was checked to assure accuracy. To ensure DTI histogram measurements for both time points were taken from the same brain region, follow-up EPI-B0 images were coregistered to the baseline EPI-B0 images using an affine transformation in SPM2. These realigned data were used to generate follow-up histograms using the segmentation computed from baseline data.
Diffusion tensor imaging histograms
Histograms were calculated for MD and FA maps of all brain white matter using the segmentation described above. MD histograms bin width was set to 4×10⁻⁵, between 0.0 and 0.004 (4×10⁻³). FA histograms bin width was 0.01, between 0.0 and 1.0. To correct for individual differences in brain volume, each histogram was normalised over the number of voxels in the segmented images. Histograms do not necessarily demonstrate Gaussian profiles in MD and FA data (see fig 1), so mean and SD measures may be less relevant than other descriptors of the histogram, such as median, peak height frequency or peak height intensity, skewness (ie, how asymmetric is the histogram?) and kurtosis (ie, how peaked is the histogram?) which were used in the analysis. Distributions with kurtosis of less than 0 are referred to as having negative kurtosis or being platykurtic (ie, having a flatter peak, and longer, fatter tails than the normal distribution) and those with a kurtosis of greater than 0 are referred to as having positive kurtosis or being leptokurtic (ie, distributions with narrower, well defined peaks and fatter, shorter tails than the normal distribution). It is also helpful to consider the histogram parameters in terms of their difference in symmetry from the normal distribution, termed skewness. Here 0 indicates a symmetrical distribution whereas a distribution with larger tails to the left or right is referred to as possessing negative or positive skewness, respectively. Furthermore, a greater skewness magnitude indicates greater asymmetry of the histogram distribution. Figure 1 clearly shows the MD distribution to be positively skewed and leptokurtic whereas the FA distribution is positively skewed and less leptokurtic than the MD distribution. Furthermore, there is an interaction between the measured histogram parameters—for example, the MD distribution, which is highly leptokurtic has a greater peak height frequency than the FA distribution, while the MD distribution also has a greater positive skew (ie, it is more asymmetrical) than the FA.
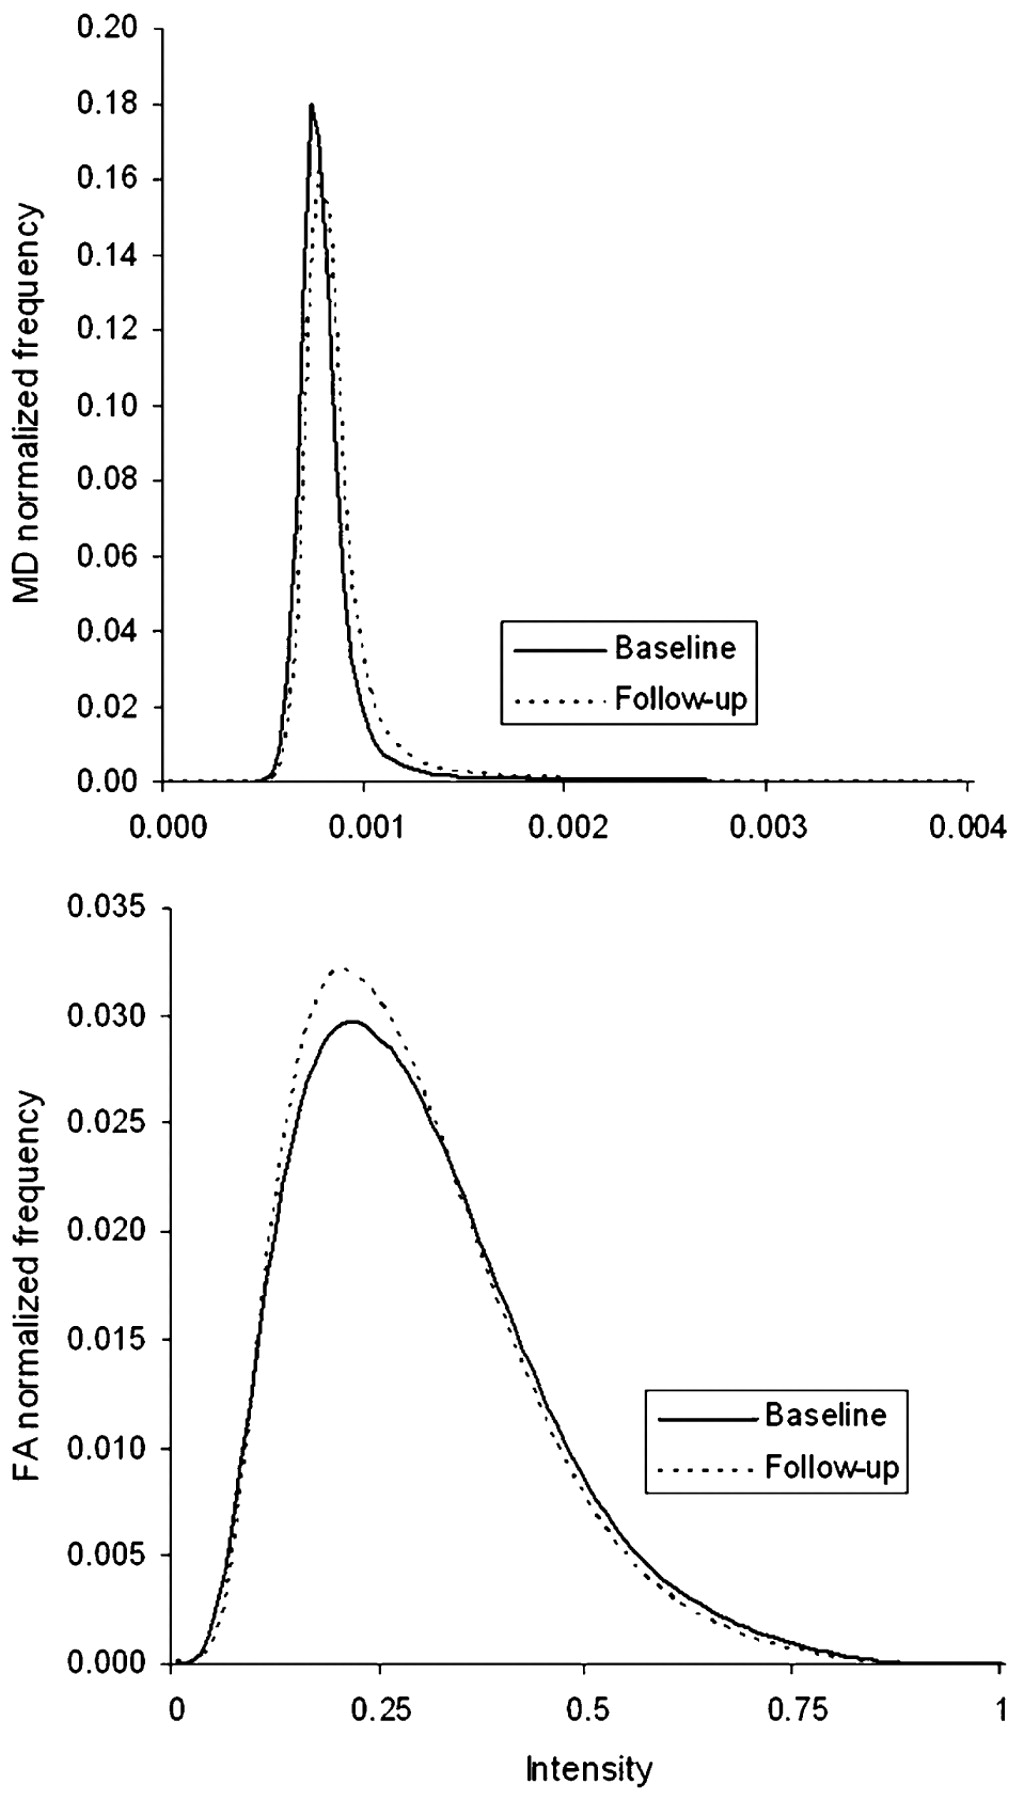
Whole brain white matter mean mean diffusivity (MD) and fractional anisotropy (FA) histograms for baseline and follow-up data.
In order to assess the reproducibility of DTI measurements, scans were repeated within a week in eight healthy volunteers. Test–retest errors for DTI histogram measures indicated good reproducibility. For example, normalised peak height frequency and median are given below, and other parameters demonstrated similar error levels. Test–retest errors: MD normalised peak height frequency (mean = 4×10⁻⁶, SD = 0.00003), MD median (mean = 4×10⁻⁶, SD = 0.00002), FA normalised peak height frequency (mean = −0.003, SD = 0.009) and FA median (mean = 0.004, SD = 0.015).
White matter hyperintensities (WMH)
FLAIR images were loaded into dispunc (David Plummer, University College London, UK), and WMH were outlined using the contour function. All areas of increased signal were included unless: (i) the area was less than 10 pixels, (ii) the area was a narrow band (less than 1 pixel wide) along the ventricles and (iii) hyperintensities were due to the presence of blood vessels. Baseline and follow-up images were blinded for date of acquisition, and WMH on both scans were outlined concurrently. Lacunar infarcts were counted on T1 images by an experienced observer. Although lacunar infarcts were rare (four in one subject, two in two subjects and one in eight subjects, with none in the remainder), where WMH were present adjacent to a lacunar infarct, the lacunar infarct volume was excluded from the WMH volume.
Brain volume measurements
These were performed using SIENAX and SIENA software (http://www.fmrib.ox.ac.uk/fsl/siena/index.html).25 Using SIENAX, T1 weighted volume images were used to calculate baseline normalised brain volume, controlling for individual differences in skull size. Percentage change in brain volume between the two time points was automatically calculated using SIENA.
Statistical methods
Analysis was performed on the participants who attended at both baseline and follow-up. Measures were normally distributed at baseline, follow-up and on the measure of change for all cognitive data, DTI parameters and brain volume. WMH volumes were not normally distributed at baseline or follow-up, and were therefore log transformed. The change measurement for WMH volume was normally distributed.
Paired sample t tests assessed the difference between baseline and follow-up measures. Change between the time points was calculated as a ratio using the following equation (baseline = Sb; follow-up = Sf):

This equation was used to take into account baseline levels of functioning, and reduces distortion due to scalar differences in change. In order to investigate whether changes in imaging measures predicted change in cognitive decline, only variables that demonstrated significant change over the 2 year delay were included in the subsequent analysis. Pearson’s correlations were used to assess the relationships between change in imaging and change in cognitive variables. Stepwise regression analyses were performed with change in imaging measures as independent variables and change in cognitive abilities as the dependent variables.
Results
There were no differences between the individuals who did and did not attend for follow-up in baseline measures of age, blood pressure, WMH volume, DTI parameters or information processing speed. The dropout group had smaller baseline normalised brain volume (t = −2.518, p = 0.013) and lower baseline executive function (t = −2.70, p = 0.008) and working memory (t = −2.00, p = 0.048) scores. Demographic details, baseline scores and follow-up scores are shown in table 1.
Cognitive ability scores and MRI measures for baseline and 2 year follow-up data
MRI measures
All DTI measures changed significantly between the two time points with an increase in median MD and a decrease in median FA (table 1 for data and t tests). Figure 1 shows the baseline and follow-up MD and FA histograms for the two time points. Change in the MD distribution between time points was characterised by a significant increase in median MD and a significant decrease in positive kurtosis. These parameter changes caused the distribution to be significantly more symmetrical (ie, have smaller positive skew) and significantly less peaked (ie, have a decreased normalised peak height frequency). Change in the FA distribution between time points was characterised by a significant decrease in median FA and a significant increase in positive kurtosis. In turn, these parameter changes caused the distribution to be more significantly asymmetrical (ie, have greater positive skew) and significantly more peaked (ie, have an increased normalised peak height frequency). Figure 2 illustrates the change in MD and FA normalised peak height frequency between baseline and follow-up.

Changes in mean diffusivity (MD) and fractional anisotropy (FA) normalised peak height frequency with time. Each line represents an individual participant.
WMH, expressed as a percentage of brain volume, increased from 7.21% (SD 9.79) at baseline to 9.00% (SD 12.39) at follow-up (t = −5.03, p<0.001) (see table 1). Normalised whole brain volume decreased from 1589.63 cm3 (SD 76.76) at baseline to 1569.71 cm3 (SD 80.71) at follow-up (t = 4.38, p<.001), a mean reduction of 0.87% (SD 0.993), approximately 0.44% per year (see table 1).
Cognition
There were no differences between the mean z score for the two time points for executive function (mean = 0.042, SD = 0.393; t = −0.979, p = 0.330) or information processing speed (mean = −0.054, SD = 0.759; t = 0.640, p = 0.524). In contrast, working memory scores had declined at follow-up compared with baseline (mean = −0.155, SD = 0.547; t = −2.57, p = 0.012) (see table 1).
Change measures and age
Correlations were performed to assess whether changes in working memory or imaging measures were associated with increasing age. Age did not correlate significantly with change in working memory (r = 0.034, p = 0.763). There were no significant correlations between age at baseline and WMH (r = −0.056, p = 0.624) or normalised brain volume (r = −0.205, p = 0.070). There were no significant correlations between FA histogram measures and age, and only one significant correlation with change in the MD histogram measures and age, with MD normalised peak height frequency (r = 0.244, p = 0.037).
Correlations between change in MRI parameters and change in working memory
The association between imaging and longitudinal cognitive data was only considered for working memory, the measure that showed significant change at follow-up.
The working memory change ratio correlated with change in MD normalised peak height frequency, MD skewness and MD kurtosis. There were no correlations with change in FA parameters (table 2). There were no correlations between either change in WMH (r = 0.098, p = 0.396) or normalised brain volume (r = −0.075, p = 0.517) and change in working memory.
Correlations for associations between the change ratio for working memory and change in imaging measures, and partial correlations controlling for age
To check that age effects were not influencing the results, the correlations between change in working memory and change in the imaging measures were repeated, controlling for age at baseline. The results remained largely unchanged with the working memory change ratio remaining significantly correlated with change in MD normalised peak height frequency (r = −0.346, p = 0.004), MD skewness (r = −0.270, p = 0.026) and MD kurtosis (r = −0.306, p = 0.011) (see table 2). Secondary analyses were performed to assess the relationship between change in imaging measures and change in both executive function and information processing speed. No significant correlations were observed in these analyses.
Additional partial correlations were performed to investigate whether the relationship between change in DTI parameters and change in working memory was independent of change in the volume of WMH. The pattern of correlations remained the same: change in working memory correlated significantly with change in MD normalised peak height frequency (r = −0.320, p = 0.007), MD skewness (r = −0.251, p = 0.038) and MD kurtosis (r = −0.294, p = 0.014).
Multivariate analysis of all MRI and working memory data
A stepwise regression analysis was computed with change in working memory as the dependent variable. MD normalised peak height frequency was selected to represent the DTI histogram as it demonstrated the most robust correlation. Independent variables were change in MD normalised peak height frequency, WMH and normalised brain volume. Only MD normalised peak height frequency remained in the model (beta = 0.329, p = 0.005), explaining 10.8% of the variance in working memory (F(1,68) = 8.27, p = 0.005).
Correlations between baseline MRI parameters and change in working memory
No significant correlations were observed between baseline imaging measures and change in working memory.
Discussion
Previous cross sectional studies have shown that DTI parameters correlate strongly with both age and aspects of cognition, including executive function and working memory.14 26 27 Furthermore, they have shown that correlations of DTI with cognition are generally stronger than between WMH and cognition.12 13 The current study, describing longitudinal data from the GENIE cohort, extends these findings and demonstrates that DTI is sensitive to short term age related white matter change.
WMH have been widely used as an MRI marker of white matter damage. However, high signal merely reflects increased tissue water content,28 and not necessarily tissue destruction and white matter tract disruption. DTI would be expected to provide a better measure of white matter tract disruption. Cross sectional studies support this hypothesis. In both sporadic12 13 and hereditary29 white matter ischaemia due to SVD, DTI parameters correlate more strongly than WMH with cognition. This suggests that DTI may be a sensitive measure to monitor changes in age related white matter damage, and also a potential surrogate marker to evaluate new therapies. However, prior to this it is essential to determine, in prospective studies, whether DTI can detect change over short time periods and whether this change correlates with changes in cognition.
Over the 2 year follow-up, we found highly significant changes in all descriptors of the MD and FA histogram distributions. In particular, median MD increased and the histogram distribution became more symmetrical and less peaked across the time points while median FA decreased and the histogram became more asymmetrical and more peaked. In terms of structural integrity changes, the median changes indicate a reduction in overall white matter integrity. Interpretation of changes in skewness, kurtosis and peak height frequency are more complicated and are explained in the following section. In particular, changes in skewness are caused by both global and local MD and FA value changes between time points. Global changes identified as increased median MD and decreased median FA cause the skewness to decrease for MD and increase for FA. Furthermore, new or expanding regions of WMH will cause large local increases in MD and decreases in FA. These regions will cause MD voxels included in the histogram body at baseline to be found in the tail at follow-up (thus increasing positive skewness), and high FA voxels initially found in the histogram tail to be located within the body at follow-up (thus decreasing the positive skewness). It is evident that for MD these global and local effects work against each other, but the finding of a significant decrease in positive skewness implies that the global structural integrity changes identified by MD are more prevalent than the effect of emerging WMH regions in this case. For FA, the local and global structural integrity changes work together to increase positive skewness, possibly leading to the finding of greater significant change in skewness for FA than MD in the histogram data. To understand changes in kurtosis and peak height frequency, the changes in homogeneity of the MD and FA maps between time points should be considered. Initially MD maps are highly homogeneous whereas FA maps are highly heterogeneous. Changes in structural integrity such as increases in MD and decreases in FA will manifest differently at each white matter voxel, but these will act to increase the heterogeneity of the MD maps (therefore causing decreased MD kurtosis and peak height frequency) and increase the homogeneity of the FA maps (therefore causing increased FA kurtosis and peak height frequency).
There were also significant changes in WMH and brain volume. In contrast with the significant changes in MRI, and particularly the DTI parameters, there was much less detectable change in cognitive parameters. Working memory was the only cognitive domain to demonstrate significant decline. No significant changes were observed in executive function or information processing speed. This demonstrates that DTI is sensitive to change over this short time period while this is not the case for the cognitive tests conventionally used. It is possible that at least part of the lack of change in executive function and processing speed occurs because deterioration of abilities is cancelled out by practice effects, although these abilities may be stable over this period.
We looked for correlations between changes in MRI parameters with the cognitive domain in which change could be detected, namely working memory. Significant correlations were observed between the change in DTI histogram parameters and the change in working memory only, although these were small or moderate in size. There were no correlations between change in working memory and change in WMH or brain atrophy. This also supports the potential of DTI as a surrogate marker of age related cognitive decline. However, the correlations were not consistent across different measures that describe the MD histogram, and no significant correlations were found with FA histogram measures. The reason for the observed associations between changes in working memory and MD, where FA does not demonstrate this relationship, are likely to be due to the nature of these diffusion measures.
As MD is more homogenous across the brain at baseline than FA, the increases in MD may be more robust than decreases in FA, leading to more consistent change in MD data, although further work should be performed to support this. This may explain why MD demonstrates stronger associations with working memory abilities, and suggests that the distributed white matter networks required for cognitive function are globally more sensitive to distributed changes in MD than FA.
Although change in MD histogram measures correlated with change in working memory, no associations were observed between baseline imaging and change in working memory. This either suggests that the baseline white matter pathophysiology is not strongly predictive of further physiological change that would be coupled with working memory decline or that the measurements are not sufficiently sensitive to detect this association. Longer term follow-up is required to explore these associations further.
WMH has previously been suggested as a surrogate marker to evaluate treatments for age related cognitive decline.30 31 The changes in WMH volume in our cohort were within the range reported previously30 31 The rate of brain atrophy in our study (−0.44% annually) is also similar to that previously reported, with previous estimates varying between −0.32% and −0.45% in middle-age and elderly populations.32 33 34
In this study, we used an automated histogram analysis, which reduces interindividual user error and may be suitable for larger multicentre studies using DTI as a surrogate marker. The associations with age and cognition using histogram and region of interest approaches are similar.14 A number of different parameters can be derived from the histogram. All are closely related but some may offer particular advantages. To explore this we described a number of different parameters and assessed their pattern of change with age and their sensitivity to change. Median MD increased and MD histogram distribution became more symmetrical and less peaked across the time points while median FA decreased and the FA histogram became more asymmetrical and more peaked. Median changes indicate a reduction in overall white matter integrity whereas changes in kurtosis indicate that voxel increases in MD are more variable than decreases in FA. We found the parameter which correlated strongest with cognition was normalised peak height frequency. The same parameter correlates strongly with cognition in SVD.13
An advantage of this study is that it represents a normal community population with individuals being randomly selected. A proportion of patients did not attend follow-up examination and these tended to have worse cognitive profiles and lower measures of brain integrity at baseline. It is possible that these individuals had different rates of brain or cognitive changes and this would lead to two potential outcomes. If these individuals were less likely to deteriorate, then those who remained in the study would be more likely to deteriorate and hence increase the correlation between brain and cognitive changes. Conversely, if the participants who “dropped out” would have deteriorated more, then the remaining sample would demonstrate less decline and correlations would be reduced. On balance, the latter possibility is perhaps more likely, in view of the lower baseline values for brain imaging measures and poorer cognitive performance in the dropout group. Despite this potentially reduced sensitivity, significant results are detected in this sample.
In summary, in this longitudinal study of normal ageing, we demonstrated that DTI is sensitive to white matter damage and can reliably detect change even over a 2 year period. Despite the highly significant change in DTI parameters, there was little detectable change in cognition, with a significant change only in working memory and no detectable change in executive function or information processing speed. A significant correlation was detected between change in DTI and change in working memory performance. Our data suggest DTI may be a promising marker to assess age related white matter change. Further studies are required with longer follow-up and larger sample size to show whether changes in DTI robustly correlate with decline in different cognitive domains thought to depend on white matter connectivity.
Acknowledgments
We are grateful to the staff of Church Lane Surgery, Merton Park, London, UK, for assistance with patient recruitment.
REFERENCES
Footnotes
Funding The GENIE study was funded by a UK charity Research into Ageing Program grant. FS is funded by an MRC studentship.
Competing interests None.
Ethics approval Ethics committee approval was obtained from Wandsworth Local Research Ethics Committee.
Provenance and Peer review Not commissioned; externally peer reviewed.