Article Text

Abstract
Objective We sought to identify the risk factors for predicting the progression from mild cognitive impairment (MCI) to Alzheimer’s disease (AD).
Methods We searched 6 electronic databases for cohort studies published from January 1966 to March 2015. Eligible studies were required to be relevant to the subject and provide sufficient data for our needs.
Results 60 cohort studies with 14 821 participants from 16 countries were included in the meta-analysis. The strongest positive associations between risk factors and the progression from MCI to AD were found for abnormal cerebrospinal fluid (CSF), phosphorylated τ (p-τ) (relative risk (RR)=2.43, 95% CI=1.70 to 3.48), abnormal CSF τ/Aβ1–42 (RR=3.77, 95% CI=2.34 to 6.09), hippocampal atrophy (RR=2.59, 95% CI=1.95 to 3.44), medial temporal lobe atrophy (RR=2.11, 95% CI=1.70 to 2.63) and entorhinal atrophy (RR=2.03, 95% CI=1.57 to 2.62). Further positive associations were found for the presence of apolipoprotein E (APOE)ε4ε4 and at least 1 APOEε4 allele, CSF total-τ (t-τ), white matter hyperintensity volume, depression, diabetes, hypertension, older age, female gender, lower mini-mental state examination (MMSE) score and higher AD assessment scale cognitive subscale (ADAS-cog) score. Negative associations were found for high body mass index (RR=0.85, 95% CI=0.76 to 0.96) and higher auditory verbal learning test delay score (RR=0.86, 95% CI=0.77 to 0.96).
Conclusions Patients with MCI with APOEε4, abnormal CSF τ level, hippocampal and medial temporal lobe atrophy, entorhinal atrophy, depression, diabetes, hypertension, older age, female gender, lower MMSE score and higher ADAS-cog score, had a high risk for the progression to AD.
- ALZHEIMER'S DISEASE
- META-ANALYSIS
- SYSTEMATIC REVIEWS
Statistics from Altmetric.com
Introduction
Alzheimer’s disease (AD) is an illness turning out to be a major public health problem. The cause is unknown, whereas many individual risk factors for subsequent AD have been suggested, such as mild cognitive impairment (MCI) with an estimated conversion rate of 10–15% per year.1 MCI represents the transitional stage from the cognitive changes of normal ageing to very early dementia.2 ,3 Owing to this high risk for progression to AD, patients with MCI represent a target for future disease modifying therapies. However, as MCI is a heterogeneous entity characterised by differences in cognitive profile and clinical progression, the outcome for any patients with MCI is uncertain. Many patients may remain stable or even revert to a normal state, while others progress to AD. Therefore, insight is needed into the specific risk factors and biomarkers that predict progression from MCI to AD, in order to be able to identify individuals within the MCI population who are at the highest risk of developing AD in the near future. These individuals will subsequently constitute a target population for (early) intervention studies. There were also separate studies and meta-analyses indicating that apolipoprotein Eε4 (APOEε4), depression and diabetes were risk factors for the disease’s progression.4–6 However, some of the conclusions seem to be conflicting. As a result, it was necessary for us to report a large and comprehensive systematic review and meta-analysis for clinicians using an extensive search of cohort studies to identify the risk factors for progression to AD of a population with MCI.
Methods
Search strategy
We conducted a systematic literature search of PubMed, OVID, EMBASE, the Cochrane library, the Library of Congress and EBSCO, for studies published in the period from January 1966 to March 2015. Terms we used included ‘risk factors’, ‘Alzheimer's disease’ and ‘mild cognitive impairment’, combined with Boolean operators as appropriate. We restricted our analysis to articles written in English. Additional studies were obtained from the reference lists of identified studies.
Study selection
Published studies were included if they fulfilled the following criteria: (1) the study had a cohort design; (2) baseline population meet the criteria for the diagnosis of MCI; (3) they assessed at least one risk factor for predicting progression from MCI to AD; (4) AD and dementia were both defined as the end points; (5) for multiple articles identified from a single study, preference was given to the publication with the longest follow-up period or the most comprehensive reporting of relevant data (the comprehensive reports mainly indicated the largest scale report among these reports about 1 study or database) and (6) they reported original data on relative risks (RRs), HRs or ORs, and 95% CI or sufficient data to calculate an effect size. We excluded review articles, editorials, commentaries, hypothesis papers, letters that reported no new data, meta-analysis and abstracts.
Data extraction and quality assessment
We extracted the following variables from each study: (1) name of the first author; (2) publication year; (3) country; (4) follow-up time in years; (5) study resource; (6) definition of MCI; (7) genders of patients; (8) mean age of patients; (9) baseline mini-mental state examination (MMSE) score; (10) number of patients at the baseline and the proportion of completing the follow-up; (11) overall incidence of dementia or AD; (12) exposure assessment and (13) effect size and 95% CIs. The discrepancies were resolved by discussion. If studies did not report RR, HR or OR, the raw data were reviewed to determine whether effect size could be calculated. In studies that reported both crude RRs and adjusted RRs, the adjusted figures were used.
The Newcastle Ottawa Scale (NOS)7 was used to assess the quality of each study. This measure assesses aspects of methodology in observational studies related to study quality, including selection of cases, comparability of populations and ascertainment of exposure to risks. We identify ‘high’ quality choices with a ‘star’. A study can be awarded a maximum of one star for each numbered item within the Selection and Exposure categories. A maximum of two stars can be given for Comparability. Studies with a score equal to or higher than seven were considered to be high quality.
Statistical analysis
When studies provided more than one risk factor, we performed multivariate analysis. Otherwise, univariate analysis would be conducted. If a factor of interest was reported by three or more studies in a consistent manner, they were combined in a meta-analysis. We classified them according to different risk factors and carried out subgroup analysis among risk factors that were homogeneous. We generated a pooled effect size and 95% CI for each factor. Acquiescently, we chose a fixed effect model. Heterogeneity between studies was assessed using the I2 statistic and, where statistically significant heterogeneity was found (I2>50%, p<0.05), the random effects model was used to combine results.8 ,9 Before that, we reviewed the primary literature and performed sensitivity analyses to examine the source of the heterogeneity. Publication bias was assessed by using the Begg's test.10 Where data were not given in a way that could be used in the meta-analysis or where only one or two significant studies were identified for a given risk factor, the findings of these studies are only listed in Discussion section. All analyses were performed using Stata V.12.
Results
Eligible studies
The literature search yielded 3565 English language articles, of which 60 were eligible for inclusion in the meta-analysis and 31 in the systematic review (s-References 1–91) (figure 1). Quality assessment showed that the NOS score of each study was not less than 7, indicating that the methodological quality was generally good (see online supplementary table S1). Full details of studies included in the meta-analysis were provided (see online supplementary tables S2 and S3). The 31 articles could not be included in the meta-analysis, as the quality scores were lower than 5. Another reason was that less than two studies had reported a result on a given factor.

Flow chart of study selection.
Assessment of risk factors
Demographic features
There were 33 studies about demographic predictors (older age, sex (female) and high education level) in our meta-analysis.
After pooling every subgroup, older age (RR=1.06, 95% CI=1.03 to 1.1, I2=53.3%, p=0.009) and sex (female) (RR=1.33, 95% CI=1.08 to 1.64, I2=2.0%, p=0.422) had a high risk of the progression in random-effects models. However, high education level (RR=1.04, 95% CI=0.96 to 1.12, I2=47.3%, p=0.065) had no large association with the progression to AD in patients with MCI (figure 2). The Begg's test did not provide strong evidence for publication bias in the ‘Demographic features’ group (z=0.87(continuity corrected), Pr>|z|=0.386(continuity corrected)).

Forest plot shows the association between demographic features and the risk of progression from MCI to AD (AD, Alzheimer's disease; MCI, mild cognitive impairment; RR, relative risk).
APOE gene
Among all the studies we reviewed, risk factors on genes were all focused on APOE. We performed subgroup analysis between ‘at least one APOEε4 allele’ and ‘APOEε4ε4’.
In the presence of at least one APOEε4 allele, the pooled RR for progression to AD in all studies was 1.84 (95% CI=1.59 to 2.14) with the heterogeneity across studies (I2=19.1%, p=0.026). In addition, in the presence of APOEε4ε4, the pooled RR for the progression in all studies was 3.02 (95% CI=1.17 to 7.79) from a random-effects model as the heterogeneity across studies (I2=73.3%, p=0.024). The overall effect size 1.93 (95% CI=1.65 to 2.26), heterogeneity (I2=31.5%, p=0.084) and publication bias (z=0.31(continuity corrected), Pr>|z|=0.760(continuity corrected)) of the two subgroups indicating APOEε4 is a risk factor for the progression from MCI to AD (figure 3). We also conduct subgroup meta-analysis by race to ‘At least 1 APOEε4 allele’ factor. There was no heterogeneity between subgroup: p=0.355 (see online supplementary figure S2).
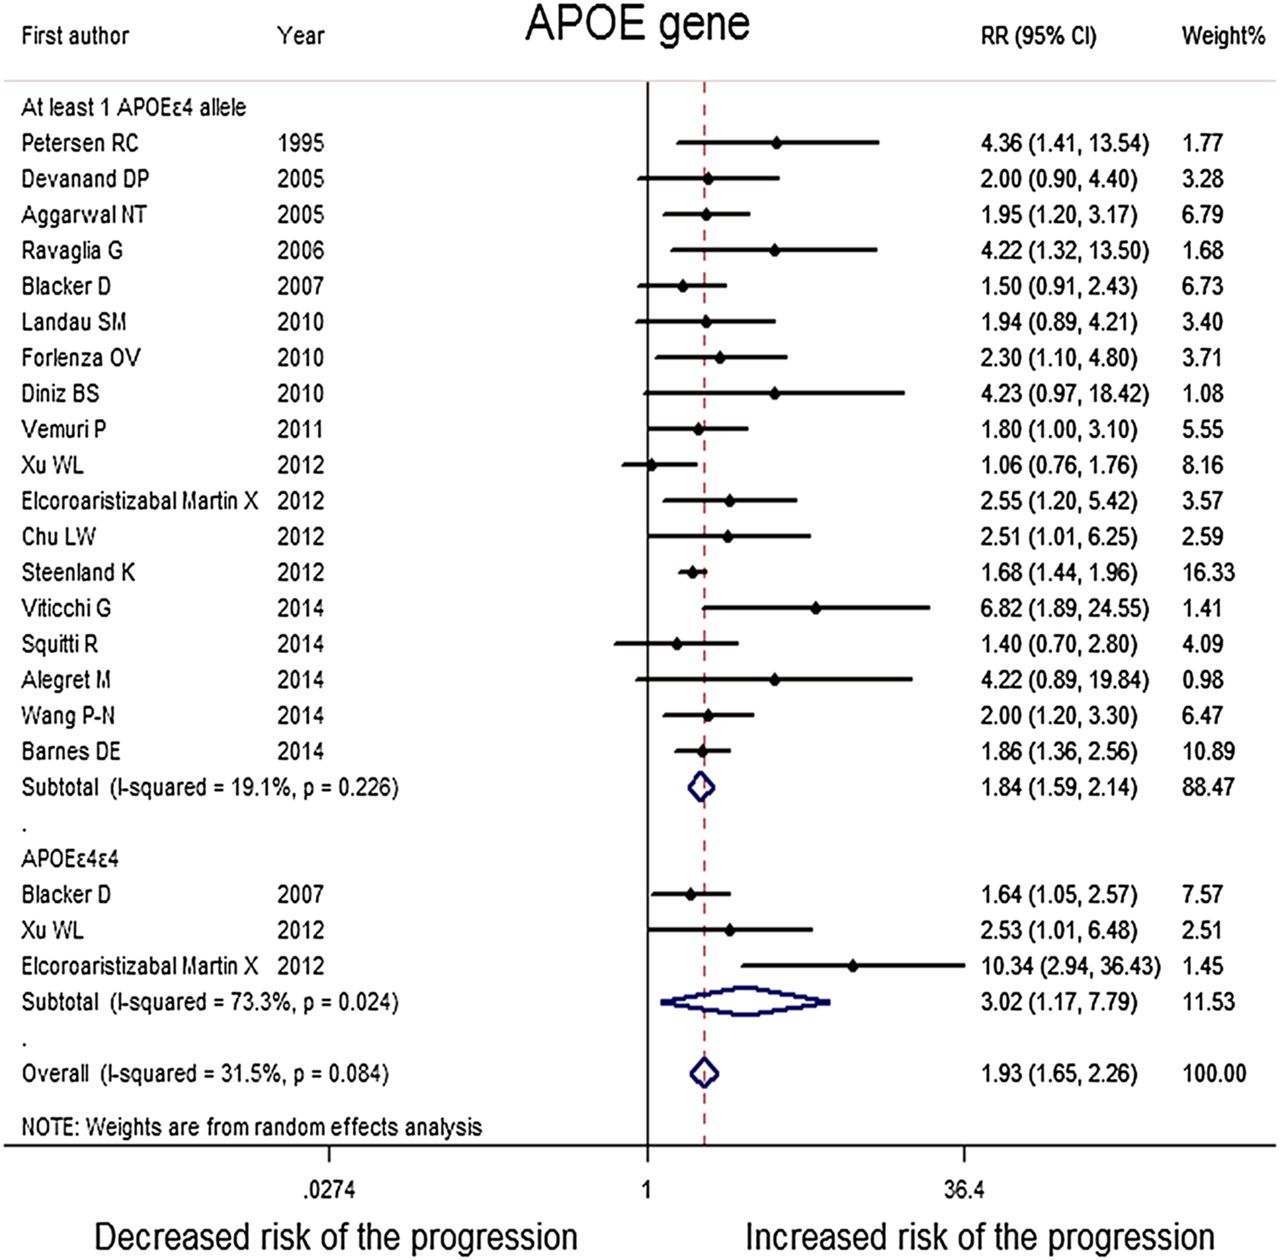
Forest plot shows the association between APOE gene and the risk of progression from MCI to AD (AD, Alzheimer's disease; APOE, apolipoprotein E; MCI, mild cognitive impairment; RR, relative risk).
Lifestyle factors
As to lifestyle, there are seven studies reporting on the association between smoking and the risk of progression from MCI to AD. Among included studies, there was also one article about alcohol consumption, which would be discussed in the system review. After pooling these 11 studies, results showed no significant association between smoking and the risk of the progression (RR=0.98, 95% CI=0.96 to 1.01, I2=19.5%, p=0.281). There was also no significant heterogeneity among these studies (figure 4). The Begg's test did not provide obvious publication bias in the ‘Lifestyle factors’ group (z=0.30(continuity corrected), Pr>|z|=0.764(continuity corrected)).

Forest plot shows the association between life styles factors and the risk of progression from MCI to AD (AD, Alzheimer's disease; MCI, mild cognitive impairment; RR, relative risk).
Cognitive and psychological factors
Seventeen of the included studies compared risk of progression to AD between patients with MCI with and without physiological and psychological factors (anxiety, apathy, depression). An apathy syndrome is defined as a syndrome of primary motivational loss, that is, loss of motivation not attributable to emotional distress, intellectual impairment, or diminished level of consciousness.11 Although related to depression, apathy is a motivational disorder that can be distinguished from depression, which is characterised by feelings of sadness, hopelessness or inappropriate guilt.12 Besides, anticipation of and preparation for future harm are central features of anxiety.
After pooling these studies, patients with MCI with anxiety (RR=1.42, 95% CI=0.57 to 3.57, I2=86.5%, p=0.001) and apathy (RR=1.46, 95% CI=0.68 to 3.14, I2=84.5%, p=0.000) both had no significant association with the progression to AD. However, depression (RR=1.35, 95% CI=1.05 to 1.75, I2=76.0%, p=0.000) had a high risk of the progression in random-effects models (figure 5). The Begg's test did not provide obvious publication bias in the ‘Cognitive and psychological factors’ group (z=0.30(continuity corrected), Pr>|z|=0.764(continuity corrected)).
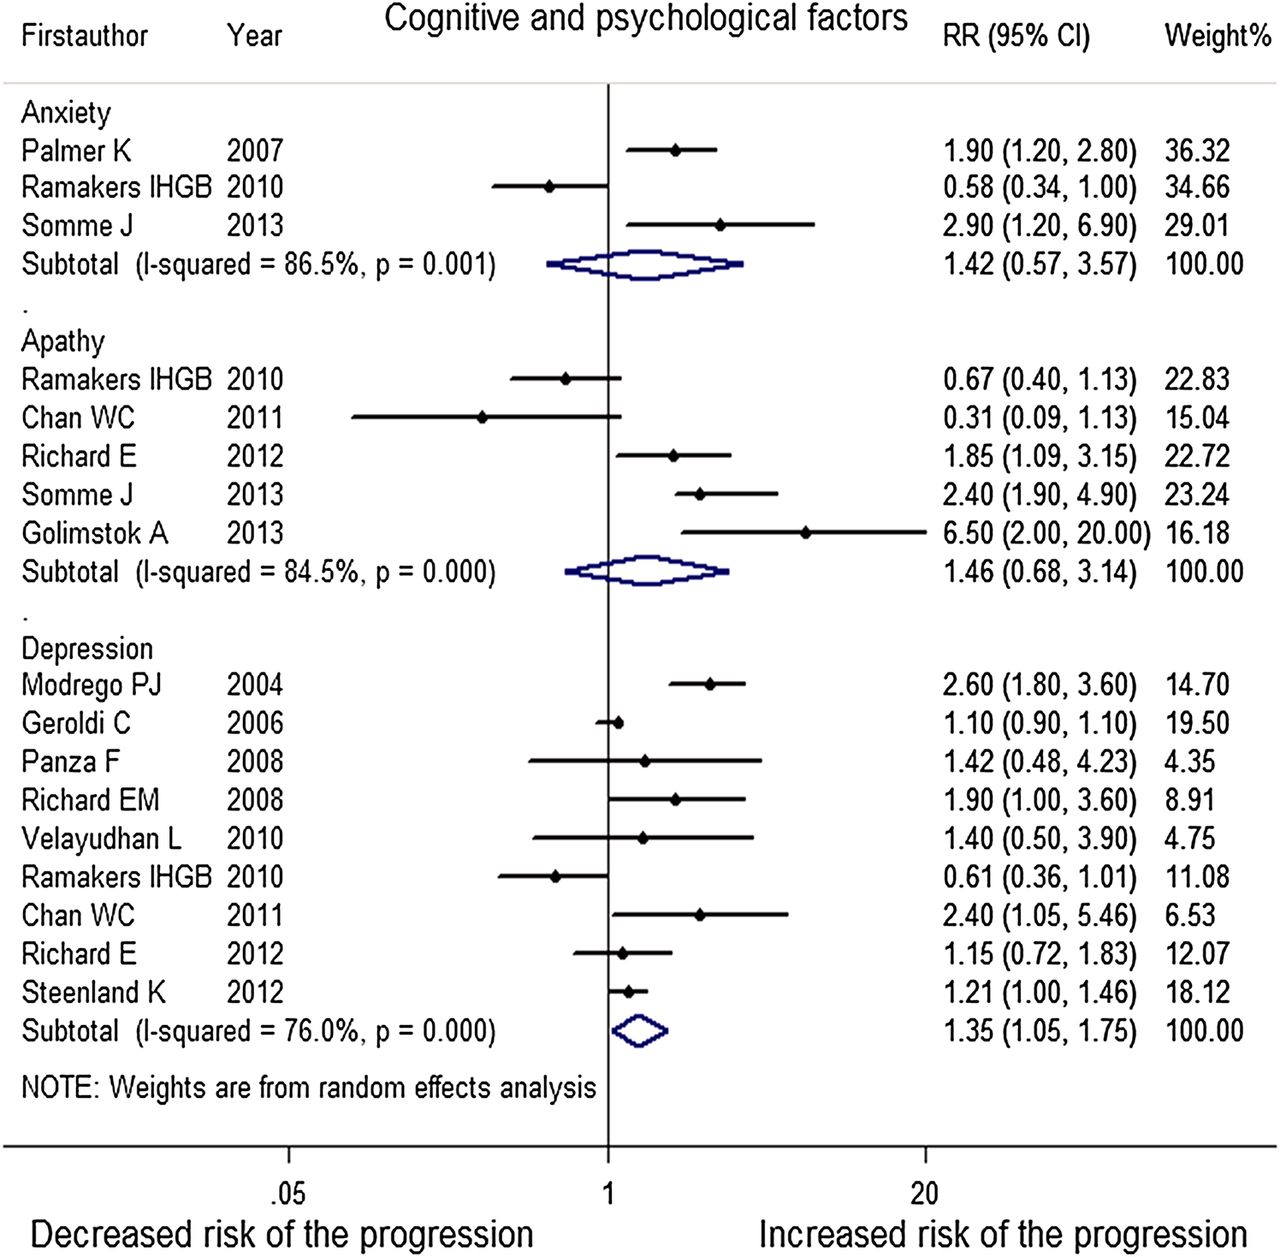
Forest plot shows the association between cognitive and psychological factors and the risk of progression from MCI to AD (AD, Alzheimer's disease; MCI, mild cognitive impairment; RR, relative risk).
Vascular disorders
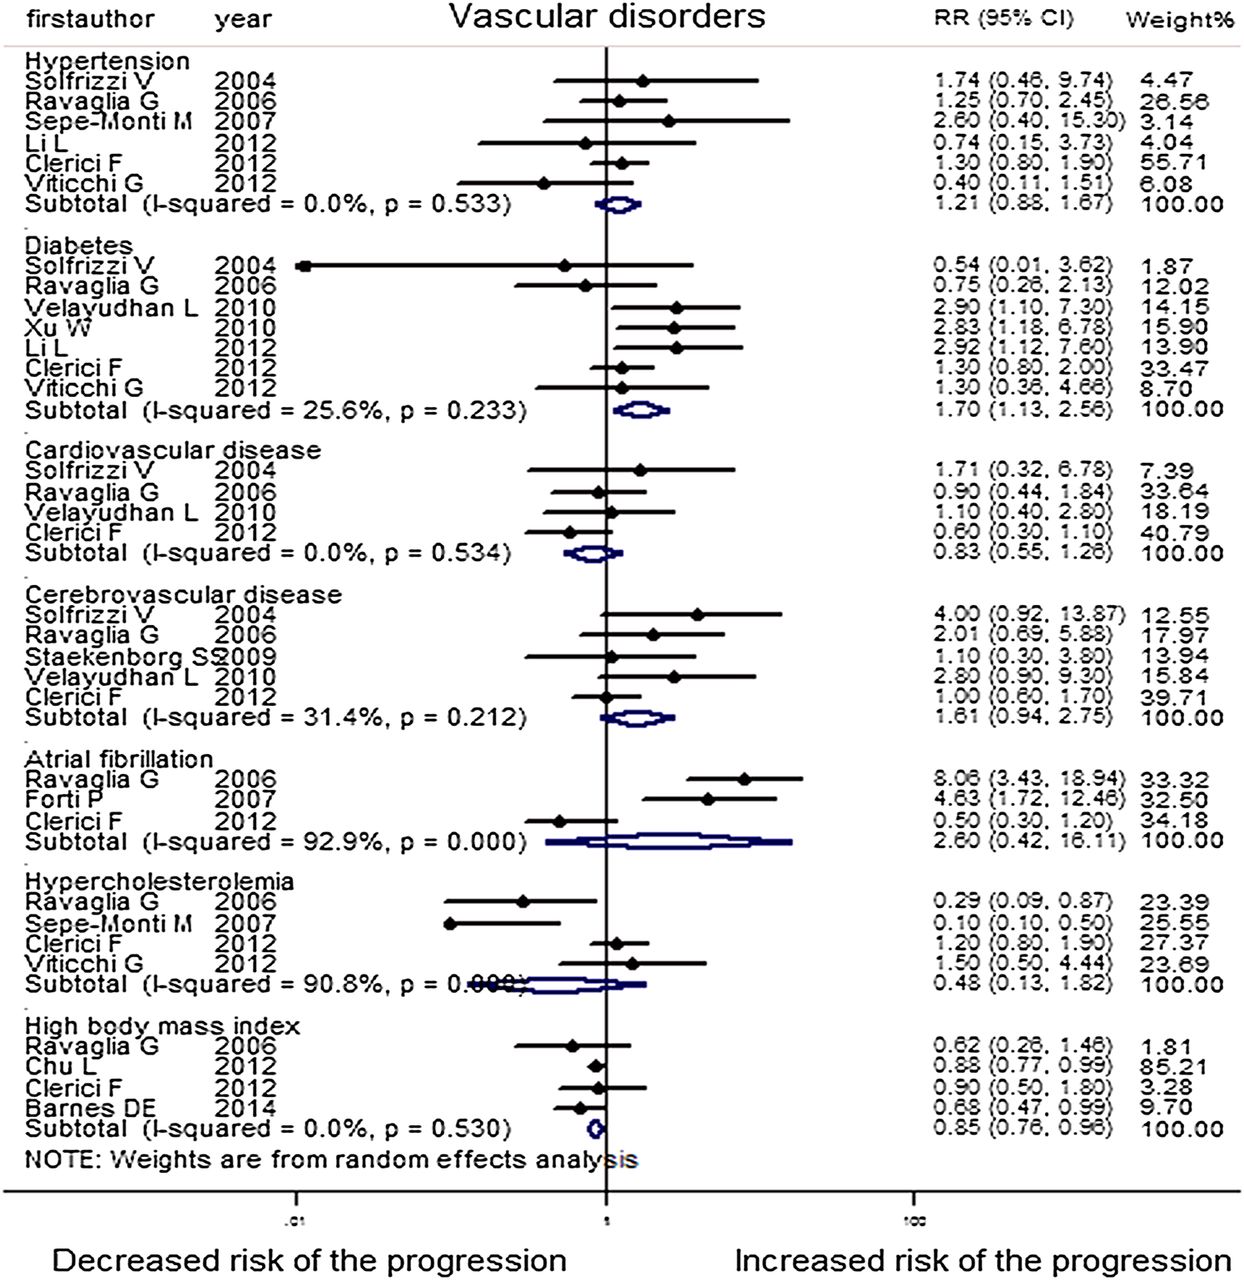
Most patients with MCI have basic diseases. In this study, we analyse seven of them. Thirty-five of the included studies reported on them (hypertension, diabetes, cerebrovascular disease, cardiovascular disease, atrial fibrillation, hypercholesterolaemia and high body mass index).
After pooling every subgroup, patients with diabetes (RR=1.52, 95% CI=1.2 to 1.91, I2=20.0%, p=0.271) and hypertension (RR=1.18, 95% CI=1.1 to 1.27, I2=0.0%, p=0.658) have high risk for the progression. However, for cardiovascular disease (RR=0.83, 95% CI=0.55 to 1.26, I2=0.0%, p=0.534), cerebrovascular disease (RR=1.61, 95% CI=0.94 to 2.75, I2=31.4%, p=0.212), atrial fibrillation (RR=2.60, 95% CI=0.42 to 16.11, I2=92.9%, p=0.000) and hypercholesterolaemia (RR=0.48, 95% CI=0.13 to 1.82, I2=90.8%, p=0.000), they had no large association with the progression to AD in patients with MCI. High body mass index had an especially protective effect to the progression (RR=0.85, 95% CI=0.76 to 0.96, I2=0.0%, p=0.530). Atrial fibrillation and hypercholesterolaemia had high heterogeneity; we had performed on random-effect models (figure 6). The Begg's test did not provide significant evidence for publication bias in the ‘Vascular disorders’ group (z=0.73(continuity corrected), Pr>|z|=0.462(continuity corrected)).

Forest plot shows the association between vascular disorders and the risk of progression from MCI to AD (AD, Alzheimer's disease; MCI, mild cognitive impairment; RR, relative risk).
MRI markers
There were 19 studies included in meta-analysis (hippocampal atrophy, medial temporal lobe atrophy, entorhinal atrophy, white matter hyperintensity (WMH) volume and subcortical infarctions).
After pooling these studies, patients of MCI with hippocampal atrophy (RR=2.59, 95% CI=1.95 to 3.44, I2=0.0%, p=0.964), medial temporal lobe atrophy (RR=2.11, 95% CI=1.70 to 2.63, I2=41.7%, p=0.161), entorhinal atrophy (RR=2.03, 95% CI=1.57 to 2.62, I2=46.1%, p=0.157) and WMH volume (RR=1.03, 95% CI=1.00 to 1.07, I2=13.1%, p=0.331), had significant higher incidence of AD than those without, in fixed-effects models. However, no obvious association was found for subcortical infarctions (RR=0.93, 95% CI=0.51 to 1.71, I2=44.9%, p=0.163) (figure 7). The Begg's test did not provide obvious publication bias in the ‘MRI markers’ group (z=0.63(continuity corrected), Pr>|z|=0.533(continuity corrected)).

Forest plot shows the association between MRI markers and the risk of progression from MCI to AD (AD, Alzheimer's disease; MCI, mild cognitive impairment; RR, relative risk).
Cerebrospinal fluid markers
Among various biomarkers reported to be predictors for the progression from MCI to AD, there are 10 studies on Aβ, t-τ and p-τ. However, the ratio of cerebrospinal fluid (CSF) τ and Aβ1–42 (CSF τ/Aβ1–42) is a significant predictor, with three studies reported on it.
The meta-analysis indicated that abnormal CSF t-τ (RR=1.86, 95% CI=1.35 to 2.55; I2=0.0%, p=0.798), abnormal CSF p-τ (RR=2.43, 95% CI=1.70 to 3.48; I2=0.0%, p=0.490) and abnormal CSF τ/Aβ1–42 (RR=3.77, 95% CI=2.34 to 6.09; I2=0.0%, p=0.993), was associated with high risk of progression from MCI to AD. However, abnormal Aβ (RR=2.21, 95% CI=0.87 to 5.63; I2=82.6, p=0.003) had no significant association with the progression to AD in patients with MCI (figure 8). The Begg's test did not provide significant evidence for publication bias in the ‘CSF markers’ group (z=1.48(continuity corrected), Pr>|z|=0.139(continuity corrected)).

Forest plot shows the association between CSF markers and the risk of progression from MCI to AD (AD, Alzheimer's disease; CSF, cerebrospinal fluid; MCI, mild cognitive impairment; RR, relative risk).
Neuropsychological measures
Fifteen of the included studies (lower MMSE score, higher AD assessment scale cognitive subscale (ADAS-cog) score, higher auditory verbal learning test (AVLT) total score and higher AVLT delay score) reporting on neuropsychological measures were involved in our meta-analysis.
After pooling every subgroup, lower MMSE score (RR=1.75, 95% CI=1.04 to 2.96, I2=81.8%, p=0.004) and higher ADAS-cog score (RR=1.12, 95% CI=1.06 to 1.19, I2=78.6%, p=0.000) had a high risk of the progression. However, higher AVLT total score (RR=1.06, 95% CI=0.74 to 1.53, I2=93.8%, p=0.000) had no significant association with the progression to AD in patients with MCI. There was no significant heterogeneity among these studies. Higher AVLT delay score had a protective effect to the progression (RR=0.85, 95% CI=0.73 to 0.98, I2=56.5%, p=0.130). These all had a high heterogeneity except AVLT delay, so we performed on random-effect models (see online supplementary figure S1). The Begg's test did not provide obvious evidence for publication bias in the ‘neuropsychological measures’ group (z=1.4(continuity corrected), Pr>|z|=0.161(continuity corrected)).
Multivariate analysis
As aforementioned, a single risk factor could significantly predict the disease progression, however, some individuals had a variety of risk factors. When studies provided more than one risk factor, we performed multivariate analysis. The results showed that combining different classes of risk factors could even more strongly predict the conversion from MCI to AD. The combination of low CSF Aβ42 and high CSF τ levels could significantly predict the progression from MCI to AD (s-References 60, 89). It combined Aβ and τ levels as a predictor so as to improve the specificity. Another study indicated abnormal τ/Aβ1–42 combining with low AVLT score or medial temporal lobe atrophy improved outcome prediction (s-References 1, 12, 23).
Discussion
This meta-analysis was the inclusion of cohort studies from six online database searches, covering published literature from nearly 50 years. We evaluated 28 probable risk factors for predicting progression from MCI to AD. In order to ensure the quality, we carefully developed the inclusion criteria for studies and conducted strict quality evaluation. This piece of work involves extensive analysis and hopefully will provide valuable insights and inspiration to clinicians.
The following are the major points revealed from this meta-analysis: (1) the presence of at least one APOEε4 allele, APOEε4ε4 allele, abnormal CSF p-τ, t-τ and τ/Aβ1-42, hippocampal and media temporal lobe atrophy, entorhinal atrophy, WMH volume, depression, diabetes, hypertension, older age and female gender, lower MMSE score and higher ADAS-cog score all had high risk for the progression from MCI to AD. (2) Subcortical infarctions, anxiety, apathy, smoking, cardiovascular disease, cerebrovascular disease, atrial fibrillation, hypercholesterolaemia, higher education level and higher AVLT total had no significant risk to the progression. (3) High body mass index and higher AVLT delay had a protective effect to the progression.
Older and female patients with MCI were more likely to progress to AD; however, the impact of education level on the progression risk seems to be controversial. As to a variety of scoring criteria, classical criteria such as MMSE, ADAS and AVLT had a considerable predictive value. Besides, lower scores in “memory impairment screen plus” and “word list recall of verbal memory and orientation” also contributed to the prediction of conversion (s-Reference 64, 70).
The APOEε4 allele is the strongest known genetic risk factor for AD. It is supposed to alter β-amyloid processing or to modify the response to AD pathology and could be a new therapeutic target for the treatment of AD. Other than our findings, a recent meta-analysis published at 2011 indicated the positive predictive value of APOEε4 allele for progression from MCI to AD-type dementia.5 However, their effect sizes were OR, sensitivity, specificity, positive and negative predictive values, and positive and negative likelihood ratios. Moreover, one study indicated that APOE is a significant predictor of the conversion to AD among patients with MCI (s-Reference 10). Based on all these studies, there is convincing evidence to suggest that APOEε4 has significant risk for the progression from MCI to AD.
As to lifestyle, smoking as well as alcohol consumption and insomnia had no obvious association with the risk of the disease progression (s-References 42, 51, 56). However, higher adherence to the Mediterranean diet is associated with a reduced risk for MCI conversion to AD (s-Reference 71). Patients with four neuropsychiatric symptoms (NPS) had nearly 2.5 times the odds of developing dementia at follow-up than patients with 0–3 NPS (s-Reference 65). A recent meta-analysis of 12 studies published in 2012 showed that depression was a major risk factor for incidence of dementia (including AD, vascular dementia and any dementia) and MCI.6 It also included cohort studies, but focused on subjects without dementia or MCI at baseline. As depression could be managed through psychotherapy, medication, electroconvulsive treatment, and so on,13 our finding implied that depression treatment might be applied to prevent or delay the occurrence and development of AD in patients with MCI.
Diabetes mellitus is associated with changes in cognition. Several large longitudinal population-based studies have shown that elderly people with type 2 diabetes had an increasing rate of cognitive decline.14 A quantitative meta-analysis showed that diabetes was a risk factor for incident dementia (including AD, vascular dementia and any dementia) and MCI.4 Our analysis shows that diabetes was the only independent predictor of conversion from MCI to dementia among all vascular risk factors studied. Moreover, among those with MCI, baseline levels of lower extremity motor performance, parkinsonian gait and bradykinesia were inversely related to risk of AD, even after controlling for clinical stroke (s-Reference 66). Besides, intracranial arterial stenosis and olfactory identification deficits, particularly with lack of awareness of olfactory deficits, increased the risk of developing AD dementia after MCI (s-Reference 62, 80). Hypertension had positive association with the risk of the progression and the use of antihypertensive medications was protective (s-Reference 76). Furthermore, a recent study showed that patients with cardiovascular risk factors had higher conversion rate to AD (s-Reference 85).
MRI is an important means to diagnose AD. The medial temporal lobe, which includes the hippocampus and parahippocampal gyrus (the latter includes the entorhinal cortex), atrophies early in AD.15 In patients with AD, hippocampal volume is smaller than in controls and is associated with greater risk of dementia.16 Similarly, entorhinal cortex volume is smaller in patients with AD compared with controls.17 As expected, they all showed significant value in predicting the progression from MCI to AD in the current meta-analysis. Another study indicated that converters showed greater atrophy in the hippocampus, predominantly in the CA1 region and subiculum, and in the entorhinal cortex, especially in the anterior–inferior pole bilaterally (s-Reference 79). Compared with our findings, they narrowed the extension and provided more accurate positioning. Infarctions and WMHs have been associated with an increased risk of cognitive decline in normal people.18 ,19 However, in our meta-analysis, WMH volume shows slight value in predicting the progression and subcortical infarctions show no significant association with the risk. Moreover, among patients with MCI, both greater ventricular volume and whole brain annual per cent volume change and age-related white matter changes in the basal ganglia (both sides) increased the risk of conversion to AD (s-Reference 59, 81). Higher apparent hippocampal diffusion coefficient values and lower hippocampal W-scores in people with amnestic MCI at baseline are both associated with a higher RR of progression to AD in the future (s-Reference 75).
Concentrations of t-τ and p-τ can be measured in CSF and correlate with the presence of neurofibrillary tangles.20 ,21 In our study, increased CSF level of t-τ and p-τ were associated with an increased risk of progression to AD in participants with MCI, and RRs were 1.86 and 2.43, respectively. Besides, the concentration of Aβ1−42 in CSF correlates with the presence of amyloid plaques in the brain.20 However, Aβ in CSF did not show any associations with the progression. As it showed high heterogeneity, we reviewed the primary literature and performed sensitivity analyses to analyse the source of the heterogeneity. It showed that van Rossum's study using heterogeneity as its effect size described the progression from MCI to dementia but not AD in the other two studies. Whether abnormal Aβ in CSF could predict the progression from MCI to AD still needs further exploration. Moreover, many other biomarkers were also indicated to be predictors of the progression aside from Aβ and τ. For example, having a low baseline serum leptin level predicts an increased risk of progression to AD (s-Reference 84). However, the serum clustering level is not a predictor of progression to AD (s-Reference 7). Furthermore, patients with hyperfibrinogenaemia, a low level of cystatin C and elevated coated-platelet levels in the plasma are associated with increased risk for progression to AD (s-Reference 73, 86, 87).
Limitations of this meta-analysis must be considered. We did not hand search journals and made no attempt to identify unpublished studies. We restricted our search to articles written in English and to cohort studies and therefore some studies must have been missed. During the past five decades (from 1966 to 2014), the diagnostic criteria for MCI and AD have changed, and the various MCI subtypes had different risk of cognitive deterioration, also, we cannot obtain all the information about the typology of MCI; these factors may influence the final results. Owing to the large number of studies, we cannot fully unify the exposure assessment measures and the adjustments. Statistically significant heterogeneity was found in 10 of the meta-analyses performed. In two of these, there was moderate heterogeneity (I2=50–75%), and in eight there was high heterogeneity (I2>75%). This is because of the differences between individual studies in, for example, study population characteristics, study resource, mean years of follow-ups, exposure measurements and whether crude or adjusted risk estimates were reported. For this reason, we performed on a random-effects model.
In conclusion, this is a comprehensive systematic review and meta-analysis taking into account all risk factors for the progression from MCI to AD. The numerous proposed risks may help to develop new therapy approaches and conduct earlier intervention in order to prevent or delay the occurrence and development of AD in patients with MCI. However, the treatments to these risk factors and the progression rates to AD in patients with MCI should be further confirmed by using large sample sizes and high-quality studies.
References
Supplementary materials
Supplementary Data
This web only file has been produced by the BMJ Publishing Group from an electronic file supplied by the author(s) and has not been edited for content.
- Data supplement 1 - Online figures
- Data supplement 2 - Online references
- Data supplement 3 - Online table S1
- Data supplement 4 - Online table S2
- Data supplement 5 - Online table S3
Footnotes
Contributors LT and J-TY conceived the study. J-QL, H-FW, LT, WX, Q-FZ, TJ, M-ST and JW selected reports and extracted the data. J-QL and H-FW analysed and interpreted the data. J-QL and J-TY wrote the first draft of the manuscript. All the authors critically revised the manuscript for intellectual content and approved the final version. LT and J-TY are guarantors.
Competing interests None declared.
Provenance and peer review Not commissioned; externally peer reviewed.