Article Text

Abstract
Trials of potential neuroreparative agents are becoming more important in the spectrum of multiple sclerosis research. Appropriate imaging outcomes are required that are feasible from a time and practicality point of view, as well as being sensitive and specific to myelin, while also being reproducible and clinically meaningful. Conventional MRI sequences have limited specificity for myelination. We evaluate the imaging modalities which are potentially more specific to myelin content in vivo, such as magnetisation transfer ratio (MTR), restricted proton fraction f (from quantitative magnetisation transfer measurements), myelin water fraction and diffusion tensor imaging (DTI) metrics, in addition to positron emission tomography (PET) imaging. Although most imaging applications to date have focused on the brain, we also consider measures with the potential to detect remyelination in the spinal cord and in the optic nerve. At present, MTR and DTI measures probably offer the most realistic and feasible outcome measures for such trials, especially in the brain. However, no one measure currently demonstrates sufficiently high sensitivity or specificity to myelin, or correlation with clinical features, and it should be useful to employ more than one outcome to maximise understanding and interpretation of findings with these sequences. PET may be less feasible for current and near-future trials, but is a promising technique because of its specificity. In the optic nerve, visual evoked potentials can indicate demyelination and should be correlated with an imaging outcome (such as optic nerve MTR), as well as clinical measures.
- Multiple Sclerosis
- MRI
This is an Open Access article distributed in accordance with the Creative Commons Attribution Non Commercial (CC BY-NC 3.0) license, which permits others to distribute, remix, adapt, build upon this work non-commercially, and license their derivative works on different terms, provided the original work is properly cited and the use is non-commercial. See: http://creativecommons.org/licenses/by-nc/3.0/
Statistics from Altmetric.com
Introduction
Multiple sclerosis (MS) is a multifocal central nervous system (CNS) disease characterised histopathologically by inflammatory demyelination and neuroaxonal loss seen in both white matter (WM) and grey matter (GM). Historically, the focus of therapeutic research has been on the WM component of the disease with specific regard to reducing episodes of inflammatory demyelination. More recently, there has been increased work on neuroprotection and remyelination. In this review article, after briefly considering mechanisms of demyelination and remyelination, we discuss imaging outcome measures that might be used to provide evidence of remyelination in therapeutic trials.
Demyelination and remyelination in MS
The term ‘demyelination’ refers to the loss of myelin sheath surrounding axons. It is the main pathological process in both the WM and GM in MS, and is a major contributor to impaired function and disability through impaired saltatory conduction and conduction block. In the WM, it is likely that demyelination occurs secondary to an inflammatory T cell mediated insult to myelin and/or oligodendrocytes, although oligodendrocyte apoptosis has also been implicated. The new inflammatory demyelinating lesions are associated with breakdown of the blood–brain barrier (BBB) and are seen on MRI as new signal hyperintensity on T2-weighted (T2w) sequences, as well as on T1-weighted (T1w) sequences after the administration of gadolinium-chelate contrast agents. Demyelination in the GM may also occur secondary to a similar immune pathology, although inflammatory changes and BBB breakdown tend to occur less often than in the WM. There is also evidence that meningeal inflammation is prominent and may play an important role in cortical demyelination, especially in progressive disease and in the subpial region.
‘Remyelination’ refers to the process of restoring the myelin sheath around demyelinated axons. It can result in recovered function through improved conduction, as well as providing a degree of axonal protection. It is thought that endogenous remyelination in the CNS occurs through the action of oligodendrocyte precursor cells generating new oligodendrocytes, which encourage the production of myelin in demyelinated areas.
In MS, remyelination can occur in variable amounts; when it occurs, and by how much, is poorly understood. Unlike toxin-induced demyelination, where postinsult remyelination often occurs in a complete fashion, in MS the continued presence of auto-reactive T cells may create a hostile environment for optimal oligodendrocyte function, and may thus inhibit complete remyelination. Despite this, however, some patients may demonstrate complete or near complete remyelination in a number of lesions, especially in early MS. It is likely that constitutional factors such as sex, age, stage of disease and genetic make-up influence the efficiency of remyelination.
A number of potential remyelinating pharmacological therapies have shown promise in experimental models of demyelination. Some examples of recent or current interest are mentioned in table 1.
Remyelinating agents recently or currently under investigation
Investigating remyelination in MS
In investigating potential remyelinating pharmacological therapies in patients with MS, there is a need for outcome measures that are sensitive and specific to myelination, with the added requirement of being quantitative and reproducible. Ultimately, such measures should also reflect and predict a clinically meaningful outcome.
Acute lesions that correspond to acute clinical episodes (relapses) pathologically demonstrate the presence of demyelination, inflammation and oedema to varying extents. Improvement in clinical symptoms reflects varying degrees of resolution of inflammation and oedema as well as remyelination; no clinical markers are specific to myelin content alone. Although histopathological assessment through biopsy is possible and suited to experimental models or postmortem MS studies, it is an unrealistic outcome measure in patient studies. Certain electrophysiological investigations may infer myelination status for specific functions, such as visual evoked potentials (VEP) for the optic nerve. As a whole, however, imaging markers offer the most direct and practical potential means for detecting remyelination in vivo.
Imaging remyelination in the brain
Conventional MRI sequences
Conventional T2w MRI is very sensitive in identifying brain WM lesions of MS. However, it is qualitative in nature and lacks the specificity to differentiate between the pathological substrates of MS, such as inflammation, oedema, axonal damage, demyelination, remyelination and gliosis.
On T1w imaging, active lesions (those showing gadolinium-enhancement) appear hypointense on T1w images, and these are often referred to as Black Holes (BHs). Following the evolution of BHs, postresolution of active inflammation may be a useful outcome measure in trials of neuroprotection.1 A longitudinal change in lesion signal intensity from hypointense to isointense on T1w images (the disappearance of BHs) after the period of active inflammation may be indicative of remyelination,2 but also reduction in oedema. Given that T1w lesions show poor specificity for myelin per se and are strongly influenced by axonal pathology,3 they are likely to be of only indirect value in studies of remyelination and repair.
Magnetisation transfer ratio
Magnetisation transfer (MT) imaging is a semiquantitative technique based on the premise that protons in biological tissue exist in two ‘pools’: a free (‘liquid’) pool, in which protons are highly mobile, and a restricted (‘semisolid’) pool consisting of protons attached to macromolecules such as proteins or lipids, which are therefore relatively immobile. Exchange of magnetisation takes place between the two pools, and this can have important effects on the relaxation properties of tissue. The bulk of the observable signal in conventional MRIs originates from the free proton pool since the restricted proton pool has a very short T2 relaxation time (∼10–20 μs) and therefore its signal decays very rapidly, rendering this compartment ‘invisible’. MT imaging provides access to the restricted protons, which are located in biologically interesting tissue regions.
The magnetisation transfer ratio (MTR) is a widely used measurement of the amount of MT exchange taking place between the two proton compartments obtained from two images acquired with and without MT-weighting (through the application of a dedicated radiofrequency pulse) so that a ratio can be estimated from the signal intensities. Most commercial scanners have the ability to acquire MTR sequences, and whole brain acquisition times are short enough to be feasible for most study protocols.
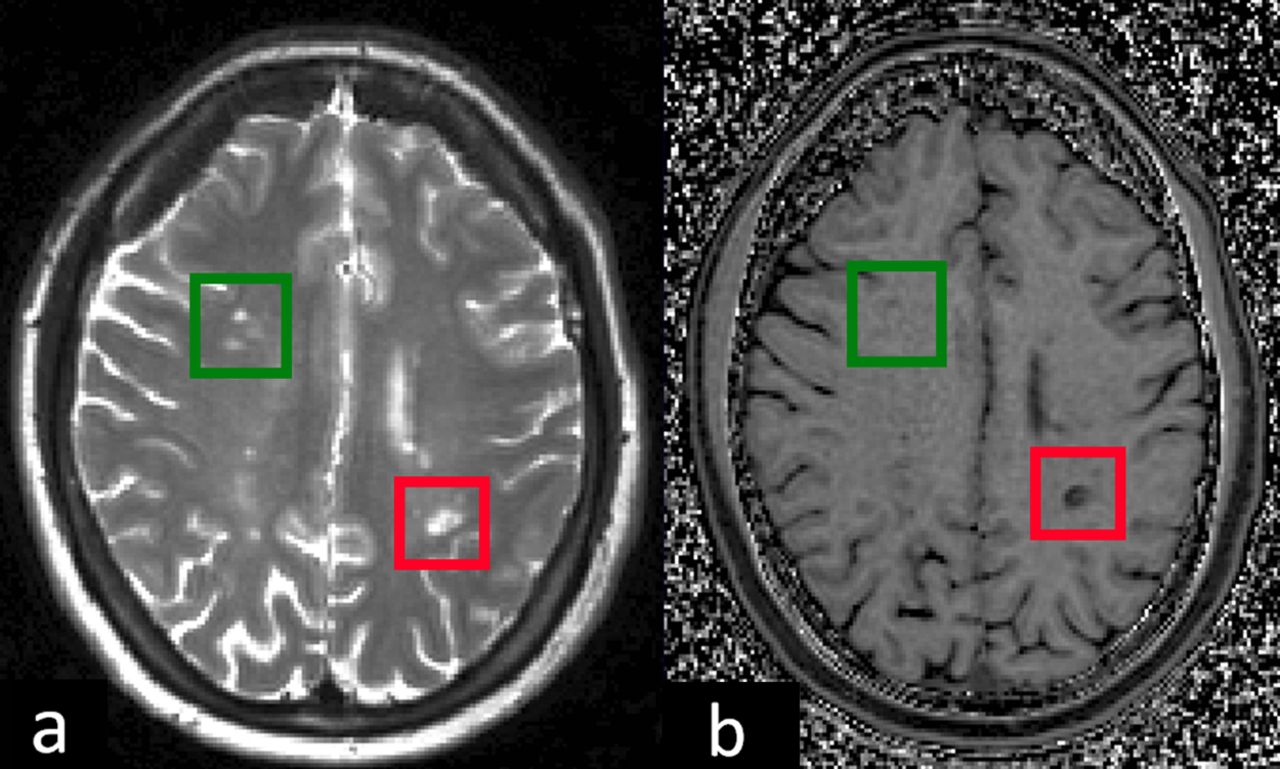
MTR is strongly affected by myelin, but may also be influenced by water content and inflammation,4 and axonal density.5 In MS brain WM lesions (figure 1), the MTR is lower than in the normal appearing white matter (NAWM), although NAWM also shows decreased MTR in MS compared with healthy controls.6 Lesion MTR is lower in the presence of demyelination, with significantly higher MTR observed in remyelinated lesions,5 although still lower than in NAWM, which may be due to incomplete remyelination, morphological differences in the newly formed myelin and a degree of axonal loss. Similar findings were reported in another postmortem MRI and histopathological study performed in 36 MS patients.7

Axial view of slices of the brain of a multiple sclerosis patient demonstrating appearance on (A) T2w imaging and (B) magnetisation transfer ratio (MTR) map of the corresponding slice. The red box contains a lesion which is markedly hypointense compared with normal appearing white matter (NAWM), hence corresponding to a low MTR value in the lesion, and compatible with demyelination. The green box contains three lesions which appear isointense or only slightly hypointense compared with NAWM, hence corresponding to higher lesion MTR (similar to or slightly less than NAWM), suggesting possible remyelination.
Chen et al measured the MTR in acute gadolinium-enhancing lesions longitudinally in four MS patients, examining both the MTR of individual lesions and the mean normalised MTR over all lesion voxels during and after contrast enhancement. They found significant reductions and subsequent increases in MTR values consistent with demyelination and remyelination. Temporal MTR changes differed between lesions, and persisted in lesion regions for at least 3 years following lesion formation.8
qMT: the restricted proton fraction, f
Although MTR protocols are readily available on clinical scanners, they have the drawback of being ‘semiquantitative’ in that the MTR value depends on the MT pulse properties, the type of acquisition sequence (eg, gradient echo/spin echo), excitation pulse flip angle and echo time, repetition time and spoiling characteristics. Mathematical models of the MT effect in biological tissues have been proposed in order to measure more fundamental quantitative parameters related to tissue structure, such as the restricted proton fraction, f (the fraction of protons that are attached to macromolecules).9 As well as a measure of f, other quantitative parameters related to tissue structure and magnetisation exchange can be obtained from a quantitative MT (qMT) experiment; these include T2B (the T2 relaxation time of the restricted proton pool); 1/RAT2A (the ratio of T1 to T2 for the free proton pool); and RM0A (the forward exchange rate constant from the free to the restricted proton pool). These quantitative parameters are more robust and greatly influenced by the myelin content in the brain or spinal cord (since restricted protons are known to be attached to macromolecules such as myelin), and have been demonstrated to be reliable and reproducible.10 The restricted proton fraction, f, has also been shown to correlate mainly with myelin content and, to a lesser extent, axonal count in the brain.11 Results of animal studies have also supported the hypothesis that f is an imaging biomarker of demyelination.12
Giacomini et al studied six relapsing-remitting MS (RRMS) patients with acute gadolinium-enhancing lesions serially using qMT imaging and demonstrated reductions in both MTR and the ratio of restricted to free protons (f) in acute lesions, indicating a reduction in macromolecular content. Both parameters then recovered over a period of several months. The reduction in MTR was smaller than that observed in the macromolecular content, which the authors attributed to the confounding effect of oedema increasing the T1 and thereby attenuating the MTR reduction.13
Performing qMT measurements is challenging because it requires several images to be sampled (rather than just two) with different MT-weighting in order to fit the model to the data and estimate the fundamental qMT parameters. This can result in long scan times, and the model of the MT effect is not unique as the tissue structure is complex.
Multi-component T2 relaxometry: the MWF
Complicated biological systems are likely to be characterised by many different tissue compartments. Multi-component relaxometry (MCR) probes these different proton environments by exploiting their different relaxation characteristics. It has previously been shown that it is possible to separate the signal from brain tissue into three distinct components based on their T2 relaxation times.14 Previous studies have found that a short T2 component with T2 between 10 and 55 ms (approximately 20 ms) is attributed to water trapped within myelin bilayers (myelin water); a medium T2 component with T2 between 70 and 95 ms (approximately 80 ms), thought to be intracellular and extracellular water; and a long T2 component with T2 of more than 100 ms, which reflects the cerebrospinal fluid (CSF).
The ratio of the short T2 (myelin water) signal to the total water signal, termed the myelin water fraction (MWF),14 has been shown to correlate with histological measures of myelin content,15 and is also independent of concomitant pathological processes such as axonal degeneration, and is insensitive to inflammation.16
The major limitation to of this technique is limited reduced brain coverage compared with traditional multi-component T2 relaxometry using 2D multi-spin echo (MSE) sequences. These 2D sequences, though, are additionally at risk of MT effects.17 In order to prevent this, 3D sequences should be considered, which can increase acquisition time. These limitations would most likely make using standard 2D/3D MSE T2 relaxometry-derived MWF unfeasible for most clinical trials of potential remyelinating agents. Recently, other sequences have been used for MCR, such as T2prep 3D SPIRAL,18 and 3D-GRASE,19 which allow whole brain coverage with acquisition speeds that are faster than traditional 2D MSE T2 relaxometry, and demonstrate similar MWF values in brain tissues.
Multi-component driven equilibrium single pulse observation of T1 and T2 (mcDESPOT) is a MCR technique that uses rapid gradient acquisition steady-state imaging (ie, spoiled gradient echo (SPGR) and balanced steady-state free precession) over a range of flip angles, giving a more clinically feasible sequence (acquisition times ∼16–30 min), enabling whole brain coverage.20 In a study of two patients with primary progressive MS compared with healthy controls, mcDESPOT demonstrated decreased MWF in areas corresponding to WM lesions.21 It should be noted, however, that one recent study performed propagation-of-error analysis of mcDESPOT data and demonstrated an inability of mcDESPOT signals to precisely estimate parameters of a two-pool model with exchange.22 Therefore, further investigation may be required in order to interpret the quantitative parameters obtained from mcDESPOT.
Diffusion tensor imaging
Diffusion-weighted imaging provides quantitative information about the diffusion behaviour of water molecules in vivo, which is altered in pathology as a consequence of microstructural changes.23 By modelling the signal behaviour of water in tissue when sensitised to water molecule diffusion using diffusion tensor imaging (DTI), it is possible to derive several parameters that provide sensitive biomarkers for characterising tissue microstructural abnormalities. These include the fractional anisotropy (FA), mean diffusivity (MD), axial diffusivity (λǁ) and radial diffusivity (λ⊥) (see online supplementary figure S1).
FA has been shown to correlate both with axonal counts24 ,25 and myelin content.25 In healthy tissue and in the presence of a main fibre bundle with a well-defined direction, radial diffusivity (λ⊥) reflects movement of water molecules perpendicular to the axon and is thought to reflect myelin content.26 In contrast, axial diffusivity (λǁ) reflects movement of water molecules parallel with the axon, and is potentially sensitive to axonal pathology.27 Loss of myelin has been associated with increased λ⊥ in experimental models,26 ,27 but not with λǁ.27 The main limitation of these indices is that the diffusion tensor (DT) and its eigenvalues are a mathematical model based on the assumption of Gaussian water diffusion behaviour, which is not true in tissue where restriction and hindrance take place. Therefore, indices like λ⊥ and λǁ depend on the ability of the DT to detect the correct fibre-tract orientation per voxel. Complex tissue microstructure or tissue disrupted by pathology can affect the ability to detect myelin content via measurement of the radial diffusivity.28 ,29 It is essential that when analysing radial diffusivity as a measure of demyelination, care is taken to understand how the DT has been fitted to the signal and examine its eigenvectors as well as its eigenvalues.30 Additionally, it should be noted that in the presence of concomitant inflammation, where tissue structure changes because of axon and myelin injury and of infiltration of other cell types, λ⊥ may be affected by these extra processes, thus underestimating the effects of demyelination, while λǁ may overestimate the extent of axonal damage or loss.31 This, in addition to the presence of crossing fibres,29 means that diffusion parameters derived using the current DTI model have reduced specificity and sensitivity to the underlying pathologies in MS.
Neurite orientation dispersion and density imaging
Neurite orientation dispersion and density imaging (NODDI) is a promising new diffusion imaging technique that quantifies microstructural indices of neurites in vivo using a multi-compartment model. It provides two key parameters, the neurite density (υIC) (the intracellular volume fraction) and the orientation dispersion index, which characterises the orientation dispersion of the axonal and/or dendritic projections. These parameters have been shown to disentangle the source of diffusion anisotropy, providing more specific measures of brain tissue microstructure than the standard parameters derived from the DT eigenvalues.32
A three-compartment tissue model is fitted to high-angular-resolution diffusion imaging acquired with two different diffusion weightings (ie, one shell with low and one shall with high b-value), optimised for clinical feasibility.
A strong correlation of neurite density with the intensity of myelin stain under light microscopy has previously been demonstrated, indicating that neurite density may be a useful marker for demyelinating disorders such as MS.33
MR spectroscopy
Proton MR spectroscopy has the ability to detect active demyelination (due to the existence of peaks from lipids associated with myelin breakdown and/or increases in the choline peak, attributed to increased membrane turnover) but is unable to assess intact myelin,28 and is thus unlikely to be of use as a primary imaging measure in trials of potential remyelinating therapies.
Positron emission tomography
Positron emission tomography (PET) imaging uses various radio-labelled isotopes to target specific tissue substrates and as such has a range of clinic uses in various medical conditions. Thioflavin T derivative [methyl-11C]-2-(4′-methylaminophenyl)-6-hydroxybenzothiazole ([11C]PIB, a carbon-labelled version of Pittsburgh Compound B) has been shown to be a useful biomarker for PET imaging in Alzheimer's Disease (AD). Previous Congo Red derivatives that showed affinity for amyloid plaques in AD were also shown to bind to myelin in the CNS.34
Stankoff and colleagues have demonstrated via in vitro studies that PIB binds to myelinated tracts in the cerebellar WM and corpus callosum of mice, as well as in human WM tracts. In MS brains, PIB demonstrated lack of staining within demyelinated lesions and the ability to differentiate among NAWM, partially demyelinated WM and fully demyelinated WM. In addition, after systemic injection in vivo into mice, PIB was found to stain WM areas, and the level of staining varied with myelin content.35
As PIB shows binding affinity to CNS myelin, [11C]PIB can be seen as a potential biomarker for in vivo PET imaging of myelin in MS. Stankoff and colleagues looked at PET imaging with [11C]PIB in baboons, showing selective labelling of WM, especially in the subcortical areas. In a proof-of-concept study of two patients with RRMS, PET imaging with [11C]PIB labelled NAWM effectively, with reduced uptake in lesions seen on MRI. Reduced PIB uptake was of a lesser degree in gadolinium-enhancing lesions, suggesting that levels of myelination differ between newer and older lesions, with newer lesions showing incomplete demyelination.35
While further in vivo studies are required, these findings are encouraging and suggest [11C]PIB PET could be a potential future imaging outcome in trials of remyelination and repair in MS.
Imaging remyelination in the spinal cord
Involvement of the spinal cord is common in MS, and often leads to substantial motor, sensory and sphincter dysfunction. Demyelinating lesions are commonly seen on MRI, especially in the cervical spine. However, clinical, especially motor, disability appears from postmortem studies to be less associated with lesion numbers and more so with axonal loss in the cord.36
Imaging the spinal cord in vivo is technically challenging, mostly because of the small cross-sectional size of the cord and the potential for cord motion during the scan, caused both by respiratory and cardiac motion. Additionally, magnetic susceptibility effects due to the surrounding bones (vertebrae) and pulsation of the CSF may cause problems with particular types of scans. Quantitative measurements in the spinal cord are much more challenging than in the brain as a result of issues such as partial volume effects with CSF, registration of different volumes, physiological noise and the lack of a standard common spinal cord template.37 Nevertheless, there is a great potential in studying this part of the CNS as its contribution to disability is substantial.
Magnetisation transfer ratio
MTR is reduced in the spinal cord in MS, both in vivo38 and postmortem,39 and correlates with myelin content39 and clinical disability.40 MTR measurement is often performed using an SPGR sequence, which is time-consuming, and may be susceptible to motion artefact. MTR normalised to CSF signal intensity on an MT-weighted scan (MTCSF) is a measure that can be useful where conventional MT imaging is not feasible due to motion degradation or low SNR signal-to-noise ratio (SNR).41 However, discriminating myelination and inflammation may be difficult as MTCSF is also sensitive to CSF flow and tissue relaxation times.
Diffusion tensor imaging
In MS, radial diffusivity (λ⊥) reflects demyelination in ex vivo spinal cords.42 FA and radial diffusivity (λ⊥) in the corticospinal tracts and posterior columns are correlated with clinical outcomes such as the Expanded Disability Status Scale (EDSS), the timed 25-Foot Walk and the 9-Hole Peg Test.43 However, specificity of DTI metrics to myelin in the spinal cord is unclear and similar to the brain, the confounding effects of increased cellularity or inflammation-induced oedema are not taken account of in current DTI models. Compared with the brain, DTI metrics should theoretically be easier to measure in the spinal cord, given that fibre-tract orientation in WM columns is essentially unidirectional. However, the small size of the spinal cord, physiological noise, signal contamination from CSF and poor homogeneity due to the presence of tissue–bone interface make DW measurements in the spinal cord more difficult than in the brain.44
Neurite orientation dispersion and density imaging
The feasibility of this sequence in studying the spinal cord of healthy volunteers and MS patients has recently been shown.45 The potential clinical value of NODDI in the spinal cord in MS needs further investigation to evaluate its sensitivity towards the effects of disease when an optimised protocol has been implemented.
Positron emission tomography
[11C]MeDAS is a radio-labelled substrate that, in experimental models, crosses the BBB and selectively labels WM regions in the brain and spinal cord, and is highly sensitive and specific to myelin content.46 Serial PET imaging with [11C]MeDAS in LPC rat models showed low spinal cord uptake at the peak of demyelination on day 7 postinjection and demonstrated gradual increased uptake on days 14 and 21, reflecting remyelination. Similar changes in uptake in the spinal cord reflecting myelination were also seen in the experimental allergic encephalitis model.46 At present, there have been no human studies of [11C]MeDAS-PET.
Imaging remyelination in the optic nerves
The optic nerve forms part of the anterior afferent visual pathway, a discrete WM tract, and is often affected in patients with MS. Optic neuritis (ON) may be the initial clinical presentation in 20% of cases of MS47 and may occur during the disease course in 50% of MS cases.48 Subclinical involvement of the optic nerves is also common,49 as is involvement of the optic radiation.50 The main pathology in the optic nerves is the demyelinating lesion, although similar to the brain and spinal cord, inflammation, gliosis, oedema and axonal loss are also present.51 The optic nerve thus represents an important area of investigation when considering possible remyelinating agents in MS.
VEP, which records evoked potentials following the administration of visual stimuli in the central 30° of the visual field (P100), can suggest demyelination in the optic nerves as increased latency, and axonal loss as decreased amplitude (conduction block due to demyelination can also reduce amplitude). In the MSCIMS trial, subjects with secondary progressive MS who received autologous mesenchymal stem cells demonstrated significantly reduced VEP latencies (p=0.02), increased optic nerve area (p=0.006), increased LogMAR visual acuity overall (0.003), as well as a trend suggesting increasing mean T1w lesion MTR (p=0.097).52
Optical coherence tomography (OCT) is a non-invasive imaging technique that allows quantifiable measurement of retinal structures.53 Retinal nerve fibre layer (RNFL) thickness is a measure of axon integrity of the optic nerve, and many MS patients, even without a clinical episode of ON, will have demonstrable RNFL thickness reduction on OCT.54 Ganglion cell and inner plexiform layer thickness are also reduced in MS, and may correlate better with clinical vision measures than RNFL thickness.55 These retinal measures are representative of axonal integrity in the anterior visual pathways.
It has been reported that delayed latency on VEP correlates with RNFL thinning in MS patients with ON,56 as well as without ON,57 suggesting the clinical and subclinical demyelination may be associated with increased axonal vulnerability. This also supports the concept that remyelination may be neuroprotective. Thus, while OCT outcomes are not themselves intrinsically representative of myelin content, they may be useful adjuncts in trials of potential remyelinating agents to measure possible secondary neuroprotective effects.
Imaging the optic nerves (see online supplementary figure S2) can be technically more difficult than imaging the brain and cord, as the optic nerves are small in diameter, and are especially susceptible to motion artefact. In addition, orbital fat and CSF in the optic nerve sheath may contaminate optic nerve signal, making interpretation difficult. These limitations need to be taken into account when considering the feasibility of any imaging modality in the optic nerves.58
Conventional MR sequences
The lesions of ON can be seen as signal hyperintensities on conventional T2w images, but surrounding fat also generates high signal, making identification of lesions difficult. The use of fat suppression sequences, such as short-τ inversion recovery,59 can help, but can result in high signal from the surrounding CSF, obscuring signal from the optic nerve. In addition, these sequences lack the ability to differentiate among demyelination, oedema, gliosis, inflammation and axonal loss.
Magnetisation transfer ratio
MTR (see online supplementary figure S3) is reduced in optic nerves affected by ON, compared with both unaffected and control nerves, and correlates inversely with VEP latencies.60 This correlation may be greater when assessing lesion, rather than whole nerve, MTR.60 While MTR reduction often occurs rapidly in new brain lesions,61 one study noted that reduction was not marked in the acute phase of the symptomatic ON lesion, and nadir was not reached for many months after the initial clinical episode.62 Recovery of lesion MTR is often seen within the first few months and can continue up to 1 year postappearance.
Patients with incomplete recovery and poorer visual outcomes following ON demonstrate lower affected optic nerve MTR compared with the unaffected nerve,60 as well as the affected nerve of patients showing good recovery.63
While good inverse correlation with VEP latencies in ON suggests that MTR is sensitive to demyelination, axonal loss has also been shown to be an important factor, and one study suggests that it may even exert greater influence than demyelination on MTR values.64
Diffusion tensor imaging
In one study of acute ON, significantly decreased λ|| at baseline was associated with worse visual outcomes, smaller VEP amplitude, prolonged VEP latency and thinner RNFL at 6 months.65 In a study more than 6 months following an episode of ON, λ⊥ was highly correlated with visual outcomes, VEP latency, VEP amplitude and RNFL thickness.66 It is at present unclear whether diffusion measurements reflect changes in myelin or axonal integrity,67 although a recent study in patients with MS demonstrated reduction of FA and increase in λ⊥, with no difference of MD and λ||, suggestive of demyelination.68
Applying DTI imaging to the optic nerves may be technically challenging. Signal contamination from fat and CSF,69 and motion artefacts,70 can occur. A fat and CSF suppressed zonal oblique multi-slice echo planar imaging (ZOOM-EPI) sequence can improve resolution and reliability, and reduce artefacts to a minimum,71 but this, and other selective excitation sequences, are not readily available on all scanners, and may require long scan times in order to acquire anisotropy indices such as FA.72
Sample size calculations for trials using lesion MTR as an outcome measure
In this section, we consider the sample sizes required for proof-of-concept trials of potential remyelination agents using lesion MTR as an outcome measure. The simplest analysis approach involves measuring average lesion MTR per subject per time point and observing change longitudinally. MTR lesions would need to be correlated with either T2w lesions (acute and/or chronic) or gadolinium-enhancing lesions (acute).
A recent paper used data from in vivo and ex vivo studies to estimate required sample sizes for remyelination trials in MS using mean MTR change of lesions detected at baseline on T2w images.73 As these lesions are likely to be chronic, the assumption is that any spontaneous remyelination has already taken place, and thus MTR would remain more-or-less stable over time. The ex vivo study, which included 12 patients with progressive MS who had died, showed that remyelinated lesion MTR lay approximately halfway between NAWM and demyelinated lesions.74 The in vivo data were derived from 18 subjects with RRMS of short duration (less than 3 years) and low disability (EDSS less than 3).75 Subjects had two scans separated by a year interval. Power calculations on these data were performed on the basis that remyelinated MTR values were roughly halfway between lesion and NAWM MTR. Sample sizes for both in vivo and ex vivo data are summarised in table 2.
Sample sizes per arm for a placebo-controlled trial using in vivo lesion magnetisation transfer ratio (MTR) recovery as a primary surrogate outcome marker of remyelination (80% power)
Other factors which could complicate the assumption of a direct correlation between lesion MTR increase and extent of remyelination include the presence of significant inflammation and oedema, variability in the extent and quality of remyelination in different lesions, and technical factors, such as scanner differences in multi-centre studies.73
In contrast to chronic lesions, acute lesions typically have an early MTR nadir consistent with demyelination followed by partial recovery that is thought, at least partly, to reflect spontaneous remyelination.61 Taking this into account, trials of potential remyelinating agents focusing on acute lesions (as detected by gadolinium-enhancement, for instance) using mean lesion MTR as an outcome measure will need to be able to measure levels of residual (final) MTR in recovered acute lesions, in comparison with NAWM, as the main treatment effect. Power calculations for studies using mean MTR of gadolinium-enhancing (acute) lesions were performed using data from 32 RRMS patients, assuming a mean number of six gadolinium-enhancing lesions per patient, and a mild variance in treatment response between patients, and are summarised in table 2.76
Another approach to analysing lesion MTR involves calculating the MTR for individual lesions, per patient per time point, and following these longitudinally. The simplest method is to follow every lesion detected at baseline over the therapeutic time course, which allows for longitudinal assessment of MTR of individual chronic lesions. This method could also be used for lesions not seen at baseline, but appearing at subsequent time points, effectively allowing longitudinal assessment of MTR of individual acute lesions.
A more novel technique for studying MTR in individual acute lesions has recently been described based on data from a study on autologous haematopoietic stem cell transplantation (ASCT) in 10 patients with aggressive MS.77 Subjects had three MRI scans pre-ASCT, and a number of follow-up scans post-ASCT. The paper described a measure of cumulative change in MTR (ΔMTR), which is the difference between MTR at a time point compared with the first time point, and defined significant changes in ΔMTR according to a method described by Chen et al.8 Voxels were identified as ‘increasing’ (ΔMTR >99th percentile of NAWM ΔMTR), ‘decreasing’ (ΔMTR <1st percentile of NAWM ΔMTR) or ‘stable’ (neither ‘increasing’ nor ‘decreasing’), and this detection method was applied to the entire brain parenchyma. Only groups of five or more changing (‘increasing’ or ‘decreasing’) voxels that overlapped with T2w lesions which were not changing at the previous time point were included, thereby producing a map of newly changing lesions. Newly increasing lesions corresponding to lesions at previous time points with MTR decreases were discarded to avoid accounting for the same lesion multiple times.
The paper also defined two metrics: MTRRecovered, which is the relatively stable MTR value after the recovery phase following the nadir, and MTRDrop, which is the difference in MTR prelesion (ie, at baseline) and postlesion (ie, at follow-up). Both were applied to ΔMTR lesions, as well as gadolinium-enhancing lesions. Approximately a third of gadolinium-enhancing voxels did not correspond to ΔMTR voxels, and ΔMTR voxels were also identified that did not show gadolinium-enhancement. Subjects demonstrating clinical improvement post-ASCT showed significantly improved MTR recovery, whereas those who remained stable clinically showed significantly poorer MTR recovery. Power calculations on these data are summarised in table 2.
It is evident in table 2 that the required sample sizes for acute gadolinium-enhancing lesions are larger than that of all T2w lesions, probably because there is spontaneous partial MTR recovery of the former whereas the latter are assumed to have an unchanged MTR without active treatment. However, the acute and postacute lesions may be more biologically amenable to remyelination.78 In addition, the MTRRecovered and MTRDrop metrics appear to have potentially greater statistical power for detecting treatment effects and correlate with clinical outcomes.
Conclusions
Trials of potential neuroreparative agents are becoming more important in the overall spectrum of MS research and should be designed in order to maximise their sensitivity to true treatment effects. In addition to selecting patient groups with the most potential to show a response, and generating sound sample size calculations that give a trial sufficient power to detect a true effect on the chosen primary outcome measure, imaging outcomes are needed that are feasible from a time and practicality point of view, as well as being sensitive and specific to myelin, while also being reproducible and clinically meaningful.
There are a number of potential outcome measures available for use in such trials (table 3). Some, such as MTR, DTI and MWF, have shown excellent sensitivity to detecting changes in myelin in vivo. However, it is difficult to ascribe the influence of a specific biophysical phenomenon on the MR signal, and this is complicated by the typical coupling of different pathological features, such as inflammation, oedema, axonal loss and demyelination.
Summary of imaging outcomes for remyelination and repair in multiple sclerosis
Given that no one measure demonstrates sufficiently high specificity, reproducibility and correlation with clinical features, it may be useful to employ more than one imaging outcome sensitive to remyelination in future trials, and results from these must be correlated with other measures, especially with functionally relevant clinical outcome measures, in order to better understand their potential to detect myelination and reflect clinically meaningful effects.
At present, in addition to the standard T1w, T2w and gadolinium- enhanced sequences, MTR and a DTI metric such as radial diffusivity (λ⊥) would appear to represent realistic and feasible options to be considered as imaging outcomes in the brain and spinal cord. Clear multi-centre study designs (including both acquisition and analysis procedures) are essential for evaluating the sensitivity and reproducibility needed for detecting changes modulated by treatment response. PET with [11C]PIB and [11C]MeDAS represent promising future imaging modalities, but radiation accumulation will limit the number of repeat studies possible, and further investigation and validation are required to determine their utility, especially in human MS studies.
The optic nerves are frequently affected in MS and demyelination is commonly seen, corresponding well with clinical and paraclinical measures. The afferent visual pathway thus represents an important WM system for studying demyelination and remyelination. VEP can infer demyelination and, although quantitative imaging of the optic nerve is technically challenging, should be correlated when possible with an imaging outcome (such as optic nerve MTR), potentially adding support for the sensitivity of these outcomes to myelination. Although OCT reflects axonal pathology, it should be considered as an adjunct to more intrinsic measures of myelin as it may demonstrate potential neuroprotective effects secondary to remyelination.
References
Supplementary materials
Supplementary Data
This web only file has been produced by the BMJ Publishing Group from an electronic file supplied by the author(s) and has not been edited for content.
Files in this Data Supplement:
- Data supplement 1 - Online figures
- Data supplement 2 - Online references
Footnotes
-
Correction notice This paper was originally published without the correct open access information.
-
Contributors SM drafting of manuscript and revision of manuscript for intellectual content. RSS, CAW-K and DHM revision of manuscript for intellectual content.
-
Funding SM is funded by the MS Society of Great Britain and Northern Ireland and the UK Stem Cell Foundation. The NMR Research unit is supported by the MS Society of Great Britain and Northern Ireland. This work was undertaken at UCLH/UCL who received a proportion of funding from the Department of Health's NIHR Biomedical Centre's funding scheme.
-
Competing interests None.
-
Provenance and peer review Commissioned; externally peer reviewed.