Article Text

Abstract
Background and aims Although aberrant methylation of key genes in the progression of colorectal neoplasia has been reported, no model-based analysis of the incremental changes through the intermediate adenoma stage has been described. In addition, the biological drivers for these methylation changes have yet to be defined. Linear mixed-effects modelling was used in this study to understand the onset and patterns of the methylation changes of SFRP2, IGF2 DMR0, H19, LINE-1 and a CpG island methylator phenotype (CIMP) marker panel, and they were correlated with DNA methyltransferase 3B (DNMT3B) levels of expression in a sample set representative of colorectal neoplastic progression.
Methods Methylation of the above CpG islands was measured using quantitative pyrosequencing assays in 261 tissue samples. This included a prospective collection of 44 colectomy specimens with concurrent normal mucosa, adenoma and invasive cancer tissues. Tissue microarrays from a subset of 64 cases were used for immunohistochemical analysis of DNMT3B expression.
Results It is shown that the onset and pattern of methylation changes during colorectal neoplastic progression are locus dependent. The CIMP marker RUNX3 was the earliest CpG island showing significant change, followed by the CIMP markers NEUROG1 and CACNA1G at the hyperplastic polyp stage. SFRP2 and IGF2 DMR0 showed significant methylation changes at the adenomatous polyp stage, followed by the CIMP markers CDKN2A and hMLH1 at the adenocarcinoma stage. DNMT3B levels of immunohistochemical expression increased significantly (p<0.001) from normal to hyperplastic and from adenomatous polyps to carcinoma samples. DNMT3B expression correlated positively with SFRP2 methylation (r=0.42, p<0.001, 95% CI 0.25 to 0.56), but correlated negatively with IGF2 DMR0 methylation (r=0.26, p=0.01, 95% CI −0.45 to −0.05). A subset of the CIMP panel (NEUROG1, CACNA1G and CDKN2A) positively correlated with DNMT3B levels of expression (p<0.05).
Conclusion Hierarchical epigenetic alterations occur at transition points during colorectal neoplastic progression. These cumulative changes are closely correlated with a gain of DNMT3B expression, suggesting a causal relationship.
- DNA methylation
- colorectal cancer
Statistics from Altmetric.com
Significance of this study
What is already known about this subject?
DNMT3B overexpression has been implicated in aberrant methylation and establishment of CIMP in CRC.
Overexpression of Dnmt3b in a mouse model significantly increased the number of intestinal adenomas and caused loss of imprinting (LOI) with increased expression of Igf2, together with methylation and transcriptional silencing of the tumour suppressor gene Sfrp2.
The frequency of methylated genes increases during colorectal tumour progression from adenomas to adenocarcinomas.
What are the new findings?
DNA methylation changes occur sequentially and at specific transition points during colorectal neoplastic progression.
DNMT3B expression levels increased quantitatively during colorectal neoplastic progression and correlated with levels of DNA methylation.
The combination of SFRP2 and IGF2 DMR0 methylation levels has a sensitivity and specificity of >90% for identifying neoplastic changes in colonic mucosa.
How might it impact on clinical practice in the foreseeable future?
The combination of SFRP2 and IGF2 DMR0 methylation levels, but not CIMP genes, is a potential biomarker for colorectal neoplastic DNA.
Introduction
Colorectal cancer (CRC) is the second leading cause of cancer-related deaths, with a lifetime risk of 1 in 20 in a population eating a Western-style diet (Cancer Research UK, Cancerstats 2005, http://info.cancerresearchuk.org/cancerstats/). A fundamental advantage for understanding the molecular events leading to invasive CRC is the presence of a detectable preinvasive stage.1–3 Colorectal neoplastic progression is caused by a multipathway interplay of genetic and epigenetic changes. The molecular pathway characterising a single cancer is defined by the type of genetic instability and the pattern of epimutations acquired.4 5 In CRC, hypermethylation of CpG islands that included CDKN2A and hMLH1 has been used to define a ‘CpG island methylator phenotype’ (CIMP).6 A panel of five CpG islands (CACNA1G, IGF2, NEUROG1, RUNX3 and SOCS1) was shown to predict CIMP status accurately and was correlated with microsatellite instability (MSI) status and BRAF mutations.7 A subsequent large population-based study compared the above panel of five markers with a larger panel of eight markers that, in addition to the above five markers, included MLH1, CDKN2A and CARBP1. The various combinations of these eight markers are unlikely to misclassify CRC CIMP status especially if they include RUNX3.8 CIMP status associated with distinct clinicopathological and molecular features, was implicated in predicting response to chemotherapy9 and was correlated negatively with the extent of genetic abnormalities in colorectal neoplasia.10 11 Although it has been proposed that CIMP may represent an alternative route for colorectal neoplastic progression and was examined in hyperplastic polyps,12 13 no data are available to define quantitative changes of CIMP and its relationship to BRAF status and MSI across the entire spectrum of matched colorectal neoplastic lesions.
Little is known about the key drivers for sequential DNA methylation changes in CRC progression. Overexpression of the DNA methyltransferase DNMT3B has been implicated in aberrant de novo methylation and establishment of CIMP in CRC.14–16 In the Apcmin mouse model, overexpression of Dnmt3b significantly increased the number of intestinal adenomas and caused loss of imprinting (LOI) and increased expression of Igf2, together with methylation and transcriptional silencing of the tumour suppressor gene Sfrp2.17 IGF2 and SFRP2 have previously been strongly linked to human colorectal neoplasia and so the Dnmt3b mouse model findings may have key relevance for human CRC progression. IGF2 is an imprinted gene which has paternal allele-specific expression. This expression is associated with DNA methylation at CpG-rich regions known as differentially methylated regions (DMRs) in humans and mice.18–21 DMR0 is a DMR located 2 kb upstream of the IGF2 P2 promoter with unknown function, but in normal cells its methylation is determined by a DMR upstream of the neighbouring H19 gene, known as the ICR (imprint control region). The ICR regulates the reciprocal imprinting of IGF2 and H19 by acting as a CTCF (CCCTC-binding factor)-mediated insulator that controls access of the IGF2 and H19 promoters to downstream enhancers.22 23 Previous studies have suggested that LOI of IGF2 in peripheral blood lymphocytes may be a marker of increased cancer risk.24 In these studies, LOI and loss of IGF2 DMR0 methylation have been correlated and linked to increased CRC risk.24 25 However, we have recently shown that IGF2 DMR0 is methylated on the active paternal allele,26 and therefore LOI and loss of methylation at IGF2 DMR0 are independent events. We have also shown that hypomethylation of IGF2 DMR0 is an acquired tissue-specific somatic event in CRC and does not correlate with biallelic IGF2 expression in CRC.27 We therefore aimed to extend these finding by mapping these changes across the colorectal neoplastic spectrum. The SFRP2 tumour suppressor gene is a member of the secreted frizzled protein family that acts as an inhibitor of the Wnt signalling pathway. Therefore, hypermethylation and silencing of the SFRP2 gene may be synergistic with the hyperactive Wnt signalling required for neoplastic development in CRC. Hypermethylation of SFRP2 was identified in aberrant crypt foci, suggesting that it is an early event during human colorectal neoplastic progression.28 SFRP2 was shown to be a potential biomarker for colorectal neoplasia in DNA extracted from tissue and stools.29–32 Although the Dnmt3b mouse model findings support a causal relationship between Dnmt3b and both Sfrp2 and Igf2 aberrant methylation, expression of DNMT3B in human CRC and its correlation with SFRP2 and IGF2 DMR0 in the context of CIMP status, BRAFV600E mutation and MSI status during colorectal neoplastic progression remain unknown.
Although previous studies have examined methylation from normal mucosa, hyperplastic polyps, adenomas and adenocarcinomas, these studies have not been able to define precisely the hierarchy of methylation events that occurs during CRC progression.2 33–35 Therefore we set out to develop quantitative assays for CIMP markers and other targets, and used statistical models to define the onset of methylation events in the transition from normal mucosa representative of low-risk and high-risk patients with CRC to hyperplastic polyps to adenomas to primary and metastatic adenocarcinomas. Knowledge of the precise hierarchy of the progression patterns of DNMT3B, CIMP and DNA methylation changes of other implicated targets such as SFRP2 and IGF2 DMR0 would refine the choice of appropriate biomarkers for early detection as well as expand our understanding of the carcinogenic process. Studies that collect human tissue samples from preinvasive lesions with follow-up and collection of their corresponding invasive stage would be unethical. Coincident preinvasive and invasive tissue samples collected from the same colectomy specimen provide an alternative representing a snap-shot of the progression of events associated with normal to adenoma to carcinoma transitions since these share the same genetic composition and environmental conditions as the samples which were collected from segmental resections (Supplementary tables 1 and 2). We therefore collected a unique well-characterised set of matched normal tissue, preinvasive, invasive and metastatic colorectal neoplastic lesions from surgically resected specimens and mapped DNA methylation changes of a CIMP marker panel (CACNA1G, NEUROG1, RUNX3, SOCS1, MLH1 and CDKN2A) as well as SFRP2 and IGF2 DMR0 quantitatively in this sample set (IGF2 DMR0 is ∼9 kb upstream of the IGF2 CpG island examined by Weisenberger et al7 and therefore is not part of our CIMP panel). We correlated DNA methylation data from the most informative targets with expression levels of DNMT3B in the progression of colorectal neoplasia. We also correlated these DNA methylation changes with both BRAFV600E mutation and MSI status. We finally examined the relationship between DNA methylation at these loci and LINE-1 repeat elements, which we have previously shown to reflect global changes in DNA methylation during CRC progression.36
Materials and methods
Clinical sample collection
Two independent sample sets were collected from colectomy surgical specimens. The first set of samples (CRC1, n=119) was obtained from 94 patients with invasive colorectal primary carcinoma with or without evidence of metastatic cancer deposits. The CRC1 sample set comprised normal colonic mucosa (n=22), primary adenocarcinoma (n=65) and liver metastatic deposits (n=32). The second set (CRC2, n=133) comprised samples from normal colonic mucosa (n=62), hyperplastic polyps (n=7), adenomatous polyps (n=27) and primary adenocarcinoma samples (n=37) from a set of 44 patients presenting with synchronous adenoma and invasive carcinoma. Normal tissue samples were collected at 5 cm and 20 cm (where available) from the carcinoma and were defined as high-risk mucosa. It has been suggested that an epigenetic field effect is present in the ‘normal’ mucosa of individuals with colorectal neoplasia37; therefore, we collected normal mucosa from patients undergoing colectomy for diverticular disease (n=9) who had no previous or present history of CRC. These samples were defined as low-risk normal mucosa and were compared with the high-risk ‘normal’ mucosa. The number and size of any polyps present were prospectively recorded at the time of sampling. The histological features and cellularity of all tissue samples were assessed by microscopic examination of tissues sampled immediately adjacent to the site of sampling fresh tissues. Samples were collected within the histopathology department and the tissue bank facility within Addenbrooke's Hospital (Cambridge, UK) and a subset of CRC1 cases (n=77) was obtained from Ohio State University where colonic normal, primary and metastatic adenocarcinoma tissue samples were microdissected. Ethical approval for all the work conducted was obtained from Cambridgshire local research ethics committee (LREC ref. 04/Q0108/125 and 06/Q0108/307).
Tissue microarray (TMA) construction and immunohistochemistry
TMAs were constructed using multiple (2–4) replicate tissue cores from 64 cases (23 and 41 from CRC1 and CRC2, respectively). Samples were selected on the basis of availability of paraffin blocks with adequate cellularity. H&E slides of all the cases were reviewed, marked and used to guide the sampling from morphologically representative regions of the tissue blocks. Paraffin-embedded blocks were sectioned at 5 μm thickness and were deparaffinised and rehydrated using xylene and alcohol. Antigen retrieval was performed using EDTA buffer (pH 9.0) at 100°C for 15 min. Primary monoclonal antibody for DNMT3B (diluted 1:40) from Imgenex (San Diego, California, USA) was used.16 Antibody detection was performed using streptavidin–biotin labelling. Visualisation was achieved using the di-amino benzidine chromagen method (Dako, Cambridge, UK). All slides were reviewed blinded to clinical outcome and other experimental data. The strength of staining was semi-quantitatively scored as negative cytoplasmic and nuclear staining (0), weakly positive patchy cytoplasmic with occasional nuclear staining (1), moderately positive cytoplasmic and nuclear staining (2) and strongly positive diffuse cytoplasmic and nuclear staining (3) by a consultant histopathologist with specialist interest in CRC (AI).
Microsatellite stability assessment
Ten microsatellite markers previously validated for CRC MSI testing38 were used, including a panel of five microsatellite markers recommended by the NCI Bethesda panel (BAT25, BAT26, D5S346, D2S123 and D17S25039). Genomic DNA was amplified by PCR (Supplementary table 3) and the products were analysed on a DNA sequencer as previously described.39 The data were analysed using GeneMapper Software from Applied Biosystems (Warrington, UK).
DNA extraction and bisulfite modification
High molecular weight DNA was isolated using a proteinase K/phenol extraction method. Sodium bisulfite conversion of DNA was performed using the EZ DNA Methylation-Gold Kit (Zymo Research, Cambridge, UK) using the manufacturer's protocol.
Pyrosequencing
Bisulfite-modified DNA was amplified by PCR using the primers described in Supplementary table 4 and reagents supplied by Applied Biosystems in a 25 μl reaction volume. A 10 μl aliquot of each PCR product was transferred to a new 96-well plate and pyrosequencing was performed following the manufacturer's protocol and as previously described.26 27 Negative controls recommended by the manufacturer were used, as well as positive controls that included DNA in vitro methylated using SssI methylase (New England Biolabs, Hitchin, UK) following the manufacturer's instructions; hypomethylated DNA was generated through PCR and a mixture of equal volumes of the above methylated and unmethylated controls. The methylation quantification was analysed by PSQ HS 96A SNP and Pyro Q-CpG Software (Biotage, Uppsala, Sweden). Samples that did not meet bisulfite conversion or pyrosequencing quality control checks were excluded.
Statistical analysis
We used a recursive partitioning technique and linear discriminant analysis (LDA) using the R packages Party and MASS.40 41 A modified version of the R package ALL was used to generate image plots of the methylation data within the R statistical environment.42 We used linear mixed-effects modelling of the data to account for the fact that multiple samples belong to one patient and to account for correlated errors (as our pyrosequencing data are not independent measurements with a subset of samples that are matched normal, adenoma and carcinoma samples). We used the Akaike Information Criterion43 to identify the model that best explains the differences between the groups (low- and high-risk normal mucosa, hyperplastic polyps, adenomas, primary and metastatic carcinomas). A complete transcript of the statistical analysis is provided as a Sweave document44 45 in the Supplementary Material.
Results
CIMP in normal to hyperplastic and adenomatous polyps to carcinoma transitions
To examine quantitatively the CpG island methylation changes during colorectal neoplastic progression, we developed pyrosequencing assays that included the CIMP panel markers CACNA1G, SOCS1, RUNX3, NEUROG1, MLH1 and CDKN2A. In order to assess the role of CIMP in the progression of colorectal neoplasia, we examined 261 colorectal tissue samples comprising 9 low-risk normal colorectal mucosa, 84 normal colonic mucosa from patients with CRC, 7 hyperplastic polyps, 27 adenomatous polyps, 102 primary adenocarcinoma and 32 liver metastatic deposits. Samples defined in the study as low risk for CRC were collected from normal mucosa from patients undergoing colectomy for diverticular disease who had no previous or present history of CRC. Methylation data for 265 DNA samples (including four control samples) are shown in figure 1. For the CIMP marker genes, similar levels of CpG methylation were observed between the pathological categories and there was not a strong correlation with normal mucosa to adenoma to carcinoma progression. High levels of CpG methylation of the CIMP markers were observed in a subset of adenocarcinomas including three metastatic tissue samples (26.1%, n=35). Hierarchical clustering analysis showed this subset to cluster together (Supplementary figures 1,2). Previous definitions of CIMP lacked accurate CIMP status reproducibility as they relied on either semi-quantitative methods to examine levels of DNA methylation6 or quantitative methods that were dependent on standardisation that relied on efficiency of in vitro methylated controls.7 We therefore developed a set of quantitative pyrosequencing assays which, in combination with discriminant coefficients and coordinates of the centres of the CIMP groups derived from LDA, can classify new cases into CIMP-positive or CIMP-negative groups based on minimum distance criteria (Supplementary Sweave document and Supplementary figure 2). Future studies are required to validate, refine and establish these criteria for defining CIMP status. All carcinomas showing hypermethylation of CDKN2A were classified as CIMP positive by LDA, emphasising the high specificity of CDKN2A in identifying CIMP-positive status. In addition, the CIMP markers RUNX3, CDKN2A and NEUROG1 showed a trend to progressive hypermethylation with neoplastic development (figure 2). We argue that the method used to cluster cases according to their CIMP status has implications for the definition of CIMP. Interestingly, the CIMP-positive cases showed a wider spread that could reflect CIMP high and CIMP low distribution within the same cluster. In contrast, CIMP-negative cases clustered closely together (Supplementary figure 2). Notably, the CRC cell line HCT116 (top row, figure 1) showed widespread hypermethylation of all targets tested including IGF2 DMR0, thus underscoring that the methylation data from cancer cell lines are not representative of primary CRC tissue.

Image plot showing pyrosequencing CpG methylation data from 265 DNA samples; the data are grouped by pathological category from the bottom upwards (9 samples from low-risk normal mucosa (LRN), 84 samples of high-risk normal (HRN) colonic mucosa, 7 hyperplastic polyps (HP), 27 adenomas, 102 primary colorectal adenocarcinomas, 32 metastatic adenocarcinoma tissue samples and 4 control samples comprising in vitro methylated DNA, an equal mix of in vitro methylated DNA and unmethylated DNA, unmethylated DNA and the HCT116 colorectal cancer cell line). Each column represents the methylation data for each CpG dinucleotide analysed by pyrosequencing and the average level of methylation across the analysed CpG dinucleotides for each gene (SFRP2, IGF2 DMR0, CACNA1G, CDKN2A, MLH1, SOCS1, RUNX3, NEUROG1, LINE-1 repeat element and H19). Rows represents individual samples. The scale shown at the right side of the figure represents the percentage of CpG methylation as detected by pyrosequencing. White spaces within the plot indicate missing values due to failure of samples to meet either bisulfite conversion or pyrosequencing controls or due to lack of DNA.

Each bean-plot represents the data for a CpG island. Samples are as follows: LRN, low-risk normal mucosa from patients with no history of colorectal cancer (CRC); HRN, high-risk normal mucosa from patients presenting with CRC; HP, hyperplastic polyps; Ad, dysplastic adenomas; pT, primary colorectal adenocarcinoma; M, metastatic colorectal carcinoma. Individual observations are shown as small horizontal lines in a one-dimensional scatter plot together with the estimated density of the distributions (visible as a diamond-shaped outline), the average for each sample subset (solid horizontal line) and the overall average (solid horizontal line across all samples). The dotted line represents the trend of the coefficients (marked on the plot as X) that are derived from the linear mixed-effects model.
DNMT3B expression levels increased quantitatively during colorectal neoplastic progression and correlated with levels of DNA methylation
Conditional overexpression of Dnmt3b1 in Apcmin mice has previously been shown to enhance the number of intestinal adenomas significantly.17 A previous study also showed that DNMT3B expression was correlated with CIMP status in human carcinomas.16 To address the question of when DNMT3B immunohistochemical expression was significantly altered in the normal colorectal mucosa to adenocarcinoma progression sequence, we used a linear mixed-effects model combining type of tissue, within- and between-subjects comparisons, and quantitative methylation changes of CIMP markers and other targets. Use of the linear mixed-effects model allowed us to test the hypothesis that there was a significant stepwise increase in DNMT3B expression in the transition from normal colorectal mucosa to hyperplastic polyps to adenomas to carcinomas while accounting for within-subject comparisons. Figure 3 shows that DNMT3B levels of immunohistochemical expression increased significantly (p<0.001 linear mixed-effects model) from normal to hyperplastic polyps to adenomas to carcinomas. This also correlated significantly and positively with a quantitative increase in the amount of DNA methylation of a subset of the CIMP panel (NEUROG1, CACNA1G and CDKN2A) but not SOCS1, RUNX3 or MLH1 (p<0.05, Pearson correlation test). The quantitative increase of DNMT3B correlated significantly with both increasing size and grade of the adenomas, as well as increasing cancer stage (p<0.001, linear regression analysis). The DNMT3B intensity coefficients from the linear mixed-effects model showed significantly increased expression in the transition from normal (0.62, n=43) to adenoma (0.90, n=17) to carcinoma (1.79, n=58) tissues. Interestingly, the coefficient of DNMT3B expression was higher in hyperplastic polyps (0.96, n=5) compared with adenomatous polyps. This was associated with higher average levels of DNA methylation of CACNA1G, CDKN2A, MLH1, H19 and RUNX3. In addition to the differences in the staining intensity, there were also differences in the pattern of staining, with adenocarcinomatous epithelium showing a more diffuse widespread labelling pattern (figure 3F,G). This contrasted with a normal tissue gradient pattern being strongest at the luminal surface epithelium and mostly cytoplasmic in subcellular localisation, coupled with little or no staining at the base of the colonic crypts (figure 3B,C). The adenomatous dysplastic tissue cores showed an intermediate pattern with stronger cytoplasmic and occasional nuclear staining (figure 3D,E). Consistent with the findings in the inducible Dnmt3b mouse model that showed Dnmt3b expression to be strongly correlated with increased methylation levels of Sfrp2, LOI and overexpression of Igf2,17 we show that the correlation between DNMT3B expression and DNA methylation was most significant for SFRP2 and IGF2 DMR0. Expression of DNMT3B positively correlated with SFRP2 methylation (r=0.42, p<0.001, 95% CI 0.25 to 0.56), but correlated negatively with IGF2 DMR0 methylation (r=−0.26, p=0.01, 95% CI −0.45 to −0.05), suggesting that IGF2 DMR0 methylation is not directly regulated by overexpression of DNMT3B and that other mechanisms may be involved.
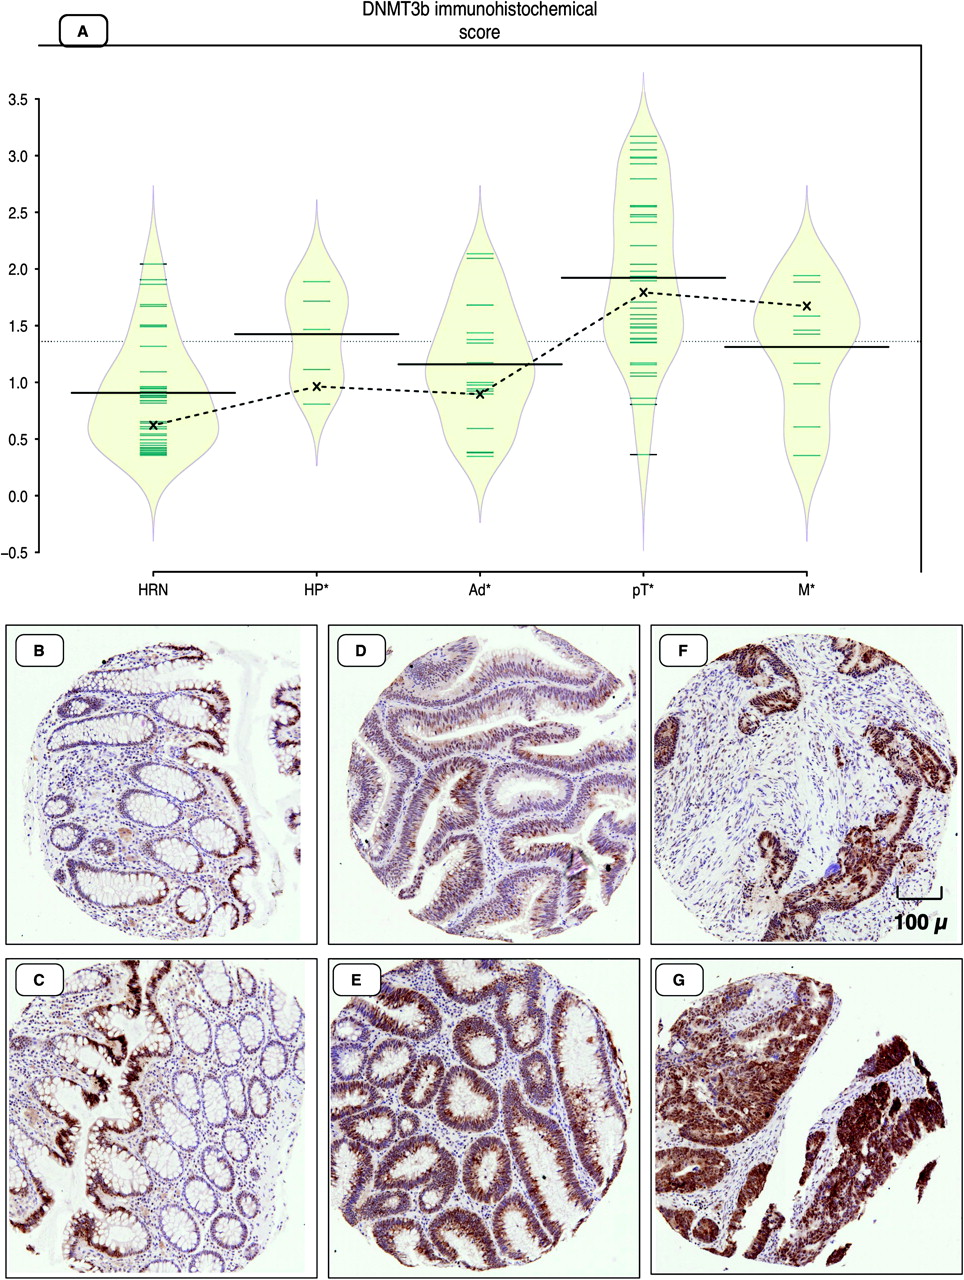
(A) Bean-plot representing levels of immunohistochemical expression of DNMT3B in high-risk normal mucosa (HRN), hyperplastic polyps (HP), adenomatous tissue (Ad), primary (pT) and metastatic (M) adenocarcinoma tissue. (B–G) Immunohistochemical staining for DNMT3B: (B, C) normal colonic mucosal tissue, (D, E) adenomatous polyps, (F, G) adenocarcinoma tissue cores. Individual observations are shown as small horizontal lines in a one-dimensional scatter plot together with the estimated density of the distributions (visible as a diamond-shaped outline), the average for each sample subset (solid horizontal line) and the overall average (solid horizontal line across all samples). The dotted line represents the trend of the coefficients (marked on the plot as X) that are derived from the linear mixed-effects model.
SFRP2 and IGF2 DMR0 methylation levels can be used as biomarkers of neoplastic DNA
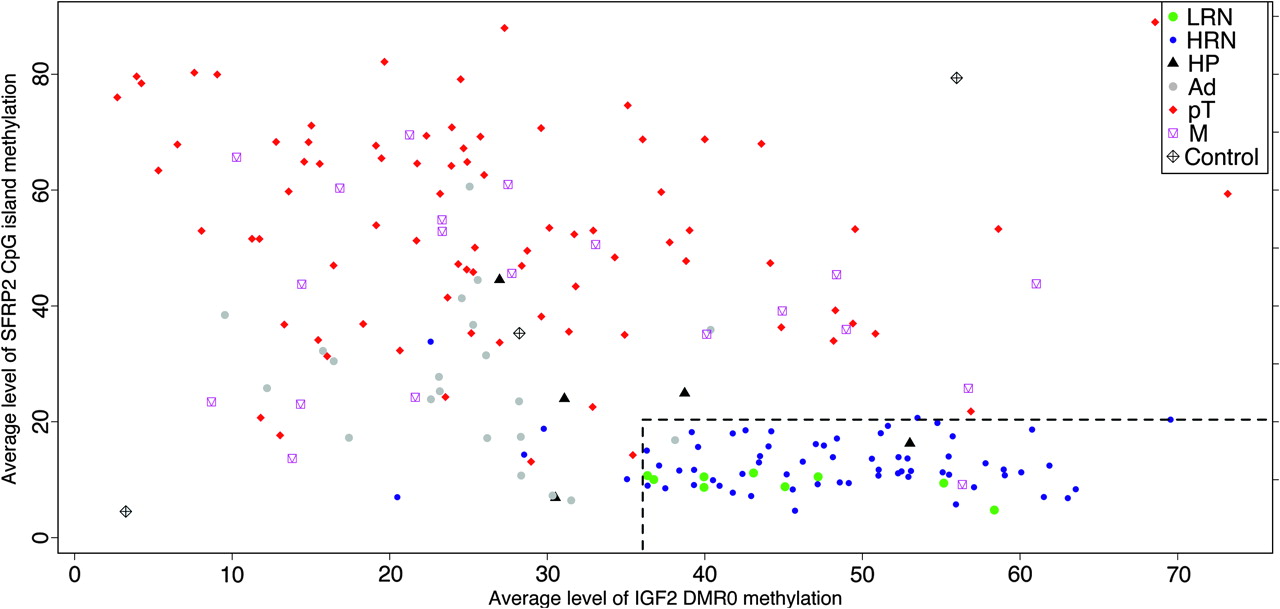
With the exception of the CIMP-positive cases, all the CIMP panel markers showed marked overlap between normal, adenoma and carcinoma groups (figure 2), and therefore are not ideal biomarkers of either early preinvasive or invasive neoplastic lesions. However, the methylation status of SFRP2 and IGF2 DMR0 has previously been shown to be an early biomarker of colorectal neoplastic predisposition and progression.24 27 28 We therefore included assays for these genes together with the six CIMP markers. To identify the most informative biomarkers from this set that correlate with neoplastic development, we used recursive partitioning across the entire tissue and methylation data set to identify the average CpG island methylation thresholds that predict the largest discrimination between normal and neoplastic DNA. Methylation levels of SFRP2 and IGF2 DMR0 classified normal and neoplastic DNA with 100% sensitivity (95% CI 93.2 to 100.0) and 90.5% specificity (95% CI 69.6 to 98.8) when using methylation threshold levels of 20.67% for SFRP2 and 35.43% for IGF2 DMR0 average methylation levels (Supplementary figure 3). Using these criteria, none of the 102 primary adenocarcinomas was misclassified (figure 4). In addition, there was a stepwise change in both SFRP2 and IGF2 DMR0 levels of CpG methylation from normal to adenomatous to carcinomatous tissue, as shown in the bean-plots in figure 2, which were statistically significant for a subset of the between-groups comparisons. The average level and the linear mixed-effects model coefficient of SFRP2 methylation were higher in high-risk normal mucosa compared with low-risk normal mucosa (figure 2). We compared the performance of this combination of SFRP2 and IGF2 DMR0 methylation levels against other published potential biomarkers (Supplementary table 5).
Correlation of SFRP2 and IGF2 DMR0 DNA methylation data for normal colorectal tissue (low-risk normal (LRN) and high-risk normal (HRN) mucosa), hyperplastic polyps (HP), adenomas (Ad), primary carcinomas (pT) and metastatic carcinomas (M). There is an inverse relationship between the levels of SFRP2 and IGF2 DNA methylation. Controls are unmethylated, a methylated and unmethylated mixture as well as methylated spikes (bottom left, centre and top right, respectively). The dashed lines represent the methylation percentage identified by recursive partitioning to discriminate normal from neoplastic DNA.
CIMP markers, SFRP2 and IGF2 DMR0 methylation changes in the context of global CpG methylation changes in neoplastic progression
As methylation of DNA repetitive elements, such as LINE-1, can be used as a surrogate marker of genome-wide methylation changes,46 we used a LINE-1 pyrosequencing assay in tissues from normal mucosa, adenomas and carcinomas to precisely measure progressive methylation changes during colorectal neoplastic progression and to estimate global methylation changes in normal, adenoma and carcinoma tissues.36 Although the mean LINE-1 DNA methylation levels for normal mucosa (mean 68.24%) was higher than that of adenomas (mean 65.5%), the difference was not significant (linear mixed-effects model). However, there was a significant decrease in LINE-1 methylation seen in the transition from adenomas to adenocarcinomas (mean 60.4%, p=0.01, linear mixed-effects model) (figure 2). The number of successfully analysed hyperplastic polyps was too small to be included in the analysis.
Methylation levels of only two of the CIMP markers (CDKN2A and NEUROG1) showed significant albeit weak negative correlation (r=−0.18, p=0.04, 95% CI −0.34 to −0.01 and r=−0.21, p=0.02, 95% CI −0.37 to −0.03, respectively, Pearson correlation test) with LINE-1 methylation levels across the sample set. Methylation of SFRP2 correlated negatively with LINE-1 methylation (r=−0.50, p<0.001, 95% CI −0.62 to −0.36, Pearson correlation test) and methylation of IGF2 DMR0 positively correlated with LINE-1 methylation (r=0.57, p<0.001, 95% CI 0.43 to 0.69, Pearson correlation test). The variance of the level of methylation of LINE-1 within the normal tissue sample set (SD=1.98) was less than the variance of those within the carcinoma sample set (SD=8.20), and this was intermediate for the adenoma sample set (SD=3.30). Interestingly, there was no significant difference in levels of DNA methylation of LINE-1 or any of the remaining CpG islands between normal mucosa collected at 5 cm and 20 cm away from the carcinoma.
Correlation between IGF2 DMR0 loss of methylation and H19 ICR levels of methylation
We have previously shown that biallelic expression of IGF2 was correlated with hypomethylation of both IGF2 and H19 DMR0 in CRC tissues as compared with controls.27 We therefore examined the relationship between IGF2 DMR0 and H19 levels of methylation in the transition from normal mucosa to hyperplastic polyps to adenomas to adenocarcinomas. There was no correlation between the levels of methylation of IGF2 DMR0 and ICR of H19 (Supplementary figure 4), although within the subset of normal samples there was a positive correlation (r=0.43, p<0.001, Pearson correlation test). However, loss of methylation at DMR0 of IGF2 was associated with greater variance of H19 ICR methylation.
CIMP markers, MSI, BRAF status and clinicopathological covariates in the progression of colorectal neoplasia
As expected, there was a strongly significant correlation (r=0.376, p<0.001, Spearman rank correlation test) between MSI-H and CIMP+ status. MSI-H status was significantly associated with MLH1 hypermethylation (r=0.148, p<0.001, Spearman rank correlation test) (Supplementary figure 5). As BRAFV600E mutation has been previously described to be strongly correlated with CIMP status, we assayed 188 tissue samples (a subset for which DNA was available) and identified 11 samples with the V600E mutation. BRAFV600E mutation correlated positively and significantly with CIMP status (r=0.279, p<0.001, Spearman rank correlation test). Interestingly, in two patients (CRC2-002 and CRC2-017), BRAFV600E mutations were conclusively identified in a single adenoma and a hyperplastic polyp, respectively, but were not present in the corresponding carcinomas from the same colectomy specimens. The distribution of CIMP, MSI and BRAFV600E mutation status together with clinicopathological covariates is shown in table 1.
Distribution of clinicopathological covariates by CpG island methylator phenotype (CIMP) status in carcinomas
There was a higher proportion of CIMP-positive status within primary tumours compared with metastatic tumours (31.37% and 9.38%, respectively, p=0.025, Pearson χ2 test). There was no significant correlation of CIMP status with age, sex or TNM stage.
Discussion
Colorectal cancer is a multistep multipathway process involving progressive functional disruption of tumour-related genes, with a CIMP-positive subset of CRC characterised by concordant hypermethylation of specific CpG island loci.3 5 Previous studies have shown a significant correlation between DNMT3B overexpression and CIMP-positive status.16 We show that DNMT3B expression correlates with CpG methylation of a subset of CIMP markers and other targets such as SFRP2 and IGF2 DMR0 in a hierarchical pattern during the progression of colorectal neoplasia. The causal relationship between DNMT3B overexpression and changes in DNA methylation are not well understood, but could be related to the affinity of DNMT3B binding to cis-acting elements similar to that suggested for DNMT1. The DNMT1 methylation-prone sequences were present at CpG islands associated with gene promoters while the DNMT1 methylation-resistant sequences were randomly distributed along the genome47; however, DNMT3B-specific data are not available. Using statistical models we also show that increased DNMT3B expression is an early event in colorectal neoplastic progression, with a significant increase at the hyperplastic polyp stage compared with background normal mucosa. DNMT3B expression and DNA methylation levels for a subset of genes were higher in hyperplastic polyps compared with adenomatous polyps. This is in keeping with the well-recognised role of DNA methylation in the progression of colorectal neoplasia through the hyperplastic/serrated pathway.48 The mechanisms underlying DNMT3B overexpression are not clear, but potential causes include increased expression of trans-acting transcription factors, downregulated microRNAs such as miR-29 and increased stability of the DNMT3B transcript through interaction with the HuR protein (reviewed by Veeck and Esteller49). Interestingly, not all genes accumulated CpG methylation at an equal rate and similar onset. The CIMP marker RUNX3 was the earliest locus to show progressive significant change from low-risk to high-risk normal mucosa, followed by the CIMP markers NEUROG1 and CACNA1G at the hyperplastic polyp stage, followed by SFRP2 and IGF2 DMR0 at the adenomatous polyp stage. The CIMP markers CDKN2A and MLH1 as well as the repeat element LINE-1 were the last to become significantly hypermethylated and hypomethylated, respectively, at the adenocarcinoma stage. Notably, SOCS1, although a CIMP marker, did not show any significant changes in levels of methylation between the different stages. The lack of a consistent correlation between the CIMP markers' levels of methylation and DNMT3B levels of expression across the neoplastic stages suggest the possibility that specific CIMP targets may require additional factors other than DNMT3B. Furthermore DNMT3B overexpression and SFRP2 (not a CIMP marker) showed stronger correlation during the progression from normal mucosa to adenoma to adenocarcinoma.
Our data show that in CRC, DNA methylation at the H19 ICR fluctuates between individuals, but does not progressively increase or decrease in adenomas and adenocarcinoma, unlike the IGF2 DMR0. The incidence of IGF2 DMR0 hypomethylation in cancer is higher than the incidence of biallelic IGF2 expression,27 which strongly implies that IGF2 DMR0 hypomethylation is a marker of cancer in its own right, rather than a surrogate marker of the IGF2 LOI tumour-promoting effect. Indeed in our present study, IGF2 DMR0 hypomethylation occurs quantitatively and progressively in the transition from normal to adenoma to adenocarcinoma. Importantly, levels of methylation at the IGF2 DMR0 were not different between mucosa from patients with CRC and from those with no evidence of colorectal neoplasia. These differences from previously published data25 may be explained by the use of a quantitative CpG methylation assay here. Interestingly, IGF2 DMR0 hypomethylation precedes LINE-1 hypomethylation (which classically has been considered to be the marker for hypomethylation in cancer36) in the progression of colorectal neoplasia (figure 2). We show that IGF2 DMR0 positively correlates with LINE-1 methylation (r=0.57, p<0.001, 95% CI 0.43 to 0.69). Baba et al50 also showed a similar positive but weaker correlation (r=0.29, p<0.0001, Pearson correlation coefficient). One potential explanation for our higher correlation is that we examined different CpG dinucleotides within the IGF2 DMR0 locus (Supplementary table 4) and have excluded a non-informative CpG dinucleotide that is resistant to pyrosequencing analysis as it lies within a homopolymeric sequence tract. Another potential explanation is the higher number of matched data points—that is, normal, polyp and cancer—from the single individual in our data set as opposed to only normal and cancer in the data set of Baba et al. We also show that progressive reduction of global levels of methylation (as assessed by LINE-1 methylation) is associated with neoplastic progression. Reduced global levels of methylation have been shown to enhance genomic instability and mobility of transposable elements,51 and in several mouse models genomic hypomethylation was shown to induce tumourigenesis.52 LINE-1 hypomethylation was also shown to be associated with shorter survival in patients with CRC, independent of other prognostic factors.53 The differences between normal and adenoma, as well as adenoma and carcinoma, were significant and imply a cumulative effect of abnormally functioning methylation machinery. We show an inverse relationship between LINE-1 levels of methylation and a subset of CIMP genes for all samples, but no significant relationship for primary carcinomas was found in our data set. This is in contrast to the findings of Ogino et al54 who showed LINE-1 hypomethylation to be inversely associated with CIMP in CRC. In this previous study the authors used different methodologies to assess levels of methylation of CIMP markers and LINE-1. We used the same methodology to assess all loci examined, and this may account for the differences in the results.
We used pyrosequencing methylation assays; the use of quantitative methods could be critical for meaningful detection of DNA methylation changes during colorectal neoplastic progression. This is exemplified by a similar smaller study33 that examined CpG island methylation in a selected panel of genes (APC, THBS1, MGMT, hMLH1 and GSTP1) that showed that the frequency and patterns of CpG methylation did not differ between adenomas and carcinomas. The methodology used was non-quantitative methylation-specific PCR (MSP) and it is likely that this method was not able to resolve small but significant quantitative differences between adenomas and carcinomas. This is supported by a recent study that examined non-matching normal and adenomatous tissue from 11 patients using quantitative MSP.55 Using pyrosequencing, we were able to detect an increase in the levels of methylation from normal to adenoma to carcinoma despite abnormal methylation being present within the adenomas and matching carcinomas. We also use statistical models to account for correlated errors resulting from repeated measurements and matched samples for more appropriate data analysis.
Finally, we show here that use of a combination of SFRP2 and IGF2 DMR0 methylation levels has a sensitivity and specificity of >90% for identifying neoplastic changes in colonic mucosa. However, we accept that the IGF2 DMR0 and SFRP2 thresholds used may be overfitted to our data, and future studies are required to validate these cut-off points. Methylation and epigenetic regulation of SFRP2 is strongly associated with colorectal neoplasia as well as being detectable using faecal DNA.29 30 32 56 57 SFRP2 encodes an inhibitor of the Wnt signalling pathway that has a region homologous to the frizzled receptor including a cysteine-rich domain that binds and sequesters Wnt.58 IGF2 LOI has also been strongly implicated in the risk assessment of colorectal neoplasia.24 We also showed that these changes are quantitatively cumulative in the progression of colorectal neoplasia and we showed a similar pattern of aberrant DNA methylation in human tissue similar to a recently described mouse model in which Dnmt3b was inducibly overexpressed. Others have shown that methylation changes in faecal DNA correlate with levels of methylation of DNA isolated from corresponding tissue samples.30 57 Use of these two biomarkers in CRC screening will require further development of robust measurement techniques and prospective evaluation in clinical trials using both tissue samples and matched faecal DNA samples.
Acknowledgments
We would like to acknowledge the help of Will Howat, at the Histopathology core facility within Cancer Research UK, Cambridge Research Institute in making the tissue microarrays. We also acknowledge the help of the Tissue Bank facility in Addenbrooke's hospital funded through the NIHR Biomedical Research Centre.
References
Supplementary materials
Online only appendix
Files in this Data Supplement:
Footnotes
Funding AI was funded by a Cancer Research UK Bobby Moore fellowship.
Competing interests None.
Ethics approval This study was conducted with the approval of the Cambridgeshire 2 Research Ethics Committee.
Provenance and peer review Not commissioned; externally peer reviewed.