

Abstract
Studies in humans with Down syndrome (DS) show that alterations in fetal brain development are followed by postnatal deficits in neuronal numbers, synaptic plasticity, and cognitive and motor function. This same progression is replicated in several mouse models of DS. Dp(16)1Yey/+ (hereafter called Dp16) is a recently developed mouse model of DS in which the entire region of mouse chromosome 16 that is homologous to human chromosome 21 has been triplicated. As such, Dp16 mice may more closely reproduce neurodevelopmental changes occurring in humans with DS. Here, we present the first comprehensive cellular and behavioral study of the Dp16 forebrain from embryonic to adult stages. Unexpectedly, our results demonstrate that Dp16 mice do not have prenatal brain defects previously reported in human fetal neocortex and in the developing forebrains of other mouse models, including microcephaly, reduced neurogenesis, and abnormal cell proliferation. Nevertheless, we found impairments in postnatal developmental milestones, fewer inhibitory forebrain neurons, and deficits in motor and cognitive performance in Dp16 mice. Therefore, although this new model does not express prenatal morphological phenotypes associated with DS, abnormalities in the postnatal period appear sufficient to produce significant cognitive deficits in Dp16.
SIGNIFICANCE STATEMENT Down syndrome (DS) leads to intellectual disability. Several mouse models have increased our understanding of the neuropathology of DS and are currently being used to test therapeutic strategies. A new mouse model that contains an expanded number of DS-related genes, known as Dp(16)1Yey/+ (Dp16), has been generated recently. We sought to determine whether the extended triplication creates a better phenocopy of DS-related brain pathologies. We measured embryonic development, forebrain maturation, and perinatal/adult behavior and revealed an absence of prenatal phenotypes in Dp16 fetal brain, but specific cellular and behavioral deficits after the first 2 postnatal weeks. These results uncover important differences in prenatal phenotype between Dp16 animals and humans with DS and other DS mouse models.
Introduction
Down syndrome (DS), caused by trisomy of 400–600 coding and noncoding genes on human chromosome 21 (Hsa21), occurs with an incidence of 1 in 691 live births (Canfield et al., 2006; Cocchi et al., 2010; Sturgeon and Gardiner, 2011) and leads to intellectual disability (Chapman and Hesketh, 2000). Studies on postmortem brains of individuals with DS have reported prenatal and postnatal abnormalities, indicating that complex changes to the genetic landscape lead to the cellular defects underlying the morphological and cognitive symptoms of DS (Haydar and Reeves, 2012).
To study the etiology of DS, several mouse models have been generated by exploiting syntenic regions within the human and mouse genomes. Specifically, Hsa21 genes are conserved in orthologous regions of mouse chromosomes (Mmu) 10, Mmu16, and Mmu17, the largest of which is on Mmu16. Therefore, several mouse models containing a varying number of triplicated Mmu16 genes were created to elucidate the cellular, molecular, physiological, and behavioral deficits in DS (Das and Reeves, 2011). Studies on such mice, namely Ts65Dn, Ts1Cje, and Ts16, have reported prenatal brain abnormalities, including reduced proliferation and neurogenesis, delayed neocortical expansion, and microcephaly (Haydar et al., 1996; Haydar et al., 2000; Chakrabarti et al., 2007; Ishihara et al., 2010). These reductions in proliferation and brain growth closely match changes found in the brains of human fetuses with DS (Sylvester, 1983; Golden and Hyman, 1994; Contestabile et al., 2007; Guidi et al., 2008, 2011; Larsen et al., 2008). In both humans and mouse models, forebrain changes have also been found in the immediate postnatal period and during adulthood, including altered ratios of inhibitory and excitatory neurons, synaptic dysfunction, and motor and cognitive behavioral impairments (Schmidt-Sidor et al., 1990; Wisniewski, 1990; Koo et al., 1992; Golden and Hyman, 1994; Belichenko et al., 2004; Kleschevnikov et al., 2004; Best et al., 2007; Chakrabarti et al., 2007, 2010).
In addition to Ts65Dn, Ts1Cje, and Ts16, new mouse models have been developed recently to better replicate the triplication of the genes that map to Hsa21. These mice are designed to carry individual duplications spanning the entire Hsa21 syntenic regions on Mmu10, Mmu16, or Mmu17 [Dp(10)1Yey/+, Dp(16)1Yey/+, and Dp(17)1Yey/+, respectively] (Li et al., 2007; Yu et al., 2010). Among these, Dp(16)1Yey/+ (hereafter called Dp16) offers the following advantages: (1) its trisomic region consists of the entire Hsa21-relevant complement of Mmu16 genes (n = 119), ∼15 more than Ts65Dn (NCBI); (2) Dp16 males are fertile, eliminating the potential confound of a trisomic maternal uterine environment; and (3) in contrast to Ts65Dn, only Hsa21 syntenic genes are triplicated in Dp16 (Duchon et al., 2011). Because of these improvements in genetics and fertility, Dp16 may be a preferred mouse model of DS in future studies (Gardiner, 2015).
Several recent studies examining postnatal development in Dp16 mice have found agenesis of the cerebellum and craniofacial dysmorphology, as well as impairments in learning and memory (Yu et al., 2010; Starbuck et al., 2014). These results clearly indicate that Dp16 animals replicate some of the defects found in other mouse models, yet assessments of prenatal brain growth and extensive behavioral phenotyping have not been conducted, preventing a comprehensive comparison with Ts65Dn and other mouse models of DS and with humans with DS. Therefore, to further understand the impact of the larger syntenic region present in Dp16, we performed a comprehensive analysis of prenatal forebrain development combined with neonatal and adult behavioral studies. Unexpectedly, we found that Dp16 forebrain growth was not different from euploid littermate controls. Despite the lack of prenatal cellular deficits, we measured significant delays in late-acquisition developmental milestones and changes in the number of inhibitory forebrain neurons. These defects were followed by altered motor function and cognitive performance in adults. Therefore, Dp16 may be a good model with which to investigate the postnatal causes of intellectual disability in DS, but the contribution of prenatal changes in brain development to cognition cannot be studied with Dp16.
Materials and Methods
Animals
Embryonic B6129S-Dp (16Lipi-Zfp295)1Yey/NJ.
Dp16 animals were received as a gift from Eugene Yu (Roswell Park Institute, Buffalo, NY) and were also purchased from Jackson Laboratory (stock #013530). All Dp16 founders were backcrossed to C57BL/6 mice for at least five generations before import into our facility. Our Dp16 breeding colony was maintained by backcrossing Dp16 males with C57BL/6N females obtained from Charles River Laboratories. Breeders were paired every evening between 3:00 and 5:00 P.M. and separated every morning between 9:00 and 10:00 A.M., followed by vaginal plug checks. The presence of vaginal plug was designated embryonic day 0.5 (E0.5) and embryos were collected between E13.5 and E18.5. Pregnant dams were killed following approved Institutional Animal Care and Use Committee (IACUC) guidelines. Embryos were fixed for 24 h in 4% paraformaldehyde (PFA), 1× PBS at 4°C. Postnatal day 15 (P15) animals were anesthetized and fixed via intracardial perfusion using 4% PFA, 1× PBS.
Embryonic B6129SC3Sn-Dp (16Lipi-Zfp295)1Yey/NJ × B6/C3Sn F1 Hybrid.
To generate an F1 hybrid, Dp16 animals were bred onto a B6/C3Sn background by crossing Dp16 (on a C57BL/6N background) to C3SnHeSnJ animals to obtain Dp16:F1 hybrid animals. Dp16:F1 hybrids were then bred with B6/C3Sn animals to generate timed pregnancies as outlined below. Both male Dp16:F1 hybrids and female Dp16:F1 hybrid animals were used separately in breeding to test the contribution of a hybrid background and the combined effect of uterine environment and a hybrid background on embryonic brain development. Breeding pairs were established every evening and separated every morning, followed by vaginal plug checks as described above. The presence of vaginal plug was designated E0.5 and embryos were collected at E14.5 or E15.5. Pregnant dams were killed following approved IACUC guidelines. Embryos were fixed for 24 h in 4% PFA, 1× PBS at 4°C. These animals were used exclusively for gross brain measurements and pallial thickness measurements where noted.
Adults B6129S-Dp (16Lipi-Zfp295)1Yey/J.
Eleven Dp16 and 13 euploid 2- to 3-month-old male mice were purchased from Jackson Laboratory (stock #013530). Standard rodent chow and water were available ad libitum. In addition to standard bedding, a Nestlet square was provided in each cage. The colony room was maintained on a 12:12 light/dark cycle, with lights on at 7:00 A.M. All experiments were conducted in the light phase, between 8:00 A.M. and 1:00 P.M. To minimize olfactory cues from previous trials, each apparatus was thoroughly cleaned with Sani-Cloth Plus (PDI Healthcare). Each day of testing, mice were left in their home cages in the room used for the experiment at least 1 h before the onset of the study. The water T-maze and Morris water maze (MWM) tasks were the last experiments in the series. The experimenter was blind to the genotype in all experiments. All experiments involving animals were performed in accordance with institutional, federal, and international guidelines.
Genotyping
Limb buds (embryos) or tail clippings (postnatal animals) were digested using 0.2 mg/ml proteinase K (Denville Scientific) in DNA digestion buffer (containing 50 mm Tris-HCl, pH 8.0, 100 μm EDTA, pH 8.0, 100 μm NaCl, and 1% SDS) overnight at 55°C, followed by phenol/chloroform extraction and DNA was precipitated using ethanol. Genotyping was performed using PCR amplification with primers specific for the Dp16 translocation breakpoint (forward: 5′-CTG CCA GCC ACT CTA GCT CT-3′, reverse: 5′-AAT TTC TGT GGG GCA AAA TG-3′) and mFez (forward: 5′-CTT CGG GAG CAG GTA CCC TA-3′, reverse: 5′-AAG ATC TGA GGC TCG CCA AG-3′) as an internal positive control. The cycling parameters were as follows: step 1: 94°C, 3 min; step 2: 94°C, 45 s; step 3: 58°C, 30 s; step 4: 72°C, 30 s (step 2–4 s, 40 cycles); step 5: 72°C, 10 min; and hold at 4°C. In addition, we confirmed all genotypes using a separate PCR procedure using different primers and protocol (forward: 5′-TAT TAG GAC AAG GCT GGT GG-3′, reverse: 5′-GTC AGT GGT TGT GAC TTG TG-3′; gift from Roger H. Reeves). Cycling parameters for the second primer set were as follows: step 1: 95°C, 1 min; step 2: 95°C, 15 s; step 3: 60°C, 15 s; step 4: 72°C, 30 s (steps 2–4, 35 cycles); step 5: 72°C, 7 min; and hold at 4°C.
Gross measurements
All measurements of brain growth were conducted exactly as described previously for Ts65Dn studies in Chakrabarti et al. (2007). Embryos were imaged and crown–rump measurements were analyzed after fixation using Axiovision software (Zeiss). All embryo (E13.5–E18.5) crown–rump lengths were measured from the top of the head to the base of the tail. After imaging, embryos were decapitated and brains removed from the cranium. Brains were imaged using Axiovision software (Zeiss). Medial–lateral lengths were measured from the median longitudinal fissure to the maximal lateral aspect of the telencephalic hemisphere. Rostrocaudal lengths were measured from the frontal pole to the caudal aspect of the occipital pole.
Tissue processing
Microarray.
All experiments were conducted according to international ethical standards and approved by the IACUC of Tufts University (protocol #B2013-20). Pregnant females were anesthetized with 2.5% isoflurane in a 3/7 O2/N2O mixture and killed by decapitation at E15.5. Embryos were extracted, identified as E15.5 using Theiler staging (http://www.emouseatlas.org), and decapitated in ice-cold 1× PBS. Embryonic brains were rapidly removed and brain hemispheres dissected on a cold platform and snap frozen in liquid nitrogen before storage at −80°C.
Histology.
After 24 h of PFA fixation, fetal and P15 brains were cryoprotected in 30% sucrose, 1× PBS for 24 h at 4°C, followed by freezing in optimal cutting temperature compound (OCT; Sakura), and stored in OCT at −80°C. Next, 16 μm serial coronal sections were obtained using a cryostat (Microm HM 560), mounted on Superfrost Plus Microscope slides (Fisher Scientific), and stored at −80°C.
Neocortical and hippocampal layer measurements
Layer measurements were performed following a similar protocol used in our previous studies (Chakrabarti et al., 2007, 2010) at the level of the dorsal hippocampus (future sensorimotor cortex). This level corresponds to E13/E14 plate 5 in the work by Jacobowitz and Abbott (1998). Briefly, embryonic brain sections were incubated in 1 mm TO-PRO-3 (Invitrogen), 20× PBS for 10 min at room temperature (RT), followed by 2 min washes in 20× PBS. Vectashield with DAPI (Vector Laboratories) was added to all slides, which were then mounted, sealed, and scanned with confocal microscopy as detailed below. We quantified the thickness of the ventricular and subventricular zones (VZ/SVZ), the intermediate zone (IZ), cortical plate (CP), and total pallial thickness. The VZ/SVZ was measured from the ventricular border to the border between densely packed oblong nuclei of the SVZ and the cell sparse IZ. The CP was measured from the border of the IZ to the marginal zone. CP measurements began at E14.5. Measurements of the prenatal hippocampus were collected at E15.5 and E18.5. The thickness of the ventricular zone and hippocampal wall were quantified at both ages, whereas the pyramidal layer was measured at E18.5 because this layer begins to develop at E16.5. It should be noted that these measurements are specific to the future somatosensory cortex and the dorsal hippocampus and cannot necessarily be extrapolated to the entire telencephalon.
Immunohistochemistry
Frozen slides were allowed to come to RT and rinsed in 1× PBS. Antigen retrieval was performed on embryonic slides by microwaving in 10 mm sodium citrate for 1 min at maximum power, followed by 10 min at the minimum power. Slides were incubated in blocking solution (5% donkey serum, 0.2% Triton X-100, 1× PBS) for 1 h at RT, followed by incubation in primary antibody overnight at RT. The next day, slides were washed 3× in 1× PBS and incubated with secondary antibody solution for 1 h at RT, followed by 3 washes in 1× PBS. Slides were mounted in Vectashield with DAPI (Vector Laboratories, H-1200). Primary antibodies: rabbit anti-Tbr2 1:500 (Abcam, 23345), goat anti-Sox2 1:250 (Santa Cruz Biotechnology, sc17320), rabbit anti-pH3 1:500 (Millipore, 06-570), rat anti-Somatostatin (SOM) 1:50 (Millipore, MAB354), rabbit anti-Parvalbumin (PV) 1:1000 (Swant, PV25), rabbit anti-Calretinin (CR) 1:1000 (Swant, 769913), and rabbit anti-Tbr1 1:1000 (gift from the Hevner laboratory). Secondary antibodies: 1:250 for all; donkey anti-rabbit 555 (Life Technologies, A31572), donkey anti-goat 488 (Life Technologies, A11055), goat anti-rabbit 546 (Life Technologies, A11035), goat anti-rabbit 488 1:500 (Life Technologies, A11008), and goat anti-rat 568 1:500 (Life Technologies, A11077).
In vivo neurogenesis
At E13.5, pregnant C57BL/6N females carrying offspring from Dp16 males were injected with 5-ethynyl-2′-deoxyuridine (EdU, 50 mg/kg body weight; Life Technologies, C10425) in 4% saline and killed 24 h later. Embryos were collected and tissue processed as described above. EdU slides were postfixed (4% PFA in 1× PBS) for 15 min at RT. Fixative was removed and slides were washed in 1× PBS, followed by 3% BSA in 1× PBS. Slides were incubated in 0.5% Triton X-100 in 1× PBS for 20 min at RT, followed by a 5 min wash in 1× PBS. Slides were briefly washed in 3% BSA 1× PBS and then incubated in Click-iT reaction mixture for 30 min at RT. Click-iT reaction mixture was prepared fresh and used within 15 min of preparation and made as follows (amounts per one slide): 438 μl of 1× PBS, 10 μl of CuSO4, 2.5 μl of fluorescent dye azide (azide-488), and 50 μl of 1× reaction buffer additive. The reaction mixture was then removed and slides were washed in 3% BSA in 1× PBS. Slides were mounted using Vectashield DAPI (Vector Laboratories) and sealed.
Confocal microscopy and cell counting
All sections were imaged with confocal microscopy using a Zeiss LSM 710 microscope system. Twelve micron, 20× z-stacks were acquired using Zeiss Zen software. 3D image volumes of progenitor cell and EdU immunohistochemistry were analyzed using Volocity (Improvision) software using an automated counting algorithm after validation with manual counts on selected sections. All other cell counts were performed manually using ImageJ and LSM Browser software. It should be noted that, whereas these systematic counts were conducted on volumetric images using a counting frame, they were not acquired using randomly sampled unbiased stereological standards and therefore cannot necessarily be extrapolated to the entire telencephalon. The counts are specific to the future somatosensory cortex in embryonic tissue and the somatosensory cortex in postnatal animals. Progenitor population distribution was determined using Volocity software to measure object distances from the ventricular surface and grouped into 20 μm bins. Mitotic (pH3+ labeled) cell distribution in the ganglionic eminence was performed by 20 μm bins from the ventricular surface and cells were counted manually within bins. The experimenter was blind to genotypes.
Embryonic brain RNA isolation and microarray experiments
Total RNA was isolated from brain hemispheres of Dp16 embryos (n = 6) and their euploid littermates (n = 6) and Ts65Dn embryos (n = 5) and their euploid littermates (n = 6) using the RNA II kits and following the manufacturer's instructions (Macherey-Nagel). RNA was processed for hybridization to Affymetrix mouse gene 1.0 ST arrays as described previously (Guedj et al., 2015a). Twenty-three arrays were analyzed (6 Dp16 and 6 euploid, 5 Ts65Dn and 6 euploid) and each array corresponded to labeled RNA from one individual embryo. Analyses were performed using Benjamini–Hochberg false discovery rate of 20% as a cutoff to allow for a direct comparison of differential gene expression in Dp16 embryos to previously published work in the Ts1Cje mouse (Guedj et al., 2015a) and to increase the identification of potentially dysregulated genes for further pathway analysis. It should be noted that this approach may result in a slight increase in the number of false-positive results. Statistical analyses were performed on the normalized data using R software (version 2.13.1). Gene expression data from Dp16 and Ts65Dn tissues were compared with their respective euploid littermates using an unpaired t test.
Behavioral assessment
Developmental milestones (B6129S-Dp (16Lipi-Zfp295)1Yey/J).
Dp16 males obtained from Jackson Laboratory were backcrossed to C57BL/6J females for two generations. Dp16 pups and euploid littermates from both sexes were subjected to a comprehensive set of neonatal behavior tests to measure different sensory and motor developmental parameters between P3 and P21. Specifically, 15 male and 16 female euploid mice and eight male and eight female Dp16 mice were analyzed. During the testing period, pups were separated from the dam and placed with nesting material in a small bowl positioned on a heating pad at 37°C. A heat lamp was also placed over the mice to provide heat from above. We used the Fox scale as described by Hill et al. (2008) to investigate developmental milestones in Dp16 neonates (n = 16) versus euploid littermates (n = 31). The Fox scale is a battery of tests that measure the following: (1) body righting and coordination (surface righting, air righting, and negative geotaxis); (2) strength (cliff aversion and forelimb grasp); (3) sensory system maturation (rooting, auditory startle, ear twitch, and eye opening); and (4) extinction of rotatory behavior (open field). The amount of time (latency) or presence/absence of reflex was recorded and analyzed by a single experimenter who was blind to animal genotypes.
Nest building.
Mice were individually housed in clean plastic cages supplied with 3 g of Nestlet material (pressed cotton squares) at 6:00 P.M. 1 h before the dark phase of the lighting cycle. The next morning (14–15 h later), cages were assessed for nest construction and untorn material. Nest construction was scored as described previously (Deacon, 2006). Briefly, a 5-point scale was used, where 1 = >90% intact Nestlet, 2 = Nestlet partially torn up, 3 = Nestlet mostly shredded but no identifiable nest site, 4 = an identifiable but flat nest, and 5 = Nestlet torn >90% and a clear nest crater. The experimenter was blind to the genotype (euploid n = 13, Dp16 n = 11).
Marble burying.
We followed the protocol published by Deacon (2006). Briefly, clean cages (30 × 17 × 14 cm) were filled 5 cm deep with bedding material lightly tamped down to make a flat, even surface. A regular pattern of glass marbles was placed on the surface: 5 rows with 3 marbles in each row evenly spaced, approximately 4 cm apart. The number of marbles buried (to 2/3 their depth) with bedding was determined after 30 min for each animal.
Spontaneous alternation.
Spatial working memory was assessed using the continuous variant of the spontaneous alternation procedure, as described previously (O'Tuathaigh et al., 2007; Desbonnet et al., 2012; Olmos-Serrano et al., 2016). Briefly, without prior habituation, animals were placed individually in the center of the Y-maze and allowed to explore freely for 6 min. A video camera mounted above the maze recorded each session and allowed for the analysis of spontaneous alternation, number of arm entries, distance traveled, and velocity of movement using Ethovision software (Noldus). Spontaneous alternation was defined as successive entries into the three arms of the Y-maze in overlapping triplet sets, with arm choices differing from the previous two choices expressed as a percentage of the total number of arm entries: percentage alternation = [(number of alternations/total number of arm entries) − 2] × 100 (chance level = 50%).
Open field.
Locomotion was measured as the spontaneous activity of mice in a novel open square arena (60 cm × 60 cm) Mice were tracked using the Ethovision tracking system (Noldus). Mice were tracked for 1 h and the distance traveled and velocity was recorded electronically. The time spent in the border and in the center of the maze within 10 min bins were also determined.
Hindlimb extension reflex test.
To monitor hindlimb extension, mice were suspended by the tail for 10 s and scored according to the following scale. A score of 2 corresponds to mice that generally place their legs in a wide “V” away from their bodies with splaying of toes. A score of 1 corresponds to an extension reflex in only one hindlimb or extension of both hindlimbs without splayed toes. A score of 0 corresponds to clenching of toes and hindlimbs to the body. Two tests were performed on consecutive days and a third test was performed 1 week later. Each test was repeated twice the same day 1 h apart. The final score for each mouse was the average of the six tests.
Hanging wire.
A standard wire cage lid was used. Duct tape was placed around the perimeter of the lid to prevent the mouse from walking off the edge. The animal was placed on the top of the wire cage lid. The investigator shook the lid lightly three times to cause the mouse to grip the wires and then the lid was turned upside down. The upside-down lid was held at a height of ∼20 cm above the cage; high enough to prevent the mouse from easily climbing down, but not high enough to cause harm in the event of a fall. A stopwatch was used to measure the latency to fall off the wire lid. A 180 s cutoff time was used for the session.
Water T-maze.
The water T-maze used was constructed from Plexiglas. Each arm was 20 cm long and 7 cm wide. The T-maze was filled with tap water and made opaque with white nontoxic paint (Prang). The temperature of the water was 22°C. The platform was a 5 cm × 5 cm square made from Plexiglas that was submerged during the experiments. Mice were given 10 trials per day with an intertrial interval of ∼5–8 min. Mice were released from two different locations (N or S) and were trained to find the location of the submerged platform in one of the arms (E). When mice were released from S or N, the other arm was blocked with a Plexiglas rectangle. Mice therefore had only two choices to find the platform in each trial. Mice scored an error (0) when entering two-thirds of the wrong arm, whereas a correct choice (1) was scored when they found the platform. Once mice reached between 80% and 100% of correct choices, the platform was moved to the opposite arm for reversal learning (W). When mice reached 80–100% of correct choices, the platform was moved again to its first location (E) for assessing double reversal learning. Any errors made into the incorrect arm before the mouse successfully found the platform on its own were counted as perseverative errors. Any errors made after an errorless trial were counted as regressive errors. The time spent to find the platform in the first two trials for reversal and double reversal learning was also measured as an index of cognitive flexibility.
MWM.
Spatial learning and reversal were assessed in the MWM using previously described procedures and equipment (Yang et al., 2012). The apparatus was a circular pool, 125 cm in diameter, filled with 24°C tap water rendered opaque with the addition of nontoxic white paint (Prang). To facilitate spatial learning, room cues made of black and white cardboard were added to the walls surrounding the pool. Trials were videotaped and scored with Ethovision video-tracking software (Noldus). The order of training was as follows: cued submerged platform trials, hidden platform trials, and a final probe trial with the platform removed. Cued, acquisition, and reversal training consisted of 4 trials a day for 4, 9, and 9 d, respectively. Each training trial began by lowering the mouse into the water close to the pool edge in a quadrant that was right of, left of, or opposite to, the target quadrant containing the platform. The start location for each trial was alternated in a semirandom order for each mouse. For cued training, the pool was surrounded by white curtains to occlude sight of extramaze clues. The platform was cued by means of a metal stick attached to a 5-cm-high black ball placed onto it and placed pseudorandomly in different locations across trials. For the acquisition and reversal training, the hidden platform remained in the same quadrant for all trials for a given mouse. Mice were allowed a maximum of 60 s to reach the platform. A mouse that failed to reach the platform in 60 s was guided to the platform by the experimenter. Mice were left on the platform for 15 s before being removed. After each trial, subjects were put in a cage lined with absorbent paper towels. To confirm that the spatial learning task was acquired after acquisition and reversal training by using distal environmental room cues, subjects were tested in a 60 s probe trial 24 h after the completion of the last training session. Reversal training began the next day after the probe test for acquisition training. The hidden platform was moved to the quadrant opposite to its location during acquisition training. Parameters recorded during training days were latency to reach the platform, total distance traveled, swimming speed, and thygmotaxis. Parameters recorded during the probe trial were time spent in each quadrant, number of crossings over the trained platform location, and proximity as described in Maei et al. (2009).
Statistical analysis
Statistical analyses were performed using SigmaPlot software. For gross measurements and neocortical layer measurements, two-way repeated-measures ANOVAs were used. For all other histological and immunohistochemical assesments, unpaired t tests were performed to determine statistical significance. For behavioral tests, two-way repeated-measures ANOVA and post hoc Tukey test were used. For developmental milestone analyses, nonparametric Mann–Whitney and Wilcoxon signed-rank tests were used for single and repeated measures, respectively, to determine significant differences between the euploid and Dp16 groups at a p value of 0.05. Fisher's exact test (FET) was used to determine differences between data points.
Results
Normal gross embryo and brain size in Dp16 embryonic development
Previous findings in fetuses with DS and from several mouse models, including Ts65Dn and Ts1Cje, reported a significant delay in brain and body growth accompanied by decreased neural precursor cell proliferation and slower neurogenesis (Hartley, 1986; Wisniewski, 1990; Chakrabarti et al., 2007; Ishihara et al., 2010). We therefore used the same methods as in previous Ts65Dn studies (Chakrabarti et al., 2007, 2010) to investigate these developmental processes in Dp16. We started by measuring both the crown–rump length and the expansion of the telencephalon along the rostrocaudal and medial–lateral axes to assess body size and brain growth, respectively (Fig. 1). We found that Dp16 fetuses were similar in size to euploid littermates throughout gestation (Fig. 1A,B). Moreover, Dp16 brain hemispheres were comparable to euploid littermates along both the medial–lateral and rostrocaudal axes (Fig. 1C–E). For all gross morphology metrics, there was no difference by genotype. To closely examine Dp16 brain growth, the thickness of the neocortical layers was measured in the prospective somatosensory cortex from E13.5 to E18.5 using the TO-PRO-3 nuclear stain (Fig. 2A,G,H). No differences were found in the thicknesses of the VZ/SVZ, IZ, or CP or overall neocortical thickness across the E13.5–E18.5 time window in Dp16 brains (Fig. 2B–E). We also quantified the thickness of the distinct layers of the developing hippocampus (Fig. 2H–K). Similarly to the neocortex, hippocampal layer thickness did not vary between genotypes in all layers considered (Fig. 2I–K). These data demonstrate that prenatal forebrain growth alterations are not observed in Dp16 mice.

Gross brain and body size in Dp16 fetuses. A, Euploid (left) and Dp16 (right) fetuses at E14.5. B, Dp16 crown–rump length is comparable to euploid throughout prenatal development (E13.5: Eu = 13, Dp = 5; E14.5: Eu = 6, Dp = 3; E15.5: Eu = 9, Dp = 8; E16.5: Eu = 9, Dp = 5; and E18.5: Eu = 10, Dp = 8). C, Euploid (left) and Dp16 (right) brains at E14.5. D, Medial–lateral length of cerebral hemispheres is similar between genotypes. E, Rostrocaudal length of Dp16 telencephalon is normal throughout the embryonic time window (E13.5: Eu = 13, Dp = 5; E14.5: Eu = 9, Dp = 7; E15.5: Eu = 11, Dp = 8; E16.5: Eu = 11, Dp = 7; E18.5: Eu = 10, Dp = 8). F, Normal telencephalic size of Dp16 on B6:C3Sn background through paternal (E14.5: Eu = 12, Dp = 8) and maternal (E15.5: Eu = 9, Dp = 7) trisomic carriers. In each graph, the data points and bars represent the mean ± SEM.

Histology of the Dp16 neocortex and hippocampus. A, TO-PRO-3 stain of coronal neocortical sections at E15.5 (euploid, left; Dp16, right). VZ/SVZ, IZ, and CP are denoted. B–E, Expansion of all neocortical layers occurs normally in Dp16 from midgestation to late gestation (E13.5: Eu = 8, Dp = 5; E14.5: Eu = 11, Dp = 14; E15.5: Eu = 8, Dp = 6; E16.5: Eu = 6, Dp = 6; E18.5: Eu = 8, Dp = 8). F, Thickness of laminae is normal in Dp16 B6:C3Sn animals at E15.5 (Eu = 4, Dp = 6). G, TO-PRO-3 stain of coronal section from an E15.5 brain at the brain level used for quantification of neocortical (solid line white box) and hippocampal (dashed line white box) growth. H, Hippocampal TO-PRO-3 stain at E18.5. I–K, Hippocampal growth occurs normally in Dp16 animals (E15.5 Eu = 4, Dp = 4; E18.5 Eu = 3, Dp = 3). In each graph the data points and bars represent the mean ± SEM.
The absence of gross anatomical prenatal phenotypes is in stark contrast to previous reports in Ts65Dn (Chakrabarti et al., 2007). However, the Ts65Dn mice in our previous studies were maintained on a hybrid background (C57BL/6 × C3HSnHeSnJ) using trisomic carrier females and F1 hybrid males, whereas Dp16 animals were maintained on a C57BL/6 background and trisomy was passed from the males. To assess whether background strain and trisomic carrier contribute to the lack of prenatal findings in Dp16, we crossed Dp16 animals onto the same hybrid background used in the Ts65Dn study using either male carriers with F1 hybrid females or female carriers with F1 hybrid males. We found no difference in gross brain measurements or neocortical lamination in Dp16 animals on the B6.C3Sn hybrid background at either age observed (E14.5 trisomic father; E15.5 trisomic mother; Figs. 1F, 2F). This suggests that background strain and trisomic inheritance do not influence the lack of embryonic phenotypes observed in Dp16. Therefore, further histological experiments were performed using the C57BL/6 background.
Normal development of neural precursors in the dorsal and ventral telencephalon in Dp16
To more closely evaluate the germinal zones in the developing Dp16 neocortex just as we did previously in Ts65Dn (Chakrabarti et al., 2007, 2010), we quantified neuronal precursor subtypes in both the dorsal telencephalon (the source of excitatory neurons) and in the medial ganglionic eminence (MGE) area of the ventral telencephalon (the source of a vast number of neocortical inhibitory neurons and the first two waves of oligodendrocyte progenitors; Anderson et al., 2001; He et al., 2001). Dorsal telencephalic embryonic sections from E13.5 to E18.5 were immunostained for SOX2 and TBR2 to label apical precursor cells (aPCs) and basal intermediate precursor cells (bIPCs), respectively, and with DAPI to label the entire cell population (Fig. 3A,A′). The numbers of aPCs, bIPCs, and the combined precursor populations were similar between Dp16 and euploid controls throughout the neurogenesis period (Fig. 3B,C, respectively; combined population data not shown). We also examined the spatial distribution of individual bIPCs and aPCs by measuring their distance from the ventricle and found no difference in either population across genotypes (Fig. 3D, E13.5; data not shown for other embryonic ages). The progenitor populations located in the MGE were immunostained for the transcription factor OLIG2 (Fig. 3E) and with DAPI to label the entire cell population at E14.5. No detectable difference was observed in the numbers of OLIG2+ neural progenitor cells in Dp16 brains (Fig. 3F).

Dorsal and ventral neural progenitor populations are normal in Dp16. A, A′, Immunohistochemistry labeling apical (aPC, Sox2+, green) and basal intermediate progenitors (bIPC, Tbr2+, red) in euploid (A) and Dp16 (A′) E14.5 neocortex (DAPI, blue). B, C, Each cell population contains normal numbers in the Dp16 neocortical germinal zone at all ages studied. D, Spatial distributions of aPC and bIPCs are normal at all embryonic ages in Dp16 (E13.5 shown, E14.5–18.5 not shown; E13.5: u = 8, Dp = 5; E14.5: Eu = 7, Dp = 5; E15.5: Eu = 9, Dp = 7; E16.5: Eu = 5, Dp = 5; E18.5: Eu = 8, Dp = 8). E, F, Number of Olig2+ progenitors (green) in the E14.5 medial ganglionic eminence in the ventral germinal zone is normal in Dp16 animals. In each graph, the data points and bars represent the mean ± SEM.
To assess proliferation in the dorsal embryonic neocortex and MGE, brain sections were labeled for actively dividing cells with the M-phase marker phosphorylated histone H3 (pH3, red; Fig. 4A,D). Overall, the actively dividing cell population did not vary across genotypes from E13.5 to E18.5 in either the neocortex or the MGE (Fig. 4B,C,E,F), indicating that the number of cells undergoing mitosis during various windows of development does not vary between genotypes.

Mitosis and neurogenesis in Dp16 embryonic development. A, Mitotic cells (pH3+, red) in the dorsal germinal zone of euploid E14.5 neocortex. B, C, Number of mitotic events occurring at the ventricular surface (B) and away from the ventricle (C) is consistent between genotypes at all embryonic ages (E13.5: Eu = 8, Dp = 5; E14.5: Eu = 7, Dp = 5; E15.5: Eu = 9, Dp = 8; E16.5: Eu = 5, Dp = 5; E18.5: Eu = 9, Dp = 8). D, Representative image of mitotic cells (pH3+, red) in the MGE of an E14.5 euploid animal. E, F, Distribution of mitotic cells in the MGE is normal in Dp16 animals (E13.5 and E15.5 shown; E13.5: Eu = 8, Dp = 5; E14.5: Eu = 6, Dp = 5; E15.5: Eu = 9, Dp = 7; E16.5: Eu = 5, Dp = 5). G, Position of EdU + S-phase cells 24 h after labeling (E14.5 euploid image; EdU+, green; DAPI, blue). H, I, EdU+ population size (H) and distribution (I) is consistent between genotypes (Eu = 4, Dp = 6). In each graph, the data points and bars represent the mean ± SEM.
Normal neurogenesis in Dp16 embryonic neocortex
To assess neurogenic output in Dp16 embryonic neocortex as done previously in Ts65Dn (Chakrabarti et al., 2007), E13.5 pregnant C57BL/6 females were injected with the thymidine nucleoside analog EdU (50 mg/kg), which labels cells in S-phase. Embryos were collected 24 h later and EdU-labeled cells were counted in the VZ/SVZ, IZ, and CP. The cells outside of the VZ/SVZ were counted to estimate the neuronal output from the germinal zones during the 24 h window (Fig. 4G). The distribution and number of EdU-labeled cells were similar between Dp16 and euploid brains, indicating that neuronal production defects are not present in the prenatal Dp16 neocortex (Fig. 4H,I). Altogether, these prenatal studies show that the Dp16 forebrain matures without any apparent delays.
Transcriptome analysis of Hsa21 homologs
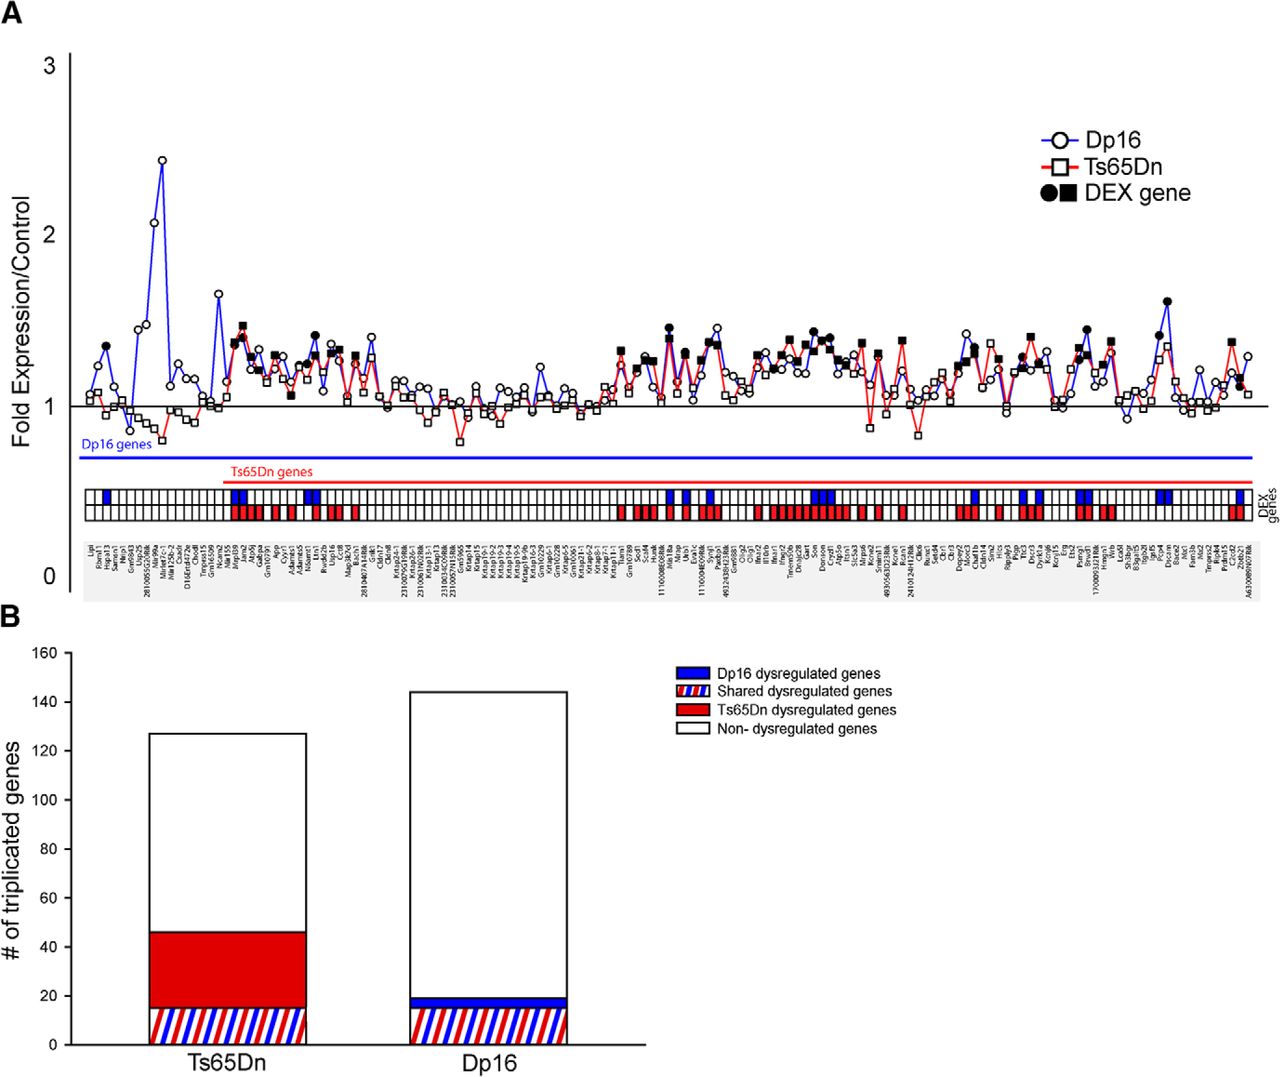
To determine whether gene expression differences may underlie the disparity between Dp16 and Ts65Dn prenatal phenotypes, we compared gene expression in E15.5 forebrain from Dp16 and Ts65Dn animals. Specifically, we analyzed genes localized to the triplicated segments in both Dp16 and Ts65Dn (Fig. 5). Unexpectedly, the number of differentially expressed (DEX) genes was larger in Ts65Dn (46 DEX genes) than Dp16 (19 DEX genes) (Fig. 5A,B) and only 1 of the 17 triplicated genes unique to Dp16 was differentially expressed at E15.5 (Fig. 5A,B). These results show that, despite having a larger number of Hsa21 syntenic genes, fewer of these genes are dysregulated in the Dp16 fetal brain compared with Ts65Dn.

Microarray analysis of Hsa21 homologs in Dp16 and Ts65Dn embryonic brain. A, Fold expression of Hsa21 homologs reveals prominent differences in differentially expressed genes (DEX genes) between Ts65Dn (square) and Dp16 (circle) at E15.5 (red, Ts65Dn DEX genes; blue, Dp16 DEX genes). B, Number of unique DEX genes is higher in Ts65Dn (red, Ts65Dn only DEX genes; blue, Dp16 only DEX genes; red and blue stripes, shared DEX genes).
Given the normal prenatal growth and comparatively normal gene expression profile in Dp16 fetuses, as well as the prior demonstration of postnatal morphological, electrophysiological, and behavioral deficits in Dp16 (Yu et al., 2010; Starbuck et al., 2014), we conducted a detailed examination of neonatal and postnatal cognitive and motor function to determine the magnitude and timing of postnatal deficits in Dp16.
Delayed growth and late-acquisition developmental milestones in Dp16
Delays in the achievement of developmental milestones in the first year of life are a hallmark of DS (Horovitz and Matson, 2011) and have been measured previously in Ts65Dn (Toso et al., 2008; Olmos-Serrano et al., 2016). To investigate early postnatal development in Dp16 and euploid animals, we performed a daily assessment of growth profiles and developmental milestones in mice of both sexes from P3 to P21 (Fig. 6). These assessments included body weight and body length, as well as motor strength, coordination, and acquisition of neurological reflexes. Analysis of growth profiles revealed that Dp16 animals displayed a significant postnatal growth delay ranging between 13% and 29% throughout the preweaning period (Fig. 6A). Similarly, tail base and total body length were significantly smaller in Dp16 compared with euploid littermates (**p < 0.0005, Fig. 6B and data not shown). The growth delay and total body length were also significantly different by sex (data not shown).

Mean body weight and length and developmental milestones of Dp16 versus euploid mice. A, Daily mean body weights of euploid and Dp16 mice in grams measured from P3 until P21. B, Mean body length of euploid and Dp16 mice from P3 until P14. Both weight and body length are significantly reduced in Dp16 (**p < 0.0005). C–J, Early- and late-acquisition developmental milestones of surface righting (C), negative geotaxis (D), forelimb grasp (E), open field (F), ear twitch (G), eye opening (H), air righting (I), and auditory startle (J) of euploid and Dp16 mice. Each data point represents the percentage of animals that acquired the developmental milestone at a specific postnatal day. Fisher's exact test was used to examine significant differences between groups at each postnatal day. (Eu = 31, Dp = 16, *p < 0.05). In each graph, the data points represent the mean ± SEM.
The developmental milestone tests showed that Dp16 mice exhibited a significant delay in late-acquisition milestones (primarily after the second postnatal week) relating to gross motor development and neurological reflexes (Fig. 6C–J; FET, *p < 0.05). The greatest delays were observed in air righting (AR), auditory startle (AS), and ear twitch (ET) (Fig. 6G,I,J, FET, *p < 0.05). The first day of appearance of AR was delayed ∼3 d for Dp16, whereas AS and ET were delayed between 1.5 and 2 d (Fig. 6G,I,J, FET, *p < 0.05). Results were similar when both sexes were examined separately, but a delay in negative geotaxis and eye opening was observed only in Dp16 females (data not shown). We did not find significant differences in the first day of acquisition for the other tests performed.
Neuronal population abnormalities in P15 Dp16 mice
Prior work in DS human brain and Ts65Dn mice has elucidated a shift in the excitatory:inhibitory ratio, indicating higher inhibition in the trisomic forebrain. In particular, fewer excitatory neurons and more numerous inhibitory neurons are found in the Ts65Dn neocortex and hippocampus (Chakrabarti et al., 2010). We therefore sought to determine whether similar cellular changes are found in Dp16 forebrain when the developmental milestone delays become apparent. We selectively labeled subsets of inhibitory interneuron and excitatory neuron populations in the somatosensory cortex (SSCtx) of P15 euploid and Dp16 animals. Antibodies to three calcium-binding proteins were used to label subsets of interneurons including, parvalbumin (PV), somatostatin (Sst), and calretinin (Cr) (Fig. 7A,B). We found that the number of PV+ inhibitory interneurons in the Dp16 SSCtx is reduced at P15 (**p = 0.014; euploid n = 4, Dp16 n = 5, Fig. 7A,D) and there are also fewer Sst+-labeled cells (*p = 0.041; euploid n = 4, Dp16 n = 5, Fig. 7B,D). The Cr+ population density was unchanged in Dp16 animals (Fig. 7B,D). The density of cortical excitatory cells labeled by the transcription factor Tbr1+ was also reduced in Dp16 SSCtx, approaching statistical significance (p = 0.07; Fig. 7C,E). Therefore, despite a lack of prenatal changes in neurogenesis or cortical expansion, Dp16 mice exhibit changes in cortical cell populations at the onset of the developmental milestone delays. However, these findings are significantly different from the brains of Ts65Dn mice, in which an abnormally large population of forebrain inhibitory neurons is found.

Postnatal neuronal population abnormalities in Dp16 somatosensory cortex. A, B, Immunohistochemistry for parvalbumin (A, red), somatostatin (B, red), and calretinin (B, green) expressing interneurons in the P15 somatosensory cortex (left, euploid; right, Dp16). C, Immunohistochemistry for Tbr1-labeled excitatory neurons (Tbr1, red; DAPI, blue; left, euploid; right, Dp16). D, Significant reduction in parvalbumin and somatostatin interneuron density in Dp16 somatosensory cortex (PV, **p = 0.014; Eu = 4, Dp = 5; Sst, *p = 0.041; Eu = 4, Dp = 5), but not calretinin. E, Tbr1+ cell density was reduced in Dp16, but did not reach statistical significance (p = 0.07, Eu = 4, Dp16 = 5). In each graph, the bars represent the mean ± SEM and white scale bars indicate 50 μm.
Impaired adult behavior in Dp16 mice
Behavioral assessments of adult mouse models of DS have been documented extensively (Escorihuela et al., 1995; Coussons-Read and Crnic, 1996; Sago et al., 1998; Martínez-Cué et al., 2005; Costa et al., 2010; García-Cerro et al., 2014). MWM tests have also been performed previously on Dp16 animals (Zhang et al., 2014). This latter study suggests that adult Dp16 mice exhibit deficits similar to other models in hippocampal-based spatial working memory. To gain further clarity on the extent of neurological abnormalities in adult Dp16 mice, we performed a rigorous series of tests to address typical behaviors, motor function, and cognitive ability.
Nest building and marble burying
Analysis of overnight nest building using a detailed nesting scale score and measuring untorn nestlet material revealed that nesting behavior is impaired in Dp16 compared with euploids (Fig. 8A, nest score, *p < 0.05). Interestingly, all animals from both groups tore the entire material provided, but the Dp16 nests were left largely incomplete. To determine whether this difference between groups may be related to slower nest building in Dp16 mice, we examined the time course of this process. We persistently observed abnormal nesting behavior in Dp16 cages overnight (O) + 24 h, O + 96 h, and even O + 20 d (Fig. 8A; *p < 0.05, **p < 0.01, **p < 0.01, respectively). Although Dp16 mice were able to build nests and showed improvement over time, they did not reach the nest quality achieved by the euploids; that is, a rounded nest with high, well assembled walls. We also assessed digging behavior with the marble-burying test. We found that Dp16 animals dug significantly more and buried more marbles than euploid mice (*p < 0.05), indicating abnormal repetitive behavior (Fig. 8B).

Innate behaviors of Dp16 versus euploid mice. A, Nest-building ability. Nesting score was assessed from overnight up to 20 d. B, Digging behavior as measured by the number of marbles buried during 6 min. C, D, Spontaneous alternation is normal in Dp16. Measures of spontaneous alternation (C), number of arm entries (D), velocity (E), and distance traveled (F) were unchanged from euploids. In each graph, the bars represent the mean ± SEM (Eu = 11, Dp = 13, *p < 0.05, **p < 0.01).
Spontaneous alternation
Spontaneous alternation in a novel environment was assessed using a Y-maze (three arm choices). Mice normally have a strong tendency to alternate arm choices (Lalonde, 2002). Our analysis of spontaneous alternation revealed no significant differences between groups (Fig. 8C). Further analysis of arm entries, distance traveled, and velocity did not reveal significant differences between genotypes (Fig. 8D–F).
Motor assessment
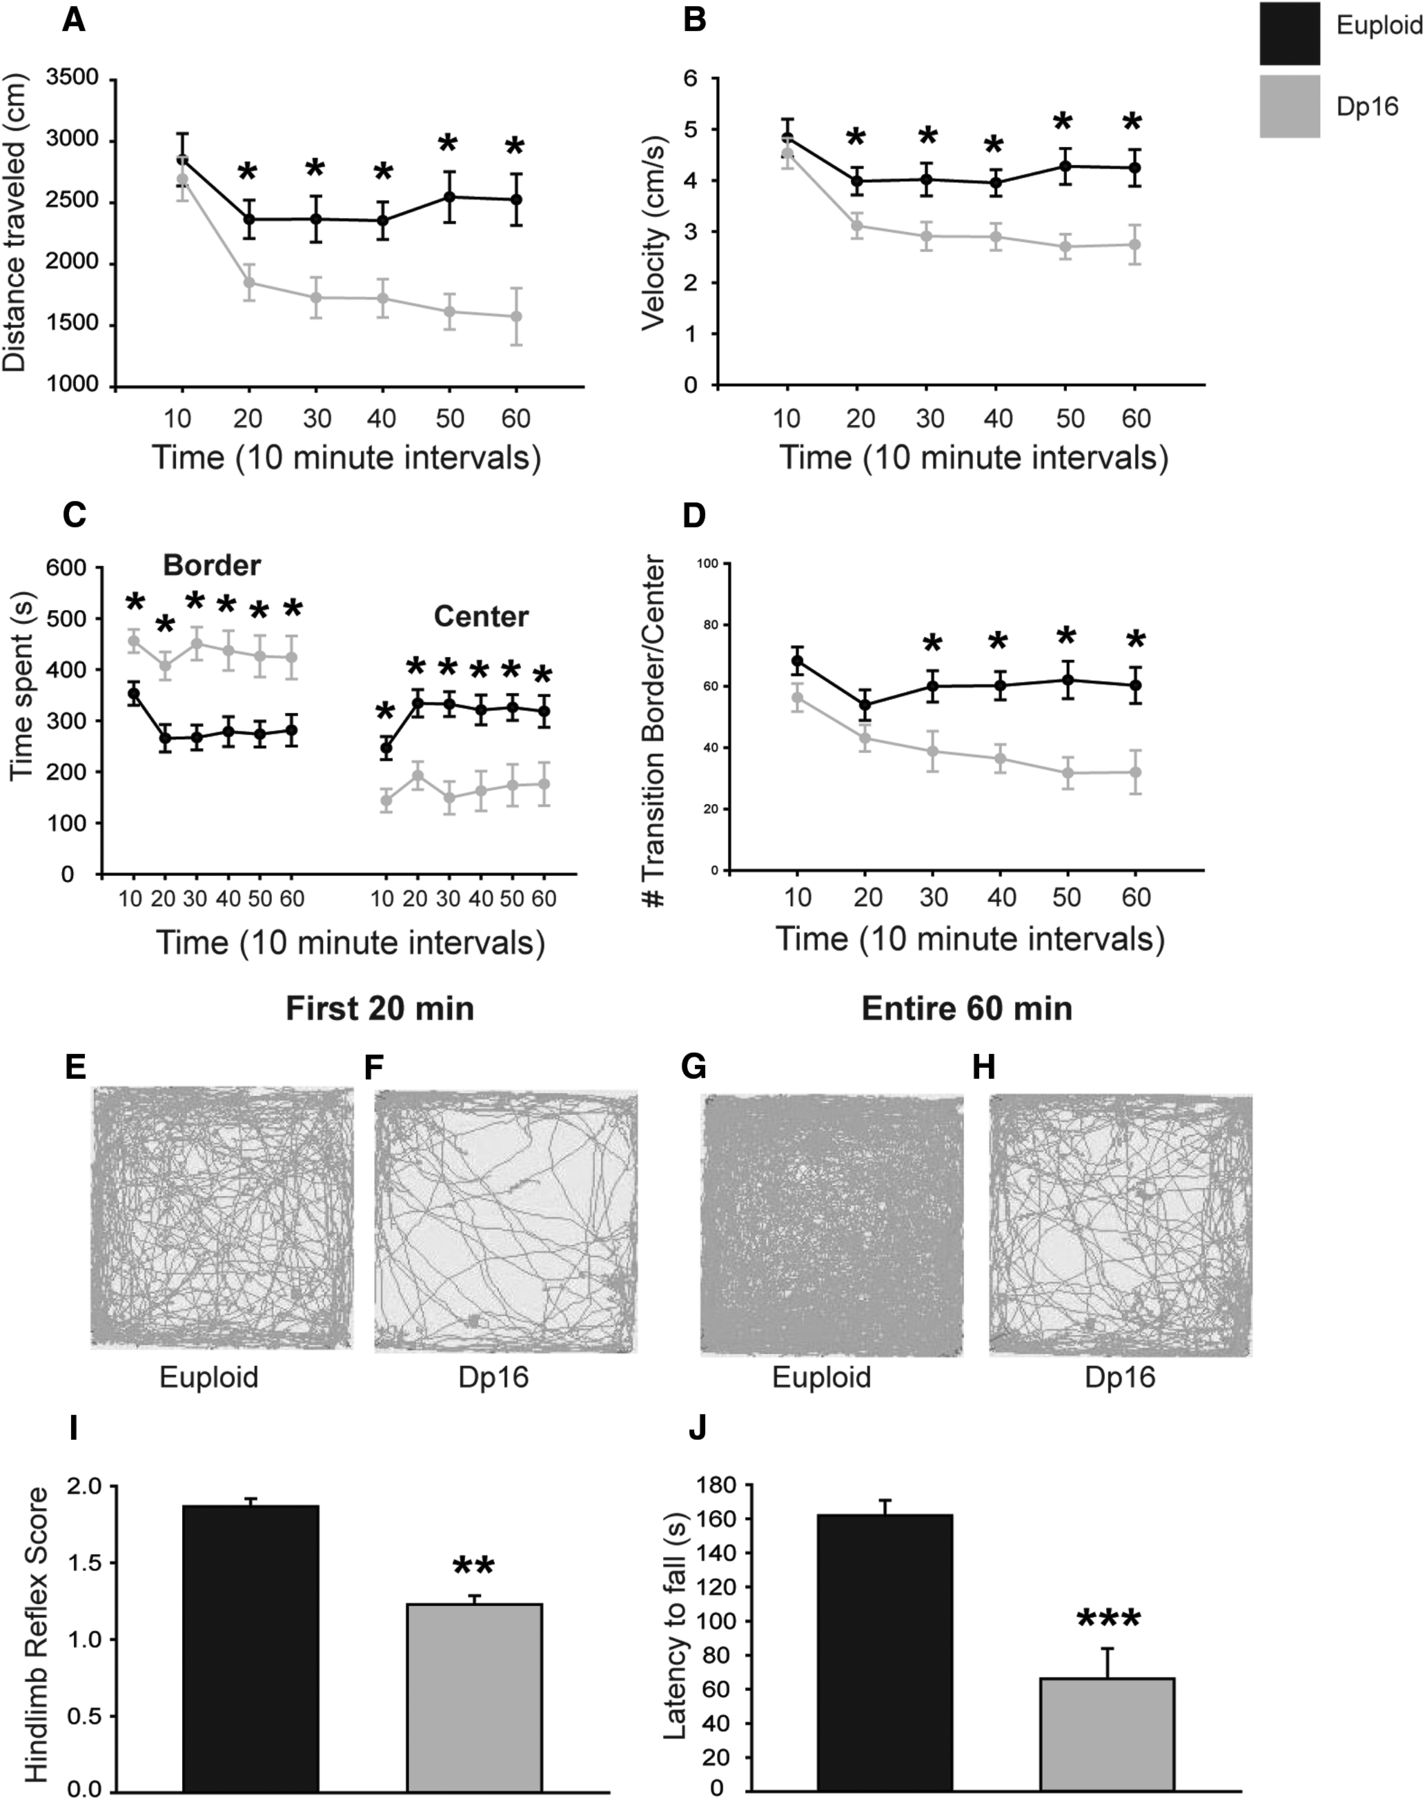
Three different behavioral tests were performed to test motor function in Dp16 mice. For the assessment of general and spontaneous motor activity, both euploid and Dp16 adults were observed in a novel open field for 1 h. Overall, Dp16 animals traveled less distance and exhibited decreased locomotion speed (Fig. 9A,B; p = 0.0110, p = 0.0124, respectively). Although no difference was seen in distance or speed between genotypes during the first 10 min of the test, Dp16 mice traveled less distance and exhibited decreased speed from 20 min on (Fig. 9A,B; *p < 0.05). The time spent in the border versus the center of the arena was then used as an indirect measure of anxiety. Significant differences between groups were apparent when these different locations were analyzed over 10 min intervals (Fig. 9C, F(5,110) = 3.038, p = 0.013; F(5,110) = 3.038, p = 0.013, respectively). Dp16 animals spent more time in the border and less time in the center from 20 min on (Fig. 9C; *p < 0.05) and had fewer crossings between the border and the center from 20 min on (Fig. 9D; *p < 0.05). Representative traces of both genotypes during the first 20 min and in the entire hour illustrate this propensity to remain in the border region (Fig. 9E–H).

Motor activity and function in Dp16 mice. A–D, Locomotor activity was measured in a novel open field arena. Ambulatory activity (A), velocity (B), time spent in the border versus the center (C), and number of transitions between the border and the center (D) identify significant changes in Dp16. Each data point represents the mean ± SEM. E–H, Representative traces showing locomotor activity and preferential location during the open field test. I, Hindlimb extension reflex is impaired in Dp16. J, Dp16 animals have a reduced latency to fall in the hanging wire test. In each graph, the bars represent the mean ± SEM (Eu = 11, Dp = 13; *p < 0.05, **p < 0.001, ***p = 0.002).
For further assessment of motor function in Dp16, hindlimb extension reflex was tested, revealing a significant impairment in Dp16 animal performance (Fig. 9I; **p < 0.001). Specifically, whereas Dp16 animals properly extended both hind limbs when lifted by their tails, they failed to properly splay their toes. Last, the hanging wire test was performed to test motor strength and balance. Latencies to fall were significantly decreased in Dp16 mice (Fig. 9J; ***p = 0.002). Altogether, the results from this battery of motor tests indicate that adult Dp16 mice exhibit motor weakness and altered reflexes, as well as a tendency toward anxious behavior.
Cognitive assessment
We then used two water mazes to assess learning and memory in Dp16 adults. In the water T-maze experiments, learning and memory were tested during acquisition, reversal (R), and double reversal (DR) periods. We found that, although both groups improved their performance over the acquisition period (Fig. 10A; F(3,22) = 34.9018, p < 0.001), there were significant differences between genotypes in the percentage of correct choices during acquisition (F(1,66) = 13.990, p = 0.001). In particular, Dp16 animals performed worse than euploids in the first 2 d of the acquisition period (Fig. 10A; p < 0.05). Interestingly, when the platform was moved to the opposite arm, both groups improved their performance over the 3 d R period (F(2,22) = 64.586, p < 0.001) and no significant differences between genotypes were found (F(1,22) = 0.904, p = 0.352). Both groups also improved their performance over the 3 d DR period (F(2,22) = 75.572, p < 0.001), but, during this period, Dp16 animals had fewer correct choices (F(1,22) = 12.291, p = 0.002), most evidently in the first 2 d of the DR period (Fig. 10A; p < 0.05). We also assessed latencies to find the platform during trial 1 and trial 2 of the first day of the R and DR periods. Interestingly, we found a significant difference between groups on trial 2 of the first day of the DR (Fig. 10B; **p < 0.01). Euploid mice improved in performance between trials 1 and 2 of the double reversal (p < 0.001), whereas the Dp16 mice did not (p = 0.510).

Spatial learning and memory performance in Dp16 mice. A, Percentage of correct choices using the water T-maze paradigm. Water T-maze assessment consisted of three phases: a training phase (days 1–4), a reversal phase (days 5–7), and a double reversal phase (days 8–10). B, Mean latencies to find the platform during reversal and double reversal periods. Note that mean latencies are calculated only for trials 1 and 2. C–F, Quantitative measures of the visible platform test using the MWM paradigm. Escape latencies (C), thigmotaxis (D), distance swam (E), and swimming speed (F) are depicted. G, H, Quantification of the hidden platform test using the MWM paradigm. Escape latencies (G) and distance swam (H) are depicted. Note there are an acquisition phase and a reversal phase. I, J, Representative traces showing swimming path during acquisition and reversal phases. Each data point represents the mean ± SEM. (Figure legend continues. K–N, Results of the reference memory (probe trial) test in the MWM paradigm. Note that probe trials were performed the day after acquisition and reversal phases were finished. Percentage of time spent in each of the quadrants after acquisition (K) and after reversal (L) is depicted. Proximity is defined as the mean average distance to the platform (M) and the number of virtually platform crossings (N). Note that these parameters were assessed in the initial 30 s and in the entire 60 s of the test. In each graph, the bars represent the mean ± SEM (Eu = 11, Dp = 13; *p < 0.05; **p < 0.01).
Spatial learning and memory was also measured using the MWM. Animals were first tested in a cued learning protocol to assess their ability to swim to a visible goal. Both genotypes learned to swim toward a submerged platform identified by a flag, significantly decreasing their latency over 4 d (Fig. 10C–F; F(3,66) = 98.174, p < 0.001). Two-way repeated-measures ANOVA revealed no significant difference between genotypes in the latency to find the cued platform, distance traveled, or thigmotaxis (F(1,66) = 0.343, p = 0.564; F(1,66) = 1.595, p = 0.220; F(1,66) = 0.0994, p = 0.755, respectively). Dp16 animals swam more slowly than euploids to the visible platform (F(1,66) = 10.795, p = 0.003), but this did not affect their performance. Over the following 9 d, mice were tested for spatial learning to a hidden platform (Fig. 10G,H). Both groups learned the hidden platform location during this period, decreasing their latency and swimming distance (latency, F(8,176) = 13.542, p < 0.001; distance, F(8,176) = 14.614, p < 0.001). However, there was a significant difference between genotypes in these two measures (latency, F(1,176) = 9327, p = 0.006; distance, F(1,176) = 4.555, p = 0.044). Post hoc Tukey test comparisons indicated that Dp16 mice performed particularly worse on days 1 and 5 in both latency and distance (Fig. 10G,H; *p < 0.05). There was no overall difference between genotypes in swimming speed (data not shown) and neither genotype exhibited thigmotaxic behavior (data not shown). Interestingly, learning a second hidden platform location in the reversal phase revealed strong deficits in Dp16 in latency and distance swam (Fig. 10G,H; latency, F(1,176) = 55.569, p < 0.001; distance, F(1,176) = 29.364, p < 0.001). Importantly, no difference was seen in swimming speed between groups (F(1,176) = 2.293, p = 0.144). Representative traces of swimming paths clearly show that Dp16 mice exhibited a greater impairment when searching for the platform during the reversal period (Fig. 10I,J). At the end of both the acquisition and the reversal periods, the platform was removed and mice were allowed to swim freely for 60 s in a probe trial test for reference memory. Both probe trials revealed a selective quadrant search, indicating proper memory consolidation of the platform location (Fig. 10K,L; F(3,66) = 92.886, p < 0.001; F(3,66) = 75.616, p < 0.001). In particular, both euploid and Dp16 spent more time in the proper SW and NE quadrants in the acquisition and reversal periods, respectively (Fig. 10K,L; *p < 0.05). However, Dp16 mice spent significantly less time in the proper quadrant during the reversal probe trial indicating memory deficits in Dp16. We also found significant differences between genotypes in proximity and the number of virtual platform crossings for both the initial 30 s and the entire 60 s during the probe trial in the reversal period (Fig. 10M,N; **p < 0.01). Overall, these results demonstrate that Dp16 animals exhibit learning and memory deficits specific to memory extinction and relearning.
Discussion
In this study, we provide the most comprehensive cellular and behavioral analysis of the Dp16 mouse to date. Strikingly, we show that many key processes of prenatal forebrain development are normal in Dp16. In particular, normal neural precursor proliferation and neurogenesis rates lead to proper forebrain growth during the fetal period. In a comparative transcriptomic study, we also, surprisingly, found that gene expression in Dp16 embryonic forebrain was significantly less altered than the Ts65Dn forebrain despite the fact that Dp16 animals harbor more DS-relevant triplicated genes. This unexpected lack of fetal brain morphometric and cellular phenotypes is in stark contrast to the deficits found in humans with DS and in several other mouse models of DS. However, despite this relatively normal prenatal development, we found altered neurological reflexes as early as 2 weeks after birth, followed by impaired adult motor and cognitive performance. We also measured significant changes in the numbers of inhibitory forebrain neurons, suggesting that discrete cellular abnormalities only evident after birth may underlie the motor and cognitive deficits in Dp16 animals. Therefore, whereas these results suggest that Dp16 animals may be used to study the contribution of perinatal and postnatal development to intellectual disability in DS, they also raise important questions about the degree to which prenatal deficits contribute to the impaired cognition in mouse models of DS.
Do Dp16 results challenge the developmental dogma of DS?
Transcriptomic and morphometric studies have shown that altered gene expression is present during DS fetal development and is accompanied by changes in CNS growth and differentiation (Golden and Hyman, 1994; Contestabile et al., 2007; Guidi et al., 2008, 2011; Guedj et al., 2015a, 2015b). Although specific ties between the prenatal phenotypes and the cognitive function have not been elucidated, it is widely accepted that prenatal changes at least partly underlie the intellectual disability in DS (Haydar and Reeves, 2012). This association has been strongly supported by previous studies on several mouse models, particularly Ts65Dn, Ts16, and Ts1Cje, which display defects in neurogenesis and neocortical growth during embryonic forebrain development similar to those seen in fetal DS human brain (Haydar et al., 1996, 2000; Roper et al., 2006; Chakrabarti et al., 2007; Contestabile et al., 2007; Ishihara et al., 2010; Tyler and Haydar, 2013). However, it is important to caution that the aforementioned models of DS are widely different both genetically and phenotypically. In addition, each of these models expresses one or more dissimilarities to humans with DS (Das and Reeves, 2011), so it is necessary to evaluate carefully the incongruities between the models and their relevance to the human disorder.
This divergence between Dp16 and Ts65Dn prenatal brain growth should be interpreted cautiously because several factors differ greatly between the models and may contribute to the apparent phenotypic differences. First, Ts65Dn is one of few DS models to harbor triplicated genes in a freely segregating chromosome, mirroring the aneuploidy in most cases of DS. The extent to which aneuploidy alone contributes to DS phenotypes is not well understood, but is likely to play a significant role because the presence of any extra, freely segregating chromosome has been shown to alter cellular division and cell cycle kinetics in vitro (Stingele et al., 2012). Furthermore, autosomal trisomies have been reported to affect social and cognitive development in nonhuman primates (de Waal et al., 1996). Because Dp16 was engineered using the Cre/Lox system to attach its 22.9 Mb duplication to the distal end of one endogenous copy of Mmu16, the resulting genetic triplication is carried as a duplication and not as an extra chromatid. The duplication event in Dp16 may not disturb cell division as much as aneuploidy. The duplication may also affect epigenetic modification or chromatin states, potentially influencing expression of triplicated genes. In considering this latter possibility, it is interesting that the triplication in Ts1Cje animals (which do exhibit abnormal brain development and proliferation defects) is caused by a duplication similar to that found in Dp16, except that the duplicated segment is shorter and present on Mmu12. Therefore, if the duplication in Dp16 underlies its normal prenatal growth, differences between Dp16 and Ts1Cje in epigenetic regulation are likely to exist. Supporting this possibility, compared with Dp16, Ts1Cje animals differentially express more triplicated genes (39 vs 19 in Dp16) in the E15.5 forebrain (present results and Guedj et al., 2015a). Finally, Ts65Dn mice are trisomic for 60 nonsyntenic genes near the Mmu17 centromere (Duchon et al., 2011). Although any causal relationship between these nonsyntenic genes and the phenotypes observed in Ts65Dn is still unknown, their potential contribution to the prenatal abnormalities in Ts65Dn must be taken into account. Therefore, these findings highlight how different mouse trisomies can result in distinct phenotypes and that each mouse model may replicate different aspects of DS brain development and function.
Relevance of postnatal deficits in Dp16 to DS cognition
Studies in infants with DS have reported delays in the achievement of developmental milestones during the first year of life (Hartley, 1986; Wisniewski, 1990; Nilholm, 1999; Vicari et al., 2013; Cardoso et al., 2015) and several mouse models, including Dp16 (present results), exhibit milestone delays (Holtzman et al., 1996; Toso et al., 2008; Guedj et al., 2015b; Olmos-Serrano et al., 2016). Although our results illustrate some similarities between Dp16 and infants with DS, such as lower growth rates, Dp16 neonatal motor development was normal during the first 2 weeks. Interestingly, the milestones altered in Dp16 were the latest to develop, such as auditory startle and air righting. This differs from observations in the Ts65Dn which exhibit significant delays in both motor and sensory milestones within the first postnatal week (Holtzman et al., 1996; Toso et al., 2008; Olmos-Serrano et al., 2016), indicating that these earliest milestones may be affected by altered prenatal brain development. Our cellular measurements in the postnatal Dp16 neocortex have uncovered significant alterations in neuronal allocation, demonstrating the need to longitudinally profile cellular, molecular, and electrophysiological development in the perinatal neocortex in future studies. Together, these findings identify a potential “critical window” after birth during which behavioral and cellular phenotypes begin to manifest in Dp16 and suggest that Dp16 may be a useful model of how perinatal developmental changes caused by trisomy contribute to cognitive dysfunction.
Individuals with DS exhibit cognitive impairment from early infancy into adulthood. Similar to our results in the Dp16, learning and memory tests on several mouse models of DS have consistently demonstrated cognitive impairment in adults (Stasko and Costa, 2004; Sérégaza et al., 2006; Herault et al., 2012). Notably, our study extended these findings by using two different paradigms and longer testing periods than previous reports, demonstrating that Dp16 impairments become more profound as the task complexity increases. Therefore, our study uncovers novel aspects of Dp16 memory deficits. This difficulty with complex tasks mimic impairments in cognitive flexibility in individuals with DS (Campbell et al., 2013) and in Ts65Dn adults (Olmos-Serrano et al., 2016) and is indicative of abnormalities in the prefrontal cortex (Li et al., 2015).
It should be noted that, although behavioral assessments of model animals are a powerful tool for studying CNS abnormalities, they alone are insufficient to determine the underlying etiological precipitants of behavioral dysfunction. Therefore, whereas the Dp16 deficits in MWM mirror those found in other DS models, the underlying neuropathological mechanisms resulting in this cognitive disability may differ. For example, similar MWM deficits have been reported in other mouse models of developmental and neurodegenerative disorders such as autism spectrum disorder (Moy et al., 2009; Brielmaier et al., 2012; Speed et al., 2015) and Alzheimer's disease (Janus et al., 2000; Van Dam et al., 2003; Arendash et al., 2004; Hartman et al., 2005; Webster et al., 2014) despite rather dissimilar genetic underpinnings. Therefore, disparate pathological mechanisms may result in similar deficits in cognitive performance, at least when measured in murine models.
We show here that comprehensive prenatal measurements and extended developmental milestone and cognitive testing provide greater power to elucidate the developmental timing and magnitude of cognitive sequelae in Dp16. These results highlight the gap that remains in understanding which model is the best representation of the human condition; the longitudinal and rigorous tests conducted here on the Dp16 mice should be followed by similar studies on other models to close this gap.
This study also demonstrates that it is not just the number of triplicated genes that makes a DS mouse model viable, but also that gene expression profiles and chromatin state must also be determined. In the case of Dp16, despite having a genetic landscape nominally closer to the human trisomy, this is not reflected by exacerbated gene expression and a number of key expected developmental defects are missing. These findings indicate that transcriptome correlations between comparably staged human and mouse brains are necessary to identify the degree to which each model replicates the dynamics of DS-specific gene expression throughout development. Once this is accomplished, direct parallels among gene expression, cellular development, and cognition can be studied in the appropriate model.
Footnotes
This work was supported by National Institute of Child Health and Human Development/National Institute of Mental Health–National Institute of Health, (Grant R01 HD05780) and Illumina. We thank Eugene Yu for initially sharing the Dp16 mice and members of the Haydar and Bianchi laboratories for critical reading and discussions of the manuscript.
The authors declare no competing financial interests.
- Correspondence should be addressed to Dr. Tarik F. Haydar, Laboratory of Neural Development and Intellectual Disorders, 72 East Concord Street, L-813, Boston University School of Medicine, Boston, MA, 02118. thaydar{at}bu.edu


