

Abstract
Temporal filtering is a fundamental operation of nervous systems. In peripheral sensory systems, the temporal pattern of spiking activity can encode various stimulus qualities, and temporal filtering allows postsynaptic neurons to detect behaviorally relevant stimulus features from these spike trains. Intrinsic excitability, short-term synaptic plasticity, and voltage-dependent dendritic conductances have all been identified as mechanisms that can establish temporal filtering behavior in single neurons. Here we show that synaptic integration of temporally summating excitation and inhibition can establish diverse temporal filters of presynaptic input. Mormyrid electric fish communicate by varying the intervals between electric organ discharges. The timing of each discharge is coded by peripheral receptors into precisely timed spikes. Within the midbrain posterior exterolateral nucleus, temporal filtering by individual neurons results in selective responses to a particular range of presynaptic interspike intervals. These neurons are diverse in their temporal filtering properties, reflecting the wide range of intervals that must be detected during natural communication behavior. By manipulating presynaptic spike timing with high temporal resolution, we demonstrate that tuning to behaviorally relevant patterns of presynaptic input is similar in vivo and in vitro. We reveal that GABAergic inhibition plays a critical role in establishing different temporal filtering properties. Further, our results demonstrate that temporal summation of excitation and inhibition establishes selective responses to high and low rates of synaptic input, respectively. Simple models of synaptic integration reveal that variation in these two competing influences provides a basic mechanism for generating diverse temporal filters of synaptic input.
Introduction
Temporal coding occurs when stimulus times are represented by spike times (Lestienne, 2001). Nontemporal stimulus information can also be encoded into temporal patterns of spikes (Theunissen and Miller, 1995). Timing has been implicated in stimulus encoding in vertebrate visual (Victor, 2000), auditory (Shannon et al., 1995; Kayser et al., 2010), electrosensory (Carlson, 2008a), somatosensory (Jones et al., 2004; Panzeri and Diamond, 2010), vestibular (Sadeghi et al., 2007), olfactory (Laurent, 1997; Junek et al., 2010), and gustatory pathways (Roussin et al., 2008; Di Lorenzo et al., 2009), yet little is known about how central circuits evaluate these temporal codes to extract information about specific features of stimuli.
Central neurons that respond selectively to temporal patterns of sensory input have been identified (Fortune and Rose, 1997; Rose and Fortune, 1999; Edwards et al., 2002, 2007, 2008; Carlson, 2009; Kayser et al., 2010; Pluta and Kawasaki, 2010; Rose et al., 2011). Further, synapses can act as temporal filters of presynaptic input (Buonomano, 2000; Zucker and Regehr, 2002; Pouille and Scanziani, 2004; Blitz and Regehr, 2005; Gabernet et al., 2005; Klyachko and Stevens, 2006; Meyer et al., 2009; Branco et al., 2010; Slee et al., 2010), and intrinsic excitability can also establish temporally selective responses (O'Donnell and Nolan, 2011). However, a fundamental impediment to understanding how temporally coded stimulus information is processed centrally is the inability to link in vivo studies of information processing in intact circuits with in vitro studies of synaptic and cellular mechanisms for temporal filtering (Abbott and Regehr, 2004). In the current study, we took advantage of the electrosensory system of mormyrid electric fishes to precisely manipulate the timing of presynaptic input to temporal-filtering neurons in behaviorally relevant ways, both in vivo and in vitro. This allowed us to directly relate temporal filtering at synapses to the detection of natural communication signals.
Pulse-type mormyrids generate an all-or-none electric organ discharge (EOD) (Hopkins, 1986). They communicate with other fish by varying the interpulse intervals (IPIs) between EODs (Hopkins, 1986; Kramer, 1990; Moller, 1995; Carlson, 2002b; Arnegard and Carlson, 2005). Electric communication is mediated by a dedicated sensory pathway (see Fig. 1A). Electroreceptors called knollenorgans (KO) respond to each EOD with a single precisely timed spike (Bennett, 1965). Knollenorgan primary afferents project to the hindbrain nucleus of the electrosensory lateral line lobe (nELL), where inhibitory input blocks responses to the fish's own EOD (Bell and Grant, 1989). As a result, the output from nELL consists of a sequence of precisely timed spikes that selectively represents the IPI sequence of a neighboring fish (Carlson, 2008b). The axons of nELL neurons project bilaterally to the anterior exterolateral nucleus (ELa) of the midbrain, which in turn projects to the adjacent posterior exterolateral nucleus (ELp). The majority of ELp neurons exhibit IPI selectivity that results from local processing of spike timing sequences (Carlson, 2009). In the current study, we characterized the temporal filtering properties of ELp neurons in vivo and in vitro, and determined how the synaptic integration of excitation and inhibition establishes temporal filters of behaviorally relevant synaptic input.
Materials and Methods
Animals.
We used the weakly electric mormyrid fish Brienomyrus brachyistius, including individuals of either sex, ranging from 6.0 to 13.0 cm in standard length. The fish were obtained through commercial vendors and housed in community tanks with a 12h light/dark cycle, temperature of 25–28°C, and water conductivity of 200–400 μS/cm. Fish were fed live black worms four times per week. All procedures were in accordance with guidelines established by the National Institutes of Health and were approved by the Animal Care and Use Committee at Washington University in St. Louis.
GABA immunohistochemistry.
We used a primary antibody against GABA coupled to bovine serum albumin with glutaraldehyde (Immunostar). This same antibody was previously used successfully in the mormyrid Gnathonemus petersii (Bell et al., 2005). We perfused eight fish (6.5 to 10.6 cm in standard length) through the heart with ice-cold heparinized Hickman's Ringer solution followed by ice-cold 4% paraformaldehyde/0.3% glutaraldehyde in 0.1 m phosphate buffer (PB) (Carlson, 2002a). Brains were postfixed for 3 h, embedded in gelatin, and postfixed for an additional 3 h. We cut 50 μm horizontal sections in ice-cold 0.1 m PB and then incubated free-floating sections in blocking solution containing 0.1 m PB with 4.5% normal goat serum, 0.3% Triton-X, and 0.3% bovine serum albumin. We then incubated sections in blocking solution containing GABA primary antibody (1:8000) for 25 h at 22°C. After incubation, we rinsed sections in 0.02 m PB (4 × 10 min each) at room temperature and then incubated sections in blocking solution containing a biotinylated secondary antibody (1:200; goat anti-rabbit IgG) for 4 h at room temperature. After incubation, we rinsed sections in 0.02 m PB (4 × 10 min each) at room temperature and then incubated sections with an avidin-biotinylated horseradish peroxidase complex (Elite Kit; Vector Laboratories) overnight at 4°C. We rinsed sections in 0.02 m PB and then visualized the label using a diaminobenzidine (DAB) reaction that started with 30 min in 0.5 mg/ml DAB in 0.1 m PB followed by an additional 5–15 min after adding 0.002% H2O2. Sections were rinsed in 0.02 m PB, mounted on chrom-alum subbed slides, counterstained with neutral red, dehydrated in a graded alcohol series, cleared with xylene, and coverslipped with DPX (Carlson, 2002a). For each brain, we used some sections as controls, in which all procedures were the same except for the omission of primary antibody. In all cases, these negative controls yielded no cell-specific staining in ELa or ELp (data not shown).
Whole-cell recording in vivo.
Surgical, recording, and stimulation procedures were identical to previously described methods (Rose and Fortune, 1996; Carlson, 2009). Fish were initially anesthetized in a solution of 300 mg/L tricaine methanesulfonate (MS-222; Sigma). The fish were then immobilized and electrically silenced with an intramuscular injection of Flaxedil (gallamine triethiodide; 100 μl of a 3 mg/ml solution; Sigma) before being placed on an underwater platform with lateral supports. The fish were completely immersed in water except for one side of the dorsal surface of the head, and they were respirated with an aerated solution of 100 mg/L MS-222 throughout the entire surgery. A craniotomy of the exposed surface of the head was performed to expose ELa/ELp for recording. Lidocaine (100–200 μl of a 2% solution; Radix Laboratories) was applied as a local anesthetic to the surgical incision sites. At the end of surgery, the respiration was switched to fresh water to bring the fish out of general anesthesia for recording.
Recording pipettes had resistances of 20–30 MΩ and initial seal resistances of >1 GΩ. Input resistance ranged from ∼120 to 300 MΩ. We made current-clamp recordings with an Axopatch 200B amplifier (Molecular Devices), digitized the resulting traces at a sampling rate of 50 kHz (model RX8; Tucker-Davis Technologies), and saved the data to disk using custom-made software for Matlab 7.4. Square-wave electrical stimulus pulses were delivered at a sampling rate of 50 kHz (model RX8; Tucker-Davis Technologies). The stimulus orientation (transverse vs longitudinal), polarity (normal vs reversed), duration (0.1–3 ms), and intensity (1–70 mV/cm) that elicited maximal postsynaptic potential responses to single pulses were used in stimulus pulse trains having constant IPIs ranging from 10 to 100 ms (Carlson, 2009). Mormyrids can generate IPIs ranging from ∼10 ms to as long as several hundred milliseconds or even seconds (Carlson, 2002b; Carlson and Hopkins, 2004). However, in a previous study (Carlson, 2009) and in the current study, we did not detect any change in the response of ELp neurons when IPIs were increased >100 ms. We monitored fictive electromotor output by placing an electrode next to the caudal peduncle, amplifying the signal 10,000× with a differential AC amplifier (model 1700; A-M Systems), and then detecting fictive EOD times using a window discriminator (SYS-121; World Precision Instruments). We ignored all stimulus repetitions in which a fictive EOD occurred from 0 to 5 ms before any stimulus pulse, since the electric organ corollary discharge pathway inhibits sensory responses in the hindbrain during this window (Bell and Grant, 1989; Carlson, 2008b). In some cases, we filled recorded cells with biocytin by injecting a 1 Hz sinusoidal current varying from 0 to +1 nA for 2–10 min. After an ∼30 min survival time, we perfused fish through the heart with ice-cold heparinized Hickman's Ringer solution followed by ice-cold 4% paraformaldehyde. Brains were postfixed for 3 h, embedded in gelatin, and postfixed for an additional 3 h. We cut 50 μm horizontal sections and stained labeled cells using standard histological procedures (Carlson, 2002a).
Slice preparation.
We developed a new horizontal slice preparation containing ELa and ELp by adopting established protocols for preparing mormyrid brain slices (Grant et al., 1998; Han et al., 2000; Zhang and Han, 2007). We anesthetized fish in 100 mg/L MS-222, and then fully exposed the brain and irrigated it with ice-cold artificial CSF (ACSF; composition in mm: 124 NaCl, 2.0 KCl, 1.25 KH2PO4, 24 NaHCO3, 2.6 CaCl2, 1.6 MgSO4.7H2O, and 20 glucose, pH 7.2–7.4; osmolarity: 300–305). We quickly removed the entire brain and submerged it in ice-cold ASCF containing 1 mm kynurenic acid (KA) to reduce potential excitotoxic damage (Rossi et al., 2000). We cut horizontal sections (300 μm) using an oscillating tissue slicer (VF-200 Compresstome; Precisionary Instruments) and then transferred sections to an incubating chamber containing oxygenated ACSF and 0.5 mm KA at 28°C. After 1 h, we transferred slices to a different incubating chamber containing oxygenated ACSF to allow for an additional hour of equilibration at room temperature (25–27°C). We then transferred individual slices to a recording stage, where they were bathed with oxygenated ACSF at a flow rate of 3 ml/min at room temperature (25–27°C).
Whole-cell recording in vitro.
We visualized ELp neurons using transmitted light microscopy (BX51W; Olympus) in combination with a Newvicon tube camera (Dage-MTI). We obtained whole-cell intracellular recordings using filamented, borosilicate patch pipettes (1.00 mm outer diameter; 0.58 mm inner diameter) with tip resistances of 10–15 MΩ. We identified ELp neurons based on location, cell morphology, and spiking responses to depolarizing current injection (current injection range from 0 to +0.2 nA). We only used data from neurons that had a stable resting potential of at least −50 mV. The electrode tip solution contained the following (in mm): 130 K gluconate, 5 EGTA, 10 HEPES, 3 KCl, 2 MgCl2, 4 Na2ATP, 5 Na2 phosphocreatine, and 0.4 Na2GTP, pH 7.3–7.4 (osmolarity: 285–290). During recordings the bath solution was maintained at room temperature (25–27°C). The extensive dendritic arborizations of these neurons (see Fig. 1C) made it impossible to effectively voltage-clamp synaptic potentials. Therefore, we made current-clamp recordings with either an Axopatch 200B or MultiClamp 700B amplifier (Molecular Devices), digitized the resulting traces at a sampling rate of 50 kHz (Digidata 1440A; Molecular Devices), and saved the data to disk (Clampex v10.2; Molecular Devices).
To stimulate excitatory inputs to ELp, we placed stimulus electrodes in ELa, just anterior to the border with ELp. In a few cases, we used a single concentric bipolar electrode (TM33CCNON; World Precision Instruments), but in most cases we used a 2 × 4 array of electrodes (FHC) spanning the width of ELa to deliver simultaneous 4-channel bipolar stimulation over a larger surface area. Electrical stimulation at the same location in vivo results in the same pattern of IPI tuning in ELp neurons as occurs in response to sensory stimulation (Carlson, 2009), indicating that this stimulation procedure successfully recreates natural spatiotemporal patterns of synaptic input. We delivered isolated, biphasic, square current pulses with an amplitude of 100 μA and a total duration of 100 μs (model 2100; A-M Systems). We stimulated with single pulses as well as stimulus trains of 10 pulses with constant IPIs ranging from 10 to 100 ms.
Pharmacology.
We used two different compounds to block GABAA receptors (Zhang and Han, 2007): picrotoxin (PTX; 100 μm in 0.3% DMSO in ACSF; Tocris Bioscience) and gabazine (SR-95531 hydrobromide at 30 μm in ACSF; Tocris Bioscience). Control experiments were performed using vehicle alone (0.3% DMSO in ACSF). Full wash-out typically took 30–45 min. Additionally, we applied PTX intracellularly to ELp neurons by adding picrotoxin to the internal pipette solution (100 μm). When applied intracellularly at this concentration, PTX acts as a GABA antagonist by blocking chloride channels (Akaike et al., 1985; Inomata et al., 1988; Chacron and Fortune, 2010; Khanbabaie et al., 2010). Although both PTX and gabazine are high-affinity antagonists for GABAA receptors, they also act as relatively high- and low-affinity antagonists, respectively, for glycine receptors (Wang and Slaughter, 2005). Therefore, to distinguish between possible effects of GABAA and glycine receptors in mediating the observed effects of PTX and gabazine on synaptic responses, we also bath applied the glycine receptor antagonist strychnine hydrochloride (15 μm in ACSF; Han et al., 2000).
Both our in vivo and in vitro whole-cell recording conditions imposed chloride reversal potentials that were hyperpolarized from rest (chloride equilibrium potential ∼ −75 mV). To determine whether this reflects the true chloride reversal potentials of ELp neurons, we obtained intracellular recordings from ELp neurons in vitro using sharp electrodes filled with 3 m potassium acetate to avoid influencing intracellular chloride concentration. We then bath applied 100 μm GABA and observed the effect on resting potential.
Data analysis.
We applied a median filter to all traces to remove spikes and analyze postsynaptic potentials (PSPs) (Carlson, 2009). We then averaged the response traces across stimulus repetitions to obtain a single averaged response trace. For characterizing PSP responses to single-pulse stimulation in vivo, we measured the maximum depolarizations and hyperpolarizations, and the latencies associated with these values. To analyze differences in these values with respect to IPI tuning, we used one-way ANOVAs. We also used one-way ANOVAs to analyze differences in resting potentials with respect to IPI tuning.
For comparing PSP responses to single-pulse stimulation in vitro in the presence and absence of receptor blockers, we measured the maximum depolarization, the latency to the maximum depolarization, and the total duration of depolarizations. Total duration was determined by identifying the beginning and end of each response as the first and last points in the averaged response, respectively, that differed from the prestimulus baseline by more than 4 SDs. These values were normalized to the control (pre-wash-in) values. We then used single-sample t tests to determine whether these normalized values differed significantly from 1. We used a two-sample t test to test for differences between the effects of PTX and gabazine on these normalized values, and we used a one-way ANOVA to test for differences in these normalized values with respect to IPI tuning. We used paired t tests to test for changes in resting potential after drug wash-in. For comparing the single-pulse responses of neurons recorded with and without intracellular PTX, we compared maximum depolarizations, latency to maximum depolarizations, and total duration of depolarizations using two-sample t tests.
IPI tuning curves were constructed from the responses of ELp neurons in vivo and in vitro as follows (Carlson, 2009). First, we averaged the response traces across stimulus repetitions to obtain a single averaged response trace. Then, we determined the maximum depolarization in response to each stimulus pulse in the 10-pulse train. Next, we averaged the maximum depolarizations in response to the 2nd through 10th pulses to obtain a single average maximum depolarization for each IPI. Finally, the resulting maximum depolarizations for all 10 IPIs were normalized to the largest average response measured (Carlson, 2009). We categorized the tuning of neurons by identifying the IPIs that elicited maximum depolarizations <85% of maximum (Carlson, 2009). Using a linear extrapolation between adjacent points, we identified each IPI at which a tuning curve crossed the 85% criterion. We classified neurons as “all-pass” if the responses to all IPIs were ≥85% of maximum. If the tuning curve had a single point that crossed the 85% criterion, we classified the neuron as “low-pass” if long IPIs elicited responses ≥85% (see Fig. 2A), whereas we classified the neuron as “high-pass” if short IPIs elicited responses ≥85% (see Fig. 2B). If the tuning curve had two points that crossed the 85% criterion, we classified the neuron as “bandpass” if intermediate IPIs elicited responses ≥85% (see Fig. 2C), whereas we classified the neuron as “band-stop” if intermediate IPIs elicited responses <85% (see Fig. 2D). We classified the neuron as “complex” if the tuning curve had three or more points that crossed the 85% criterion. We used linear regression to test for correlations between synaptic responses to single-pulse stimulation with the low-pass cutoff intervals of low-pass neurons, and with the high-pass cutoff intervals of high-pass neurons. Fisher's exact test was used to test for differences in the relative numbers of neurons in different IPI tuning categories under different drug conditions in vitro. Unless otherwise noted, values are presented as the mean ± SEM.
Modeling.
We generated leaky integrator neurons (Dayan and Abbott, 2001) as follows:
 where Vm is the membrane potential, Cm is the membrane capacitance (30 μF), Rm is the membrane resistance (100 MΩ), and IE(t) and II(t) represent the excitatory and inhibitory synaptic currents, respectively, as a function of time. The excitatory and inhibitory conductances were represented as separate α functions (Dayan and Abbott, 2001), both as follows:
 where gs is the synaptic conductance, gmax is the maximum conductance, and τs is the time constant of the conductance. The excitatory and inhibitory synaptic currents were both then determined from their respective conductances and driving forces as follows:
 where Vr is the reversal potential, which was set at +60 mV depolarized relative to rest for excitatory currents and −20 mV hyperpolarized relative to rest for inhibitory currents. We did not incorporate spiking into the model (i.e., an integrate-and-fire model), instead focusing on subthreshold membrane potentials (as in our analyses of ELp neurons recorded in vivo and in vitro). We systematically varied six parameters of the models, including the conductances of excitation and inhibition (ge and gi), the time constants of excitation and inhibition (τe and τi), and the onset latencies of excitation and inhibition (late and lati). We presented synaptic inputs consisting of 10 pulses at constant IPIs ranging from 10 to 100 ms, identical to the constant IPI stimuli presented in vivo and in vitro. We measured average maximum depolarizations as a function of IPI for each neuron and then categorized the tuning of each neuron using the same methods as for our analysis of ELp neurons recorded in vivo and in vitro.
Results
GABAergic staining, dendritic arborizations, and axonal projections within ELp are extensive
To evaluate the potential role of GABAergic inhibition in temporal filtering in ELp, we examined the distribution of GABAergic somas, fibers and terminals. An antibody to GABA reveals extensive staining throughout both ELa and ELp (Fig. 1B). There are two distinct neuron types in ELa, large cells and small cells, with soma diameters of ∼10 and ∼6 μm, respectively (Xu-Friedman and Hopkins, 1999). As previously described in a related species (Mugnaini and Maler, 1987), GABAergic staining in ELa was restricted to large cells, and included large cell somas, thick axons, and calyx-like terminals onto small cells (Fig. 1B). Large cells are entirely intrinsic to ELa, and small cells are the only neurons in ELa that project to ELp (Xu-Friedman and Hopkins, 1999). Numerous stained somas were also visible in ELp; their diameters ranged from ∼4 to 10 μm (Fig. 1B). In contrast to ELa, additional staining in ELp was evident as a dense plexus of what appeared to be thin fibers and punctate terminals. Many unlabeled cells were also visible in ELp, and their somas were typically surrounded by punctate label (Fig. 1B).

Anatomy of the knollenorgan electrosensory pathway in B. brachyistius. A, Dorsal view of the brain with the valvula cerebellum removed to expose the underlying structure. KO primary afferents project ipsilaterally to the nELL in the hindbrain via the posterior lateral line nerve (pLLn) as well as the anterior lateral line nerve (data not shown). Neurons in the nELL project bilaterally to the ELa in the midbrain, which projects ipsilaterally to the adjacent ELp. Scale bar, 1 mm. B, 50 μm horizontal section through the midbrain showing staining with an anti-GABA antibody. The images on the top and bottom show enlarged views of ELa and ELp, respectively, taken from the dashed boxes shown in the middle image. Note the staining of somas (closed arrowheads) and terminals located adjacent to unstained cell bodies (open arrowheads). Scale bar, 100 μm. C, 50 μm horizontal sections through the midbrain showing two ELp neurons filled with biocytin after whole-cell recording in vivo. Both neurons had low-pass IPI tuning. Scale bars, 50 μm.
We filled some individual ELp neurons with biocytin after obtaining whole-cell recordings in vivo. Although we did not reconstruct the detailed morphology of these cells, they conform to previous descriptions of ELp neuron morphology (Xu-Friedman and Hopkins, 1999). Thus, labeled ELp neurons could generally be characterized as having large, spiny dendritic arborizations that branched extensively throughout the nucleus (Fig. 1C). Although the diameters of labeled somas ranged from 7 to 11 μm, their dendritic arbors spanned as much as 200 μm. In addition, the axons of labeled neurons branched extensively, leading to both local and distant projections within ELp as well as to extrinsic projections, as described previously (Haugede-Carre, 1979; Xu-Friedman and Hopkins, 1999).
GABAergic inhibition is hyperpolarizing
We obtained intracellular recordings from nine ELp neurons in vitro using sharp electrodes filled with 3 m potassium acetate to avoid influencing intracellular chloride concentration and GABA-mediated reversal potentials. The mean resting potential was −65.4 ± 3.3 mV. After bath application of 100 μm GABA, there was a significant hyperpolarization of the mean resting potential to −76.3 ± 3.4 mV (t(9) = 4.4, p < 0.01). This effect was reversible in the eight neurons that we held long enough for wash-out (mean resting potential, −64.9 ± 6.2 mV, compared with pre-GABA: t(8) = −0.2, p > 0.8). These data reveal that the GABA-mediated reversal potential is hyperpolarized by ∼10 mV from rest, indicating that GABAergic inhibition is naturally hyperpolarizing.
Tuning to interpulse intervals is similar in vivo and in vitro
When recorded in vivo, ELp neurons exhibit the same tuning to patterns of sensory stimulation as they do to direct electrical stimulation of presynaptic fibers in ELa (Carlson, 2009). This suggests that tuning to behaviorally relevant patterns of presynaptic stimulation can be achieved in vitro, where there is greater pharmacological and experimental control. To determine whether the temporal filtering of presynaptic spike trains by the population of ELp neurons is indeed generally similar in vivo and in vitro, we compared the tuning characteristics of neurons recorded in both conditions.
We obtained whole-cell intracellular recordings and responses to the full range of IPIs (10–100 ms) from 66 neurons in vivo. Based on whether responses to any IPIs dropped <85% of the maximum response (see Materials and Methods), 62 of these neurons exhibited IPI tuning (93.9%), whereas the remaining 4 were categorized as all-pass. Of the 62 IPI-tuned neurons, 24 responded preferentially to long IPIs (low-pass tuning), 25 responded preferentially to short IPIs (high-pass tuning), and 13 responded preferentially to intermediate IPIs (bandpass tuning). Representative in vivo intracellular recordings from these types of neurons have already been published (Carlson, 2009). The resting potentials of low-pass (−58.2 ± 1.4 mV), bandpass (−57.4 ± 1.4 mV), and high-pass (−57.1 ± 1.8 mV) neurons recorded in vivo were not significantly different from each other (F(2,59) = 0.12, p > 0.89).
We obtained whole-cell intracellular recordings and responses to the full range of IPIs from 71 neurons in vitro. Sixty-three of these neurons exhibited IPI tuning (88.7%), whereas the remaining 8 were all-pass. Of the 63 IPI-tuned neurons, 24 were low-pass (Fig. 2A), 19 were high-pass (Fig. 2B), and 12 were bandpass (Fig. 2C). In addition, six neurons responded more strongly to both long and short IPIs than to intermediate IPIs (band-stop tuning) (Fig. 2D) and two neurons had a complex pattern of IPI tuning, with multiple IPI ranges eliciting strong responses. The resting potentials of low-pass (−67.3 ± 1.1 mV), bandpass (−64.3 ± 1.6 mV), and high-pass (−65.2 ± 1.7 mV) neurons recorded in vitro were not significantly different from each other (F(2,52) = 1.11, p > 0.3).

IPI tuning of ELp neurons in vitro. Responses to presynaptic stimulation with 10 pulses at IPIs of 10 ms (left), 50 ms (middle), and 100 ms (right) are shown for four different neurons. Stimulus times are shown below each trace, and the artifacts are visible in the recordings. In each case, superimposed responses to three stimulus repetitions are shown. IPI tuning curves showing maximum average depolarizations as a function of IPI for the same four neurons are shown on the far right, with values normalized to the strongest response. In each case, the responses to all stimulus repetitions were averaged, and then the maximum depolarizations in response to stimulus pulses 2–10 were averaged to compute a single maximum depolarization for each IPI. A, Low-pass neuron. B, High-pass neuron. C, Bandpass neuron. D, Band-stop neuron.
To characterize how different patterns of IPI tuning relate to rate-dependent changes in PSP responses in vivo and in vitro, we plotted maximum depolarizations as a function of IPI, with values normalized to the maximum depolarization in response to single stimulus pulses. The resulting plots reveal how IPI tuning relates to either rate-dependent decreases (values <1) or rate-dependent increases (values >1) in synaptic response (Fig. 3). Both in vivo and in vitro, short IPIs caused PSP attenuation in low-pass neurons. By contrast, short IPIs resulted in PSP enhancement in high-pass neurons. Bandpass neurons were more variable in their response patterns; however, intermediate IPIs typically resulted in PSP enhancement, and short IPIs often caused PSP attenuation. Thus, IPI tuning observed in vivo and in vitro resulted from similar rate-dependent changes in synaptic responses.

IPI tuning of ELp neurons results from rate-dependent changes in synaptic responses that are similar in vivo and in vitro. A, B, Plots show the maximum depolarizations of ELp neurons as a function of IPI (mean ± SEM) for low-pass neurons (left), high-pass neurons (middle), and bandpass neurons (right) recorded in vivo (A) and in vitro (B). For each neuron, maximum depolarizations are normalized by the maximum depolarization in response to a single stimulus pulse to illustrate rate-dependent changes in response.
Excitation and inhibition appear to relate to interpulse interval tuning in vivo
To begin to examine the roles of excitatory and inhibitory synaptic inputs on temporal filtering, we analyzed the characteristics of depolarizing and hyperpolarizing synaptic responses to single-pulse stimulation in vivo. In addition to the 62 IPI-tuned neurons that we obtained full IPI tuning curves from, we were able to categorize the IPI tuning of an additional 44 neurons based on partial tuning curves. These neurons also showed no difference in resting potentials with respect to IPI tuning (F(2,103) = 1.42, p > 0.2). For these 106 neurons, we determined average responses to single-pulse stimulation and measured the resulting maximum depolarizations and maximum hyperpolarizations, as well as their associated latencies (Fig. 4). In general, single-pulse responses consisted of an early depolarization followed by a late hyperpolarization (Fig. 4A). Maximum depolarizations differed significantly with respect to IPI tuning (F(2,103) = 26.8, p < 0.000001), as did maximum hyperpolarizations (F(2,103) = 16.3, p < 0.00001). Thus, low-pass neurons had relatively large maximum depolarizations and small maximum hyperpolarizations, whereas high-pass neurons had relatively small maximum depolarizations and large maximum hyperpolarizations; bandpass neurons were intermediate in both respects (Fig. 4B). The latencies to maximum depolarizations were significantly shorter than the latencies to maximum hyperpolarizations (F(1,103) = 75.4, p < 0.000001), but there was no significant difference in the latencies to maximum depolarizations (F(2,103) = 0.72, p > 0.4) or maximum hyperpolarizations (F(2,103) = 1.67, p > 0.1) among low-pass, bandpass, and high-pass neurons (Fig. 4B). These results are suggestive of direct excitation followed by indirect inhibition, with IPI tuning relating to differences in the relative baseline contributions of excitation and inhibition.

Evidence that inhibition is related to IPI tuning in vivo. A, Two representative examples each of average synaptic responses to single stimulus pulses for low-pass neurons (left), bandpass neurons (middle), and high-pass neurons (right). B, Maximum depolarizations and maximum hyperpolarizations of low-pass, high-pass, and bandpass ELp neurons (top), as well as their associated latencies relative to the stimulus (bottom). Values show the mean ± SEM. Note that the overall pattern of responses to stimulation consists of a depolarization followed by a hyperpolarization, and that the relative amplitudes of these two responses vary with IPI tuning.
Synaptic responses are shaped by GABAergic inhibition
To specifically establish the existence of excitatory and inhibitory synaptic responses, we pharmacologically blocked inhibitory receptors in vitro. Bath application of the GABAA blockers PTX or gabazine had dramatic and consistent effects on PSPs in response to single-pulse stimulation (Fig. 5A). As shown in Figure 5B, PTX or gabazine application led to significant increases in maximum depolarization (t(45) = 3.78, p < 0.001), latency to maximum depolarization (t(45) = 3.68, p < 0.001), and duration of depolarization (t(45) = 2.62, p < 0.05). These effects showed complete reversal in the 34 of the 46 neurons that we held long enough to characterize responses after wash-out. Application of vehicle alone had no effect on maximum depolarization (t(12) = 0.06, p > 0.9), latency to maximum depolarization (t(12) = 0.17, p > 0.8), or duration of depolarization (t(12) = −1.64, p > 0.1). There were no significant differences in the effects of PTX versus gabazine on maximum depolarization (t(44) = 0.37, p > 0.7), latency to maximum depolarization (t(44) = −0.24, p > 0.8), or duration of depolarization (t(44) = 0.92, p > 0.3). Although most of the neurons recorded in vitro did not spike under control conditions, the vast majority of neurons did spike in response to synaptic stimulation while blocking inhibitory receptors. There was, however, no spontaneous spiking under either condition. Further, there was no significant difference in resting potential under control conditions compared with during wash-in of PTX or gabazine (control = −63.8 ± 3.2 mV; wash-in = −65.4 ± 0.9 mV; t(90) = 0.48, p > 0.6).
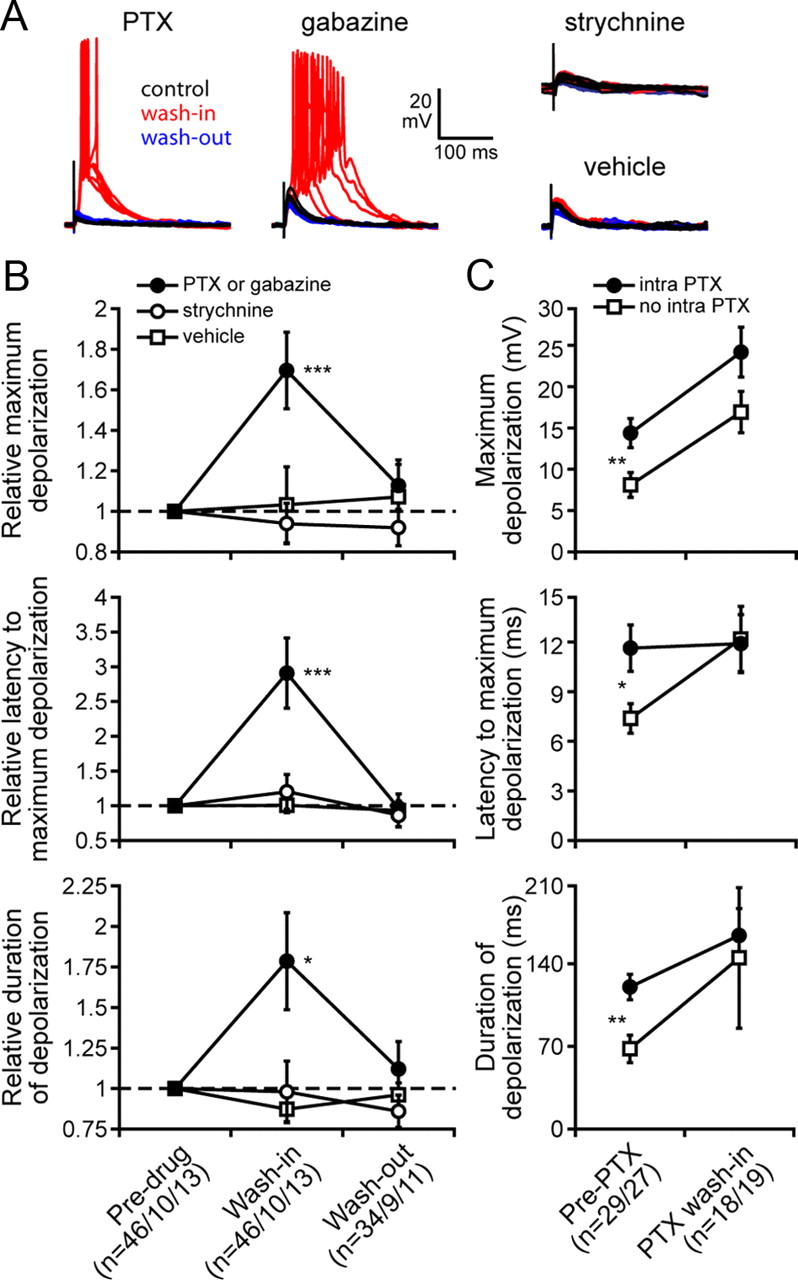
GABAergic inhibition shapes synaptic responses. A, Representative examples of responses to single stimulus pulses for one neuron exposed to 100 μm picrotoxin in 0.3% DMSO (PTX), one neuron exposed to 30 μm gabazine, one neuron exposed to 15 μm strychnine, and one neuron exposed to vehicle only (0.3% DMSO). In each case, superimposed responses to five stimulus repetitions are shown under control conditions (black), during bath wash-in (red), and following wash-out (blue). B, Changes in maximum depolarization (top), latency to maximum depolarization (middle), and duration of depolarization (bottom) in response to single stimulus pulses following bath wash-in and wash-out of 100 μm PTX in 0.3% DMSO or 30 μm gabazine, 15 μm strychnine, or vehicle (0.3% DMSO). For each neuron, responses are normalized to the response before wash-in (mean ± SEM). Asterisks show values significantly >1 (*p < 0.05, ***p < 0.001). C, Comparison of responses to single stimulus pulses between neurons with 100 μm intracellular picrotoxin (intra-PTX) and control neurons (no intra-PTX). Changes in maximum depolarization (top), latency to maximum depolarization (middle), and duration of depolarization (bottom) before and during bath wash-in of 100 μm PTX in 0.3% DMSO are shown (mean ± SEM). Asterisks show significant differences between neurons with intracellular PTX and neurons without intracellular PTX (*p < 0.05, **p < 0.01).
In addition to their effects on GABAA receptors, PTX and gabazine can also act as antagonists at glycine receptors (Wang and Slaughter, 2005). To determine whether glycine receptors might be mediating some of the observed effects of PTX or gabazine application, we bath applied strychnine, a potent antagonist of glycine receptors (Fig. 5A). As shown in Figure 5B, strychnine application had no effect on maximum depolarization (t(9) = −0.57, p > 0.5), latency to maximum depolarization (t(9) = 0.78, p > 0.4), or duration of depolarization (t(9) = −0.08, p > 0.9).
The apparent difference in the baseline balance between excitation and inhibition with respect to IPI tuning observed in vivo (Fig. 4) could potentially be due to differences in the strength of excitatory input and/or inhibitory input. For example, high-pass neurons could receive relatively weak baseline excitation, relatively strong baseline inhibition, or both. Among the six categories of IPI tuning observed in vitro, there were no differences in the effects of PTX or gabazine wash-in on maximum depolarization (F(5,34) = 1.76, p > 0.1), latency to maximum depolarization (F(5,34) = 2.38, p > 0.05), or duration of depolarization (F(5,34) = 0.84, p > 0.5). Thus, every type of ELp neuron appeared to receive GABAergic inhibition, and there was no evidence that high-pass neurons received more inhibition than low-pass neurons. This suggests that differences in membrane depolarization across IPI tuning classes appear to be at least partly due to differences in the baseline strength of excitation.
The enhancement of synaptic responses during bath application of GABAA blockers could result from two distinct effects: direct effects on GABAA receptors located on the recorded cell, as well as indirect effects on GABAA receptors located on presynaptic excitatory inputs (i.e., disinhibition of excitatory inputs). To distinguish these two possibilities, we blocked GABAA receptors from the inside of recorded cells by recording with pipettes filled with 100 μm PTX (Akaike et al., 1985; Inomata et al., 1988; Chacron and Fortune, 2010; Khanbabaie et al., 2010). This technique does not allow for a comparison of responses before and after blocking inhibition, so we compared responses to single-pulse stimulation in two populations of neurons: those with intracellularly loaded PTX and those without (Fig. 5C). Intracellular PTX resulted in significantly greater maximum depolarizations (t(54) = 2.68, p < 0.01), latencies to maximum depolarizations (t(54) = 2.51, p < 0.05), and durations of depolarizations (t(54) = 3.30, p < 0.01). After bath application of PTX, there were no significant differences between the two groups of neurons in maximum depolarization (t(35) = 1.85, p > 0.05), latency to maximum depolarization (t(35) = −0.10, p > 0.9), or duration of depolarization (t(35) = 0.29, p > 0.7).
Interpulse interval tuning is shaped by GABAergic inhibition
Different types of interactions between excitation and inhibition could potentially account for the rate-dependent changes in synaptic responses associated with IPI tuning observed in vivo and in vitro (Fig. 3). Rate-dependent attenuation in low-pass neurons could be due to depressing excitation or increasing inhibition in response to high rates of synaptic input. Similarly, rate-dependent enhancement in high-pass neurons could be due to increasing excitation or depressing inhibition in response to high rates of synaptic input. To distinguish among these possibilities, we eliminated the effects of inhibition through bath application of GABAA receptor blockers in vitro and measured the resulting changes in IPI tuning. Bath application of PTX or gabazine generally had striking effects on IPI tuning (Figs. 6, 7).
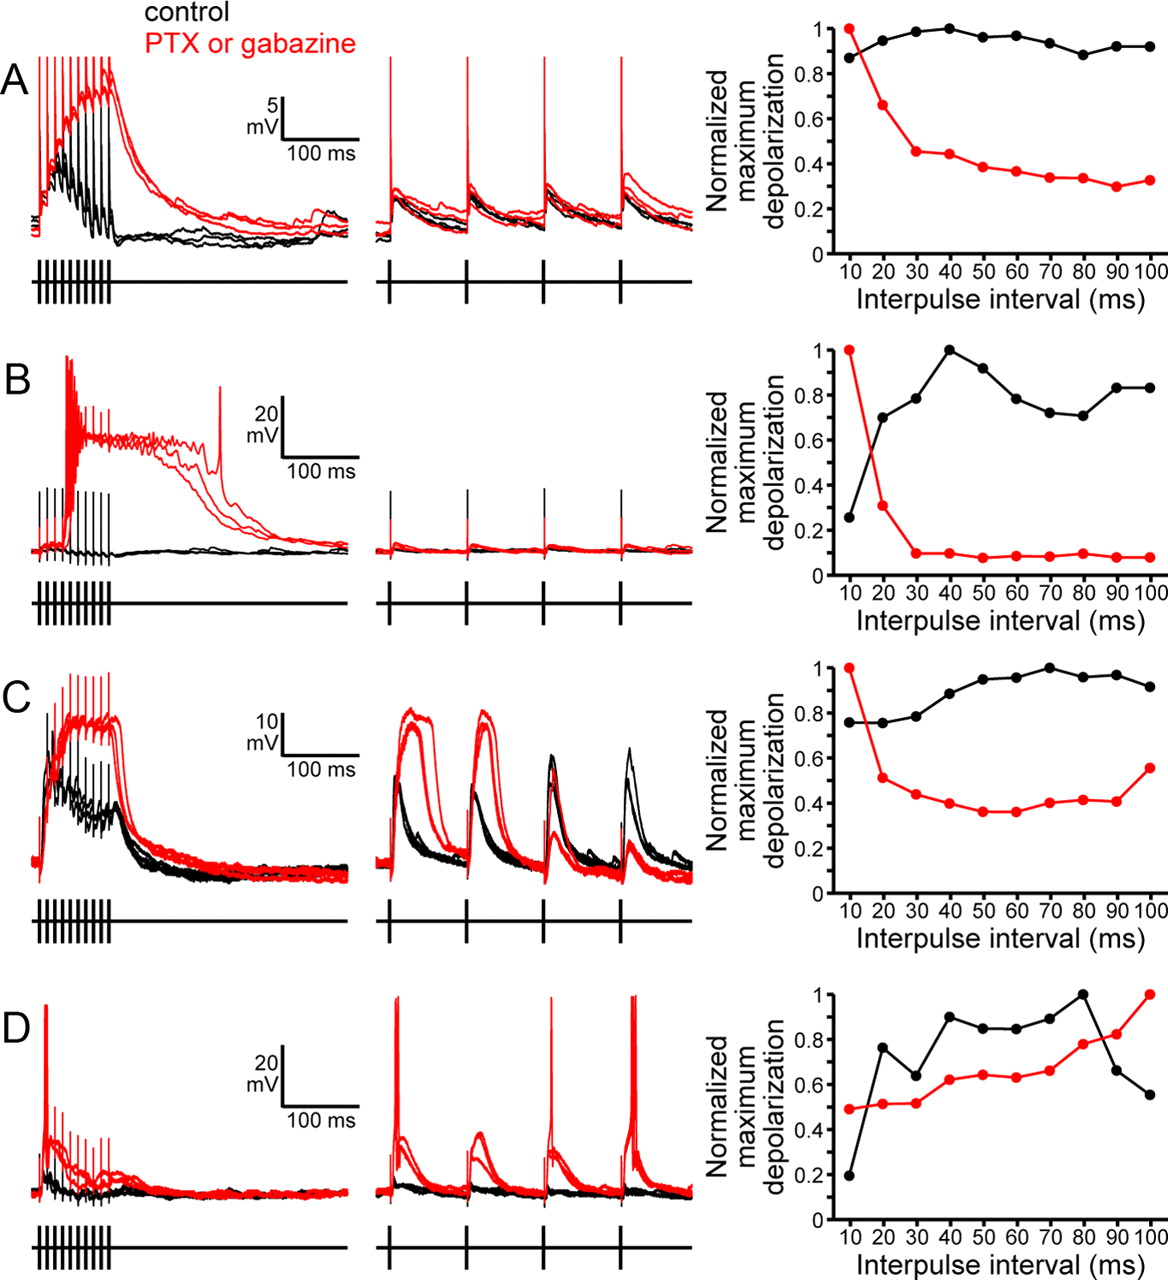
Effects of blocking GABAA receptors on IPI tuning in vitro. Responses to presynaptic stimulation with 10 pulses at IPIs of 10 ms (left) and 100 ms (right) are shown for four different neurons before (black) and during (red) wash-in of either 100 μm picrotoxin in 0.3% DMSO (PTX) or 30 μm gabazine. Stimulus times are shown below each trace, and the artifacts are visible in the recordings. In each case, superimposed responses to three stimulus repetitions are shown. IPI tuning curves showing maximum depolarizations as a function of IPI before (black) and during (red) wash-in for the same four neurons are shown on the far right. Values are normalized to the largest maximum depolarization in each condition, calculated as described in Figure 2. A, An all-pass neuron becomes high-pass during wash-in of 30 μm gabazine. B, A bandpass neuron becomes high-pass during wash-in of 30 μm gabazine. C, A low-pass neuron becomes high-pass during wash-in of 100 μm PTX in 0.3% DMSO. D, A bandpass neuron becomes low-pass during wash-in of 100 μm PTX in 0.3% DMSO.

Blocking GABAA receptors causes a general shift toward high-pass tuning. A, Effects of bath application of either 100 μm picrotoxin in 0.3% DMSO (PTX) or 30 μm gabazine on IPI tuning. Each row represents a single neuron. Horizontal bars show the range of IPI stimuli that elicited maximum depolarizations >85% of the maximum response. Gray bars show tuning before wash-in, whereas red bars show tuning during wash-in. B, Relative frequencies of low-pass, high-pass, bandpass, band-stop, complex, and all-pass neurons under five different conditions: control, bath wash-in of vehicle (0.3% DMSO), bath wash-in of PTX or gabazine, intracellular PTX, and intracellular PTX combined with bath wash-in of PTX or gabazine.
If low-pass tuning results primarily from depressing excitation in response to high rates of synaptic input, then low-pass neurons should remain low-pass tuned after blocking inhibition. However, this was generally not the case: only 3 of 15 low-pass neurons remained low-pass tuned after blocking inhibition; whereas, 8 of these neurons became high-pass tuned and 4 became bandpass or band-stop tuned (a combination of high-pass and low-pass tuning characteristics) (Figs. 6C, 7A). Thus, 12 of 15 low-pass neurons developed high-pass tuning characteristics after blocking inhibition. This strongly suggests that short-term depression of excitation is not the primary mechanism responsible for the attenuating responses of low-pass neurons at high rates of synaptic input; rather, these results indicate that inhibition plays a critical role in establishing low-pass tuning in most cases. Therefore, we conclude that increasing inhibition in response to high rates of synaptic input is a primary mechanism for establishing low-pass tuning in this circuit.
If high-pass tuning results primarily from depressing inhibition at high rates of synaptic input, then high-pass neurons should become all-pass tuned after blocking inhibition, since inhibition would no longer be blocking responses at low rates of synaptic input. However, this was universally untrue: 12 of 13 high-pass neurons remained high-pass tuned after blocking inhibition, and in 11 of these cases the high-pass tuning was actually sharpened; the one remaining neuron switched from high-pass to band-stop tuning (Fig. 7A). Therefore, we conclude that high-pass tuning generally results from increased excitation at high rates of synaptic input rather than decreased inhibition.
As a result of these effects, blocking GABAA receptors resulted in a dramatic general shift toward high-pass tuning among all 46 neurons tested (Fig. 7A). Before bath application of PTX or gabazine, 13 of these neurons were high-pass (28.3%), but after blocking GABAA receptors this number increased to 33 (71.7%). Thus, blocking GABAA receptors caused a significant change in the relative frequencies of neurons in the six different IPI tuning categories (p < 0.0001). We compared the relative frequencies of neurons in the different IPI tuning categories under the following five different conditions (Fig. 7B): control neurons (n = 71); bath wash-in of vehicle (n = 13); bath wash-in of PTX or gabazine (n = 46); intracellular application of PTX (n = 35); and intracellular PTX combined with bath wash-in of PTX or gabazine (n = 24). Nineteen of the control neurons were high-pass (26.8%). Compared with controls, blocking GABAA receptors resulted in significant increases in the relative frequencies of high-pass neurons, whether through bath wash-in of PTX or gabazine (n = 33, 71.7%; p < 0.00001), intracellular application of PTX (n = 19, 54.3%; p < 0.01), or intracellular PTX combined with bath wash-in of PTX or gabazine (n = 16, 66.7%; p < 0.001). There was no significant difference in the relative frequencies of high-pass neurons when comparing bath wash-in of PTX or gabazine with intracellular PTX (p > 0.1), or when comparing bath wash-in of PTX or gabazine with the combined treatment (p > 0.7). Bath wash-in of vehicle had no significant effect on the relative frequency of high-pass neurons compared with controls (n = 3, 23.1%; p = 1.0).
Although blocking GABAA receptors caused a highly significant shift toward high-pass tuning, this effect was not universal (Fig. 7): 28.3% of the neurons tested with bath application of PTX or gabazine were not high-pass, 45.7% of the neurons tested with intracellular PTX were not high-pass, and 33.3% of the neurons tested with both treatments were not high-pass. In particular, 3 of 15 low-pass neurons remained low-pass tuned, and 2 of 6 bandpass neurons became low-pass tuned after blocking GABAergic inhibition (Fig. 7A). This suggests that in a small subset of neurons, rate-dependent decreases in excitatory input do establish low-pass tuning. For example, after bath application of PTX, the bandpass neuron shown in Figure 6D became low-pass tuned, and this was associated with a clear rate-dependent attenuation of synaptic responses: although the synaptic responses to 100 ms IPIs were consistent, the synaptic responses to 10 ms IPIs clearly attenuated throughout the course of the stimulus train. This effect cannot be due to GABAergic inhibition under these conditions, strongly implicating short-term depression of excitation in establishing low-pass tuning for this cell. Thus, we conclude that rate-dependent increases in excitation and inhibition are the primary means for establishing IPI tuning in this circuit, but that short-term depression can play an important role in some neurons.
Temporal summation of excitation establishes high-pass interpulse interval tuning
The effects of blocking GABAergic inhibition on IPI tuning implicate rate-dependent increases in excitation as generally establishing high-pass tuning (Fig. 7). Increased excitation at short IPIs could be mediated by two distinct mechanisms: short-term synaptic plasticity (i.e., facilitation) or temporal summation of excitatory synaptic potentials. The increase in PSP duration and amplitude that results from blocking GABAA receptors (Fig. 5) predicts that repetitive stimulation should result in greater temporal summation of excitatory synaptic responses when GABAA receptors are blocked. Indeed, this is exactly what we see: increases in both the amplitude and duration of individual EPSPs result in an elevated baseline upon which subsequent EPSPs occur (i.e., temporal summation) (Fig. 6A–C). As IPI decreases, this effect increases, thereby establishing greater responses to short IPIs (i.e., high-pass tuning).
While blocking GABAergic inhibition, there was usually no apparent increase in the amplitude of each individual EPSP throughout the course of high-frequency stimulus trains (Fig. 6A,C). Thus, temporal summation rather than facilitation of EPSPs appears to be the principal mechanism by which excitation mediates high-pass tuning. However, other mechanisms may also contribute to high-pass tuning in some cases. For example, in the presence of gabazine, the neuron shown in Figure 6B responds with moderate temporal summation in response to the first three pulses of a 10 ms IPI stimulus followed by a dramatic depolarization after the fourth stimulus pulse. Such a sudden increase in response could be due to synaptic facilitation, activation of voltage-gated dendritic conductances, or recruitment of additional excitatory inputs.
The amount of temporal summation at a synapse is determined by the following three factors: PSP duration, PSP amplitude, and the intervals between synaptic inputs. Increases in PSP duration should increase the range of IPIs over which summation occurs (i.e., summation will occur at longer IPIs); increases in PSP amplitude should increase the effects of temporal summation, since subsequent PSPs will ride on top of a higher baseline. Therefore, if temporal summation of excitation is the predominant mechanism for establishing high-pass tuning, then EPSP amplitude and duration should both correlate with high-pass cutoff intervals (i.e., the longest IPI that elicits a strong response in high-pass neurons). To test this prediction, we related the amplitude and duration of PSPs in response to single-pulse stimulation in high-pass neurons to the maximum IPI that elicited a criterion response ≥85% of the maximum response (the criterion used to categorize IPI tuning; see Materials and Methods). We performed this analysis on all of the neurons that were high-pass tuned during wash-in of GABAA receptor blockers, when we could be confident that observed synaptic responses were due solely to EPSPs. Under these conditions, there was a significant correlation between EPSP duration and high-pass cutoff intervals (r2 = 0.18, t(27) = 2.40, p < 0.05), as well as between EPSP amplitude and high-pass cutoff intervals (r2 = 0.21, t(27) = 2.67, p < 0.05). Therefore, variation in EPSP amplitude and duration correlated with the range of IPIs that elicited a criterion response, consistent with high-pass tuning established through temporal summation.
Under our control conditions (i.e., both excitation and inhibition are present), it was impossible to obtain accurate information about the time course of EPSPs and IPSPs, since the two interact to establish overall synaptic responses. However, a rough measure of the relative baseline strengths of excitation and inhibition can be obtained by quantifying the maximum depolarization in response to single stimulus pulses. Among high-pass neurons, relatively strong excitation should increase bandwidth by extending the range of high-pass tuning to longer IPIs, since it will require less temporal summation for excitation to overcome inhibition. Among high-pass neurons, maximum depolarizations in response to single stimulus pulses were indeed positively correlated with high-pass cutoff intervals, both in vivo (r2 = 0.47, t(23) = 4.5, p < 0.001) and in vitro (r2 = 0.39, t(13) = 2.9, p < 0.05), again supporting a role for temporal summation of EPSPs in establishing high-pass tuning.
Temporal summation of inhibition establishes low-pass interpulse interval tuning
We were unable to isolate IPSPs by pharmacologically blocking excitatory receptors, since this treatment also blocks inhibition by silencing excitatory inputs to inhibitory interneurons. However, in a few instances we were able to predominantly stimulate inhibitory pathways to recorded cells in vitro, as evidenced by relatively strong hyperpolarizing responses to stimulation. In eight neurons, these IPSPs showed clear temporal summation in response to short IPIs (Fig. 8). Because the magnitude of temporal summation increased at shorter IPIs, all eight of these neurons exhibited low-pass IPI tuning characteristics: five of these neurons were low-pass, and three of them were bandpass (i.e., a combination of low-pass and high-pass tuning). In each case, we saw no evidence that the amplitude of individual IPSPs was enhanced throughout the course of high-frequency stimulus trains (Fig. 8), indicating that temporal summation and not facilitation was driving increased inhibition.

Temporal summation of IPSPs at high rates of synaptic input. Responses to presynaptic stimulation with 10 pulses at an IPI of 10 ms are shown for two different neurons. Stimulus times are shown below each trace, and the artifacts are visible in the recordings. In each case, superimposed responses to three stimulus repetitions are shown. A, Responses of this neuron consisted primarily of hyperpolarizations that summated at short IPIs, thereby establishing low-pass tuning. Bath application of 30 μm gabazine eliminated these hyperpolarizations, leading to summating depolarizations that resulted in high-pass tuning. B, Responses of a second neuron also consisted primarily of hyperpolarizations that summated at short IPIs. Bath application of 0.3% DMSO had no effect.
For three low-pass neurons that exhibited summating IPSPs under control conditions, we bath applied either PTX (n = 2) or gabazine (n = 1). In each case, blocking GABAA receptors eliminated these IPSPs (Fig. 8A) and unmasked summating EPSPs similar to those seen in other neurons in response to this treatment (Figs. 6A–C). The resulting temporal summation of EPSPs resulted in high-pass tuning in all three neurons. No effect was observed in one of these neurons that was treated with vehicle (Fig. 8B), confirming that the summating IPSPs of these neurons were due to GABAergic inhibition.
If temporal summation of inhibition is the predominant mechanism for establishing low-pass tuning, then IPSP amplitude and duration should both correlate with low-pass cutoff intervals (i.e., the shortest IPI that elicits a strong response in low-pass neurons). As with the analysis of EPSPs and high-pass tuning, however, it is impossible to obtain accurate information about the time course of EPSPs and IPSPs under control conditions. Nevertheless, a rough measure of the relative strengths of excitation and inhibition can be obtained by quantifying the maximum depolarization in response to single stimulus pulses. Among low-pass neurons, relatively weak inhibition should increase bandwidth (i.e., extend tuning to shorter IPIs), since it will require more temporal summation for inhibition to block excitation. Among low-pass neurons, maximum depolarizations in response to single stimulus pulses were indeed negatively correlated with low-pass cutoff intervals, both in vivo (r2 = 0.18, t(22) = −2.2, p < 0.05) and in vitro (r2 = 0.63, t(13) = −4.7, p < 0.001), consistent with a role for temporal summation of IPSPs in establishing low-pass tuning.
Temporally summating excitation and inhibition can establish a diversity of synaptic filters
To determine whether temporally summating excitation and inhibition can, by themselves, establish different temporal filters of synaptic input, we constructed simple leaky integrator neuron models that received both excitatory and inhibitory synaptic inputs in response to stimulation with constant presynaptic IPI trains. We varied three parameters of both the excitatory and inhibitory conductances (six variable parameters total): onset latency (late and lati); maximum conductance (ge and gi); and time constant (τe and τi). No synaptic plasticity of any kind was incorporated into this model. We then quantified the tuning of the resulting synaptic responses as a function of IPI in the same way we analyzed the tuning of real ELp neurons.
Figure 9 shows examples of a high-pass model neuron (Fig. 9A) and a low-pass model neuron (Fig. 9B). For the high-pass model neuron, the inhibitory conductance is relatively large, but the time constant of the excitatory conductance is relatively long. As a result, there is pronounced temporal summation of excitation and little temporal summation of inhibition at short IPIs, causing the membrane potential of the model neuron to transition from strongly hyperpolarizing potentials to depolarizing potentials (Fig. 9A). By contrast, the low-pass model neuron has a relatively large excitatory conductance, but a relatively long inhibitory time constant. As a result, the model neuron responds to the onset of a high-frequency stimulus with a strong depolarization that becomes weaker throughout the course of the stimulus train, due to strong temporal summation of inhibition but little temporal summation of excitation (Fig. 9B). Note that the basic patterns of synaptic potential responses are remarkably similar to the responses of many high-pass and low-pass neurons recorded in vivo (Carlson, 2009) and in vitro (Figs. 2, 4).

Temporal summation of synaptic conductances in response to short IPIs in model neurons. A, A model neuron with relatively weak but long-lasting excitation (ge = 0.1 nS, τe = 14 ms, late = 0 ms) is high-pass tuned to IPIs, due to temporally summating excitation gradually overcoming the relatively strong but brief inhibition (gi = 0.5 nS, τi = 2 ms, lati = 3 ms) in response to high rates of synaptic input. B, A model neuron with relatively weak but long-lasting inhibition (gi = 0.2 nS, τi = 14 ms, lati = 3 ms) is low-pass tuned to IPIs, due to temporally summating inhibition gradually suppressing the relatively strong but brief excitation (ge = 0.5 nS, τe = 2 ms, late = 0 ms) in response to high rates of synaptic input. In both examples, the upper trace shows the membrane potential of the model neuron, and the lower trace shows the excitatory (black) and inhibitory (gray) conductances (the stimulus train is shown below).
Varying the model parameters across a range of values to yield synaptic potentials with biologically realistic amplitudes and time courses (Magee, 2000; Abbott and Regehr, 2004) revealed combinations of parameters that led to low-pass tuning, high-pass tuning, bandpass tuning, band-stop tuning, and all-pass tuning (Fig. 10). Except for extreme differences in maximum conductance (e.g., ge = 0.1 nS and gi = 1 nS, or ge = 1 nS and gi = 0.1 nS), the predominant variable affecting IPI tuning was the relationship between excitatory and inhibitory time constants (τe and τi, respectively). When these were approximately equal, the model neurons tended to exhibit all-pass tuning, but when τe > τi, the model neurons tended to be high-pass, and when τe < τi the model neurons tended to be low-pass (Fig. 10), as expected due to the effects of temporally summating synaptic responses at short IPIs. Interestingly, when excitatory conductance was much larger than inhibitory conductance (e.g., ge = 1 nS and gi = 0.1 nS), the vast majority of model neurons were high-pass (Fig. 10), as seen for actual ELp neurons when washing in GABAergic receptor blockers (Fig. 7). Indeed, when no inhibitory conductance was present at all (data not shown), all model neurons were either high-pass or all-pass, the latter occurring when the excitatory time constant was short enough so that no temporal summation of excitation occurred for any IPI.

Temporal summation of excitation and inhibition can establish a diversity of synaptic filters. Each column of plots represents a different combination of excitatory (ge) and inhibitory (gi) conductance (ge/gi increases from left to right), each row of plots represents a different combination of excitatory (late) and inhibitory (lati) latency (late increases relative to lati from top to bottom), and each plot shows IPI tuning as a function of the excitatory (τe) and inhibitory (τi) time constants, which both varied from 2 to 20 ms in steps of 2 ms.
Bandpass model neurons generally had a relatively large inhibitory conductance, as well as a long excitatory time constant and an intermediate inhibitory time constant (Fig. 10). As a result, both excitation and inhibition summated at short IPIs and neither excitation nor inhibition summated at long IPIs; in both cases, the relatively strong inhibition suppressed the excitation. However, because of the difference in time constants, the excitation summated over an intermediate range of IPIs more so than did the inhibition, thereby leading to increased excitation and greater responses to intermediate IPIs (i.e., bandpass tuning).
Band-stop model neurons generally had the opposite characteristics of bandpass model neurons: relatively strong excitation, long inhibitory time constants, and intermediate excitatory time constants (Fig. 10). At short IPIs, both excitation and inhibition summated, and at long IPIs, neither excitation nor inhibition summated; in both cases, the relatively strong excitation overcame the inhibition. However, the inhibition summated over an intermediate range of IPIs more so than did the excitation, thereby leading to increased inhibition and weaker responses to intermediate IPIs (i.e., band-stop tuning).
Discussion
Our results reveal that interactions between excitation and inhibition can establish diverse temporal filters among a population of neurons. Our in vivo recordings suggest that ELp neurons receive excitation followed by inhibition (Fig. 4), likely mediated by GABAergic interneurons (Fig. 1B). Our in vitro recordings support this conclusion: application of PTX or gabazine increased maximum depolarizations, latencies to maximum depolarizations, and durations of depolarizations (Fig. 5), whereas the glycinergic antagonist strychnine had no effect on synaptic responses. GABAA blockers also had dramatic effects on IPI tuning (Figs. 6, 7), suggesting an important role for GABAergic inhibition in establishing a variety of temporal filters.
High-pass neurons typically respond to a single stimulus with small depolarizations followed by large hyperpolarizations (Fig. 4). During stimulation with short IPIs, these responses transition to being dominated by excitation (Carlson, 2009). This effect could be due to increasing excitation or decreasing inhibition in response to high rates of synaptic input. The vast majority of high-pass neurons remained high-pass tuned after blocking GABAergic inhibition (Fig. 7A), strongly suggesting that increasing excitation is the primary mechanism establishing high-pass tuning. This is consistent with the strong bias toward high-pass tuning across the population of ELp neurons when GABAergic inhibition was blocked (Fig. 7B), and in the population of model neurons with relatively weak inhibition (Fig. 10). Temporal summation of EPSPs at short IPIs was clearly evident in the synaptic responses of high-pass neurons while blocking GABAA receptors (Fig. 6A–C). In most cases, we saw no evidence of EPSP facilitation (Fig. 6A,C), although in rare cases there was an enhancement of synaptic responses beyond summation (Fig. 6B). Further, when GABAergic inhibition was blocked, the IPI tuning bandwidth of high-pass neurons was correlated with both the amplitude and duration of EPSPs in response to single synaptic inputs, again supporting a role for temporal summation of excitation in establishing high-pass tuning. We propose that the relatively strong baseline inhibition of high-pass neurons (Fig. 4) acts to suppress excitation at long IPIs and thereby establish selective responses to short IPIs, when summating excitation is able to overcome this inhibition, as illustrated by the example model neuron with a relatively long excitatory time constant (Fig. 9A). This mechanism may also establish high-pass and bandpass tuning to pulse repetition rates in the frog auditory system, for which excitation appears to overcome inhibition in a similar rate-dependent fashion (Edwards et al., 2007; Rose et al., 2011). A similar interaction between excitation and inhibition may contribute to IPI tuning within the active electrolocation sensory pathway of mormyrids (Pluta and Kawasaki, 2010).
Grothe (1994) proposed that low-pass tuning could be established by excitation followed by delayed inhibition that blocks excitatory responses to subsequent inputs. This model is supported by extracellular recordings combined with pharmacology in the auditory pathway of bats (Grothe, 1994; Yang and Pollak, 1997), and intracellular recordings from auditory neurons in frogs (Edwards et al., 2008). The shift toward high-pass tuning that resulted from blocking GABAA receptors (Fig. 7) provides strong evidence that inhibition plays an important role in establishing low-pass tuning. Further, evidence for direct excitation followed by delayed inhibition (Figs. 4, 5) is consistent with this model and can explain the observed attenuation of PSPs in response to short IPIs in low-pass neurons (Fig. 3). However, this model does not address the additional effects of temporally summating inhibition; temporal summation, but not facilitation, was clearly evident in the responses of neurons dominated by inhibitory input (Fig. 8), and this had the effect of increasing inhibition as IPI decreased.
Our results implicate temporal summation of excitation and inhibition as generally establishing high-pass and low-pass tuning behavior, respectively. In principle, this type of “push-pull” mechanism could establish a wide variety of temporal filters, including bandpass and band-stop tuning, as demonstrated by our modeling results (Fig. 10). In our model, we simulated different excitatory and inhibitory time courses by adjusting the time constants of the relevant synaptic conductances (Fig. 9). In real neurons, variability in the time course of different synaptic potentials could result from neurotransmitter release kinetics, the kinetics of transmitter diffusion and clearing, ion channel kinetics, or differences in the location of excitatory and inhibitory synapses leading to differential passive filtering effects (Magee, 2000). Under control conditions, it was not possible to separate excitatory and inhibitory potentials to determine whether high-pass and low-pass tuning is related to differences in their relative time course. However, if differences in the time course of excitation and inhibition do generate different types of tuning, then variation in the relative baseline strength of excitation and inhibition should establish differences in bandwidth within tuning categories, because this determines just how much temporal summation is required to shift the balance between excitation and inhibition. Indeed, both in vivo and in vitro, the baseline balance between excitation and inhibition was correlated with the bandwidths of low-pass and high-pass neurons.
It is likely that some subset of the neurons we recorded from were inhibitory interneurons, and it will be interesting to see how the tuning of inhibitory interneurons shapes the tuning of their target neurons. Low-pass and high-pass neurons may mutually inhibit each other. Alternatively, all-pass neurons could provide inhibitory input that is independent of IPI. Excitatory interactions within ELp between similarly tuned neurons could also contribute to tuning. Finally, various combinations of excitation and inhibition from low-pass and high-pass neurons could contribute to bandpass and band-stop tuning. Such interactions would further sharpen tuning beyond the effects of temporal summation alone. Indeed, temporal summation is unlikely to be the only mechanism for temporal filtering in ELp. Short-term synaptic plasticity can create temporal filters of synaptic input (Buonomano, 2000; Zucker and Regehr, 2002; Abbott and Regehr, 2004; Pouille and Scanziani, 2004; Blitz and Regehr, 2005; Klyachko and Stevens, 2006; Pfister et al., 2010), and in some cases this mechanism has been directly implicated in the processing of sensory information in vivo (Chance et al., 1998; Fortune and Rose, 2000, 2001; Gabernet et al., 2005; Chacron et al., 2009). Blocking GABAA receptors did not always eliminate low-pass tuning (Fig. 7), implicating short-term depression of excitation at high rates of synaptic input as establishing low-pass tuning in some cases. Indeed, depressing excitation is strongly suggested by the observed attenuation of synaptic responses of some neurons in response to high rates of synaptic input when GABAergic inhibition was blocked (Fig. 6D). Intrinsic excitability can also generate temporal filters (O'Donnell and Nolan, 2011), and voltage-dependent conductances are generally prominent in dendrites (Magee, 1999), where they can play important roles in sensory processing in vivo (Haag and Borst, 1996; Fortune and Rose, 1997, 2003; Carlson and Kawasaki, 2006).
The vast majority of ELp neurons recorded in vivo and in vitro exhibited IPI tuning (93.9% and 88.7%, respectively), consistent with a previous in vivo study (Carlson, 2009). Under both conditions, we encountered similar relative numbers of low-pass, high-pass, and bandpass neurons. For these three types of neurons, the rate-dependent changes in PSP amplitude observed in vivo and in vitro were similar: rate-dependent attenuation at short IPIs for low-pass neurons, rate-dependent enhancement at short IPIs for high-pass neurons, and rate-dependent enhancement at intermediate IPIs for bandpass neurons (Fig. 3). In addition, ELp neurons exhibit the same pattern of IPI tuning to sensory stimulation as they to do to direct electrical stimulation of presynaptic fibers in vivo (Carlson, 2009). Further, the wide range of IPIs over which synaptic responses vary is directly within the behaviorally relevant range for detecting and discriminating natural communication signals (Carlson, 2002b; Carlson and Hopkins, 2004; Wong and Hopkins, 2007). These three key observations suggest that the mechanisms for IPI tuning uncovered using pharmacological manipulation and presynaptic stimulation in vitro are directly relevant to information processing in the intact circuit. Although we did not directly study the coding of natural stimulation patterns in our slice preparation, our previous in vivo results (Carlson, 2009), and the similar response properties of neurons recorded in vivo and in vitro (Fig. 3), suggest that the coding of natural IPIs would be similar in both conditions.
The behavioral relevance of the synaptic filtering observed in vitro is a major experimental advantage of the knollenorgan system. One limitation of many slice studies is that the relationship between synaptic stimulation patterns and presynaptic spike trains that occur in vivo is unclear (Abbott and Regehr, 2004). In mormyrids, the synaptic input from ELa to ELp directly follows the timing of sensory stimulation (Carlson, 2009). This allows us to manipulate the timing of presynaptic input to ELp in vivo by varying the intervals between stimulus pulses, and in vitro by directly stimulating ELa using the same intervals. By bridging in vivo studies of information processing with in vitro studies of synaptic mechanisms, we have found that temporal summation at excitatory and inhibitory synapses can be a powerful mechanism for extracting behaviorally relevant information from a wide range of presynaptic spike patterns. The unique advantages of the mormyrid electrosensory system should continue to yield novel insights into the synaptic mechanisms for information processing.
Footnotes
-
This work was supported by grants from the National Science Foundation (IOS-0818390 and IOS-1050701 to B.A.C.) and the National Institute on Deafness and Other Communication Disorders (F30-DC011197 to A.M.L-W.). Thanks to Steve Mennerick, Jeanne Nerbonne, and Christa Baker for providing feedback on earlier versions of the manuscript.
-
The authors declare no competing financial interests.
- Correspondence should be addressed to Bruce A. Carlson, Washington University in St. Louis, Department of Biology, 1 Brookings Drive, Campus Box 1137, St. Louis, MO 63130-4899. carlson.bruce{at}wustl.edu


