

Abstract
Serotonin released within the dorsal raphe nucleus (DR) induces feedback inhibition of serotonin neuron activity and consequently regulates mood-controlling serotonin release throughout the forebrain. Serotonin packaged in vesicles is released in response to action potentials by the serotonin neuron soma and terminals, but the potential for release by dendrites is unknown. Here, three-photon microscopy imaging of endogenous serotonin in living rat brain slice, immunofluorescence, and immunogold electron microscopy detection of VMAT2 (vesicular monoamine transporter 2) establish the presence of vesicular serotonin within DR dendrites. Furthermore, activation of glutamate receptors is shown to induce vesicular serotonin release from dendrites. However, unlike release from the soma and terminals, dendritic serotonin release is independent of action potentials, relies on L-type Ca2+ channels, is induced preferentially by NMDA, and displays distinct sensitivity to the selective serotonin reuptake inhibitor (SSRI) antidepressant fluoxetine. The unique control of dendritic serotonin release has important implications for DR physiology and the antidepressant action of SSRIs, dihydropyridines, and NMDA receptor antagonists.
Introduction
Serotonin release in the dorsal raphe nucleus (DR) activates somatodendritic 5-HT1A autoreceptors, which inhibit serotonin neuron activity and the resultant release from terminals. This autoregulation is involved in responses to stress and the delayed efficacy of selective serotonin reuptake inhibitor (SSRI) antidepressants (Blier et al., 1998; Piñeyro and Blier, 1999; Adell et al., 2002; Richardson-Jones et al., 2010). However, despite this important regulatory function, the mechanism of serotonin release in the DR is not well characterized. Early serotonin measurements in the DR demonstrated high extracellular concentrations that were enhanced by depolarization and inhibited by Ca2+ depletion and the sodium channel blocker tetrodotoxin (TTX) (Hery et al., 1982, 1986). Concurrent morphological studies revealed uncharacterized vesicle clusters in the soma and dendrites of DR serotonin neurons (Chazal and Ralston, 1987). Given the paucity of serotonergic terminals in the rodent DR, it was speculated that these vesicles support somatodendritic serotonin release (Descarries et al., 1982; Brusco et al., 1983; Piñeyro and Blier, 1999). Subsequently, amperometry, membrane capacitance, and optical experiments demonstrated Ca2+-dependent vesicular serotonin release from the soma (de Kock et al., 2006; Kaushalya et al., 2008; Colgan et al., 2009). However, standard somatic release assays were not optimal for studying dendritic serotonin release and thus the presence of dendritic serotonin release in the intact DR remained unknown. Interestingly, serotonin, unlike other transmitters, can be detected directly in living cells by three-photon (3P) microscopy (Maiti et al., 1997). Although the dimness and photobleaching of serotonin fluorescence limits sensitivity and the ability to resolve release kinetics, 3P microscopy measurements of serotonin content conducted before and after stimulation have quantified serotonin release evoked by receptor activation, depolarization, and an amphetamine (Williams et al., 1999; Kaushalya et al., 2008; Colgan et al., 2009). Here, 3P imaging of endogenous serotonin and electron microscopy reveal that dendritic vesicle clusters contain vesicular monoamine transporter 2 (VMAT2) and support serotonin release in response to glutamatergic stimulation. Surprisingly, unlike dendritic transmitter release in other brain areas (Ludwig and Pittman, 2003) and serotonin release from terminals and the soma (Hery and Ternaux, 1981; de Kock et al., 2006), dendritic serotonin release occurs independently of action potentials (APs). In addition, dendritic serotonin release is shown to have unique pharmacology that suggests relevance to antidepressant action.
Materials and Methods
Slice preparation and stimulation
All experiments were conducted in accordance with protocols approved by the University of Pittsburgh Institutional Animal Care and Use Committee. Male Sprague Dawley rats, P7–P21 (Hilltop Labs), were anesthetized with isoflurane and decapitated. Brains were removed and 250-μm-thick coronal DR brain slices were cut using a vibratome (The Vibratome Company). 3P serotonin imaging was performed on slices in normal aCSF (n-aCSF) 1 h after being bathed in 95% O2 and 5% CO2-saturated, sucrose-based aCSF (s-aCSF) and 100 μm pargyline. n-aCSF, pH 7.4, contained the following (in mm): 124 NaCl, 4 KCl, 25.7 NaHCO3, 1.25 NaH2PO4, 2.45 CaCl2, 1.2 MgSO4, 11 glucose, 0.15 ascorbic acid. s-aCSF, pH 7.4, contained the following (in mm): 1 kynurenic acid, 87 NaCl, 75 sucrose, 2.5 KCl, 25 NaHCO3, 1.25 NaH2PO4, 0.5 CaCl2, 7.0 MgSO4, 25 glucose, and 0.15 ascorbic acid. For stimulation in zero Ca2+ aCSF, CaCl2 in n-aCSF was replaced with MgCl2 and 1 mm EGTA was added.
For 5,7-dihydroxytryptamine creatine sulfate (dHT) (Regis Technologies) experiments, slices were incubated in 5% CO2 at 37°C in s-aCSF supplemented with 20 μm dHT, 568 μm ascorbate, and 100 μm pargyline for 3 h to allow time for uptake into the neurons and transport into vesicles (Gershon and Sherman, 1982; Colgan et al., 2009). Slices were washed with n-aCSF before imaging. Reserpine (Sigma-Aldrich; 500 nm in 0.004% acetic acid) was added to slices 10 min before dHT loading when indicated.
For electrical field stimulation, 30–32°C oxygenated n-aCSF-perfused slices were placed in between platinum electrodes across which 5 Hz, 2 ms pulses of 10 mA positive constant current was passed for 2 min. Glutamate receptor inhibitors (GluRIs) APV [(2R)-amino-5-phosphonovaleric acid; (2R)-amino-5-phosphonopentanoate; Sigma-Aldrich; 50 μm] and NBQX (2,3-dihydroxy-6-nitro-7-sulfamoyl-benzo[f]quinoxaline-2,3-dione; Sigma-Aldrich; 10 μm) were added 10 min before electrical stimulation. Parachloroamphetamine (pCA) (Sigma-Aldrich) was also applied at 32°C. For stimulation with ionotropic glutamate receptor agonists, AMPA (Sigma-Aldrich; 10 μm) or NMDA (Sigma-Aldrich; 50 μm) was applied to slices in room temperature n-aCSF for 1 min. In glutamate puffing experiments, a patch pipette containing 0 or 10 mm sodium glutamate and 1 μm sulforhodamine B in n-aCSF was positioned in the slice, and pressure pulses were applied for 100 ms at 3 Hz for 1 min at room temperature.
The drugs fluoxetine (Sigma-Aldrich; 0.1–10 μm), N,N,H,-trimethyl-5-[(tricyclo[3.3.1.13,7]dec-1-ylmethyl)amino]-1-pentanaminiumbromide hydrobromide (IEM 1460) (Tocris Bioscience; 100 μm), nimodipine (Tocris Bioscience; 3 μm in 0.03% ethanol), and 8-hydroxy-2-(di-n-propylamino)-tetralin (DPAT) (Tocris Bioscience) were loaded into slices 5 min before imaging, while TTX (Alomone Labs; 1 μm) was added 20 min before experiments. N-[2-[4-(2-Methoxyphenyl)-1-piperazinyl]ethyl]-N-(2-pyridyl)cyclohexanecarboxamide (WAY 100635) (Sigma-Aldrich; 30 nm) was added 10 min in advance for uptake into the slice. All drugs remained present during stimulation.
Immunohistochemistry and immunogold electron microscopy
Tissue preparation.
The Children's Hospital Boston's Institutional Animal Care and Use Committee approved the experimental protocol used. Rats were anesthetized with sodium pentobarbital (75 mg/kg) and were perfused transcardially with either 4% paraformaldehyde in 0.1 m phosphate buffer (PB), pH 7.6, for fluorescence microscopy or a combination of 2% paraformaldehyde and 3.75% acrolein in PB for electron microscopy. For light microscopy, tissue was equilibrated in 25% sucrose and sectioned 10 μm thick using a cryostat. For electron microscopy, 50-μm-thick sections were cut using a vibratome and incubated with 1% sodium borohydride and then 1% bovine serum albumin (BSA) in PB before immunohistochemical processing.
Immunohistochemistry.
Affinity-purified polyclonal antibody (Millipore; AB1767) raised against a peptide from the intracellular C-terminal region of human VMAT2 was used at a dilution of 1:1000. VMAT2 antiserum was used in combination with goat anti-5-HT (ImmunoStar; 20079) diluted 1:1000 and chicken anti-MAP2 (Novus Biologicals; NB300-213) diluted 1:10,000. For immunofluorescence detection, tissue sections were incubated with three primary antisera overnight at 4°C. After rinsing, labeling was visualized using CY3-conjugated donkey anti-rabbit (Jackson ImmunoResearch) in combination with Alexa 488-conjugated donkey anti-sheep (Invitrogen) and CY5-conjugated donkey anti-chicken (Jackson ImmunoResearch) secondary antisera. Secondary antisera had minimal cross-reactivity to other relevant species. Sections were coverslipped using an aqueous glycerol mounting media. Sections were examined using an Olympus spinning disk confocal system.
Immunogold labeling and electron microscopy.
Sections were processed for single immunolabeling of VMAT2 using immunogold labeling methods. To confirm the distribution of VMAT2, separate sections were processed using immunoperoxidase labeling methods. For this, tissue sections were incubated with anti-VMAT2 antiserum for 2 d at 4°C with constant mild agitation. Sections were incubated with a donkey anti-rabbit biotinylated secondary IgG (Jackson ImmunoResearch). For immunogold labeling, tissue was incubated in 0.5% BSA with gelatin followed by 1.4 nm gold (Nanogold)-conjugated streptavidin (Nanoprobes). After several rinses in 0.1 m Tris saline and 0.1 m sodium citrate, pH 7.4, the gold particles were enhanced using the GoldEnhance EM kit (Nanoprobes) for 8 min. For immunoperoxidase labeling, after incubation with the biotinylated secondary IgG, sections were then processed using the ABC Elite Kit (Vector Laboratories) at one-half the recommended concentration. Sections were incubated for 7 min with the Vector SG substrate kit. For electron microscopy, tissue was incubated in 2% osmium for 20 min and dehydrated in a graded series of ethanol solutions, followed by propylene oxide. Tissue was embedded between two sheets of plastic using EMbed 812. Areas were selected for analysis from the DR, primarily the medial portions where VMAT2 labeling was most abundant. Thin sections (70 nm) of selected areas were stained using uranyl acetate and Reynold's lead citrate.
Patch clamping
Oxygenated room temperature n-aCSF was superfused over DR slices at 1–2 ml/min. Serotonin neurons in the DR were identified by multiphoton serotonin imaging. Pipettes (4–7 MΩ resistance) contained the following (in mm): 120 potassium gluconate, 20 KCl, 10 HEPES, 2 MgCl2, 0.1 EGTA, 1.2 ATP, 0.03 ascorbate, and 0.01 sulforhodamine B, pH 7.3. In the whole-cell current-clamp configuration, neurons were held at −65 mV. Ten millisecond, 0.2 nA current pulses (STIM) were injected at 10 Hz for 30 s to induce action potential firing. For control experiments (CTL), 0.0 nA of current was injected while all other parameters were identical. Regions of interest around dendritic puncta of patch-clamped neurons were normalized to neighboring nonpatched serotonin neurons and to control experiments.
Multiphoton serotonin imaging
Z-stacks of consecutive, 1.5 μm spaced images through the DR were taken before and after stimulation using an Olympus Fluoview FV1000 upright scanning microscope. Endogenous serotonin was excited by 3P excitation using 740 nm pulsed light from a Coherent chameleon ultra titanium sapphire laser. Excitation light was attenuated with an acoustical optical modulator and expanded with a motorized telescope (LSM Technologies) before being focused by a 60×, 1.0 NA water-immersion objective. Emission light <505 nm was collected through a saturated copper sulfate-filled quartz filter with a non-descanned detector (LSM Technologies), containing a cooled Hamamatsu photomultiplier tube. In experiments in which neuronal morphology was determined along with serotonin content, sulforhodamine B dialyzed into the cell via a patch pipette (see above) was imaged using the same excitation wavelength by collecting fluorescence >505 nm (505dcxr; Chroma Technology) through a 610/50 bandpass filter (Chroma Technology).
dHT imaging
Stacks of consecutive, 2.0 μm spaced images through dHT-loaded DR slices were acquired through two-photon excitation of dHT with 725 nm light. Induced fluorescence was collected by a 400–480 nm bandpass filter (Chroma Technology). The illumination power used to excite dHT was two-thirds the power used for three-photon serotonin imaging; endogenous serotonin could not be detected using the optical parameters for dHT imaging.
Image analysis
Analysis was done with NIH ImageJ software. Images were contrast enhanced or pseudocolored to aid figure presentation without altering the primary data used for quantification. When necessary, stacks of images were aligned with the ImageJ plug-in StackReg. Mean fluorescence intensity was measured in dendritic puncta in a single image or in the soma in a summed Z-projection and subtracted by background values (i.e., unloaded cells or tissue background fluorescence) and percentage change in fluorescence [ΔF(%) = (1 − (F/F0)) * 100] due to stimulation was quantified. n represents the number of fluorescent regions from which data were collected. All data were compiled from at least three independent experiments. Error bars represent SEM. For statistical analysis with only two experimental data sets, Student's t test was used. With multiple comparisons, ANOVA was used with the Bonferroni or Tukey's post test.
Results
VMAT2 and serotonin in dendrites
Imaging serotonin in DR brain slice by 3P microscopy reveals fluorescence in somata and also in puncta (Fig. 1A). With similar laser power, such puncta were not obvious in other brain areas known to have serotonin axon terminals. Given that there are unidentified vesicle clusters in serotonin neuron dendrites in the DR (Chazal and Ralston, 1987), this observation led us to hypothesize that puncta arise from dendritic serotonin-containing vesicles.

Fluoxetine-sensitive depletion of puncta by pCA. A, Top, Summed fluorescence from 3P image stack using serotonin optics in a DR brain slice before and after a 20 min bath application of 20 μm pCA. Bottom, Single image planes from the boxed areas in A. Scale bars: Top, 20 μm; bottom, 2 μm. B, Quantification of puncta depletion by aCSF (CTL, n = 13), pCA (n = 16), 10 μm fluoxetine (n = 7), or fluoxetine and pCA (n = 6). pCA was different from each of the other conditions: ***p < 0.001. Error bars indicate SEM.
First, we confirmed that the fluorescence of puncta was consistent with excitation properties of serotonin. Although native molecules such as NADPH can be excited by the same wavelength of light as serotonin, fluorescence deriving from these ubiquitous fluorophores can be distinguished from serotonin by their distribution and mode of excitation. Specifically, these molecules would be widely distributed and subject to two-photon excitation, which would produce a maximum slope of 2.0 in a log fluorescence–log excitation power plot. However, as noted above, puncta were limited in number and concentrated in the raphe nuclei. Furthermore, the log fluorescence–log excitation power slope for DR puncta was 2.7 ± 0.4 (n = 5), consistent with the signal being dominated by 3P excitation.
To further determine whether the punctate signal originates from serotonin, slices were treated with pCA, which by virtue of its uptake by the plasma membrane serotonin transporter SERT preferentially evokes serotonin release (Crespi et al., 1997). In agreement with prior experiments (Kaushalya et al., 2008), pCA reduced serotonin fluorescence in the soma. Furthermore, puncta fluorescence was also reduced by pCA (Fig. 1A). Importantly, the specific SERT blocker fluoxetine had no effect on its own, but inhibited the depletion of puncta by pCA (Fig. 1B). The SERT dependence of fluorescence depletion by pCA further supports the conclusion that puncta are derived from serotonin.
Next, immunolabeling techniques were used in the DR to determine the subcellular distribution of VMAT2, which is required for packaging serotonin. To unambiguously define the distribution of VMAT2 in serotonin neuron axons versus dendrites, triple immunolabeling of serotonin (5-HT), VMAT, and MAP2, a marker for dendrites, was examined (Fig. 2, top). Colocalization of 5-HT, VMAT2, and MAP2 showed that VMAT2 is present in the dendrites of serotonin neurons (Fig. 2A,B).

VMAT2 is present in serotonin neuron dendrites. Top, Montage of single optical sections of the dorsal raphe nucleus immunolabeled for serotonin (5-HT, green), VMAT2 (red), and the dendritic marker MAP2 (blue). Scale bar, 10 μm. 5-HT and VMAT2 immunolabeling are present in somata (arrowheads in top panel), laterally traversing dendrites (A), dendrites cut in cross section (B), and axon-like processes (C). A, Merged image (left) and each fluorophore visualized independently (right). 5-HT has a diffuse, cytoplasmic distribution within dendrites and is also detected as small hot spots of immunolabeling (arrowhead). These often coincide with VMAT2 immunolabeling in structures identified as dendrites due to the presence of MAP2 (arrowheads). B, 5-HT immunolabeling in dendrites (2–3 μm in diameter; arrowhead and arrow). The arrowhead points to coincident 5-HT, VMAT2, and MAP2. C, 5-HT axon with varicosities also immunolabeled for VMAT2 are morphologically distinguished by their smaller size (<1 μm) and beaded morphology, and correspondingly lack MAP2 immunolabeling. Note that fine 5-HT-immunolabeled axon (arrowhead) is double labeled for VMAT2 but lacks corresponding MAP2 immunolabeling. Scale bar: Boxed region insets, 5 μm.
Further analysis focused on the morphology and serotonin content of VMAT2- and 5-HT-positive sites. In dendrites, these sites were often spindle-shaped with a narrow axis maximal diameter of 1.4 ± 0.1 μm. However, serotonin terminal boutons, identified as structures containing 5-HT and VMAT2 but lacking MAP2, were typically round with a diameter of 0.31 ± 0.02 μm and interspersed with very fine axon segments (Fig. 2C). Quantification in three images containing 38 dendritic sites and 37 terminal boutons showed that, along with their greater size, dendritic sites also contained 8.3 ± 1.5-fold more serotonin immunofluorescence. The far greater abundance of serotonin in dendritic sites, which would yield more fluorescence above background in multiphoton microscopy images, explains why terminals were relatively difficult to detect by 3P microscopy outside the raphe nuclei. Indeed, the abundance of serotonin and the dimensions of dendritic serotonin sites both imply that the micron size puncta detected by 3P microscopy (Fig. 1A and below) are dominated by VMAT2-containing dendrites.
To determine whether VMAT2 immunolabeling present in dendrites was associated with vesicular structures, immunogold labeling for VMAT2 was combined with electron microscopy (Fig. 3). Within dendrites, identified at the ultrastructural level by their size, abundant cytoplasmic content, presence of microtubules, and receipt of synaptic contact from smaller axon boutons, the distribution of VMAT2 in the DR was similar to that described in the ventral tegmental area (Nirenberg et al., 1996). Specifically, VMAT2 immunolabeling was localized to clear vesicles (average diameter, 38 ± 3 nm) sometimes clustered together, and occasionally to dense-core vesicles (Fig. 3A–D). In addition, structures consistent with early endosomes and tubule vesicles were identified with immunogold labeling for VMAT2 (Fig. 3D).

Dendritic distribution of immunogold labeling for VMAT2 in the DR. A, At the ultrastructural level, dendritic profiles [Den, identified by their large cross section (outlined in yellow) and microtubules] contain immunogold labeling for VMAT2. Ax, Adjacent axons. B, Higher magnification of boxed area in A reveals immunogold labeling is associated with a cluster of clear vesicles (arrows) as well as a large dense-core vesicle (arrowheads). C, Dendrite cut in cross section contains a cluster of clear vesicles decorated with immunogold labeling for VMAT2 (arrows). D, In some cases, VMAT2 immunolabeling appeared associated with vesicular structures reminiscent of early endosomes and tubule vesicles (tv). A dense-core vesicle is also visible (arrowhead) in this dendrite.
The above results suggest that the punctate serotonin fluorescence detected by multiphoton microscopy in unfixed DR brain slices arises from clusters of VMAT2 vesicles in serotonin neuron dendrites. This issue was further addressed by dialyzing individual neurons identified based on their somatic serotonin fluorescence via a patch pipette with sulforhodamine B to reveal their morphology. In addition to the soma, sulforhodamine B labeled a single very thin axon, which could be discriminated only with a very high gain setting due to its low volume, and large tapering processes, which were identified as dendrites based on morphological criteria, reference to MAP2 staining (see above), and subsequent functional studies (see below). Serotonin fluorescence induced by 3P excitation was then examined. Strikingly, punctate fluorescence was detected with serotonin optics within dendrites (Fig. 4A). Together, the above optical and immunodetection data all support the conclusion that VMAT2 is present in dendrites to package serotonin into vesicle clusters, which are detected as puncta by multiphoton microscopy.

Dendritic localization and glutamate receptor-dependent depletion of puncta. A, Summed fluorescence from a stack of images of a sulforhodamine B-filled serotonin neuron (red). Scale bar, 10 μm. At this gain, the limited volume of axons precludes their detection by soluble sulforhodamine B fluorescence, but large tapering dendrites are evident. Inset, Single optical section showing overlay of serotonin (green) and sulforhodamine B (red) from a dendrite. B, Left, Pseudocolored puncta before (Pre) and after (Post) electrical field stimulation (5 Hz, 2 min, 10 mA). Scale bar, 2 μm. Right, Quantification of fluorescence loss [ΔF% = (1 − FPost/FPre) * 100] in puncta upon stimulation (Stim, n = 18), in zero Ca2+ (Stim in 0 Ca2+, n = 10), and in the presence of GluRIs (50 μm APV and 10 μm NBQX, n = 25). C, Serotonin release by 1 min bath application of control aCSF (CTL), NMDA (50 μm), AMPA (10 μm), or agonists in zero Ca2+ aCSF (0 Ca2+, n = 8). **p < 0.01, ***p < 0.001. Error bars indicate SEM.
Glutamate-evoked release from dendritic VMAT2 vesicles
We then explored whether puncta represent a releasable pool of vesicular serotonin. First, electrical field stimulation (5 Hz for 2 min) evoked loss of puncta fluorescence that required extracellular Ca2+ (Fig. 4B). Induction of release by direct depolarization of serotonin neurons would be unaffected by blocking dendritic glutamate receptors. However, the ionotropic GluRIs APV (50 μm) and NBQX (10 μm) attenuated fluorescence depletion from puncta (Fig. 4B). This suggests that electrical stimulation excites presynaptic glutamatergic inputs, which are substantial on DR serotonin neuron dendrites (Soiza-Reilly and Commons, 2011). Consistent with this conclusion, bath-applied ionotropic glutamate receptor agonists (50 μm NMDA or 10 μm AMPA for 1 min) also induced Ca2+-dependent fluorescence loss from puncta (Fig. 4C). Therefore, activation of ionotropic glutamate receptors is sufficient to induce serotonin release.
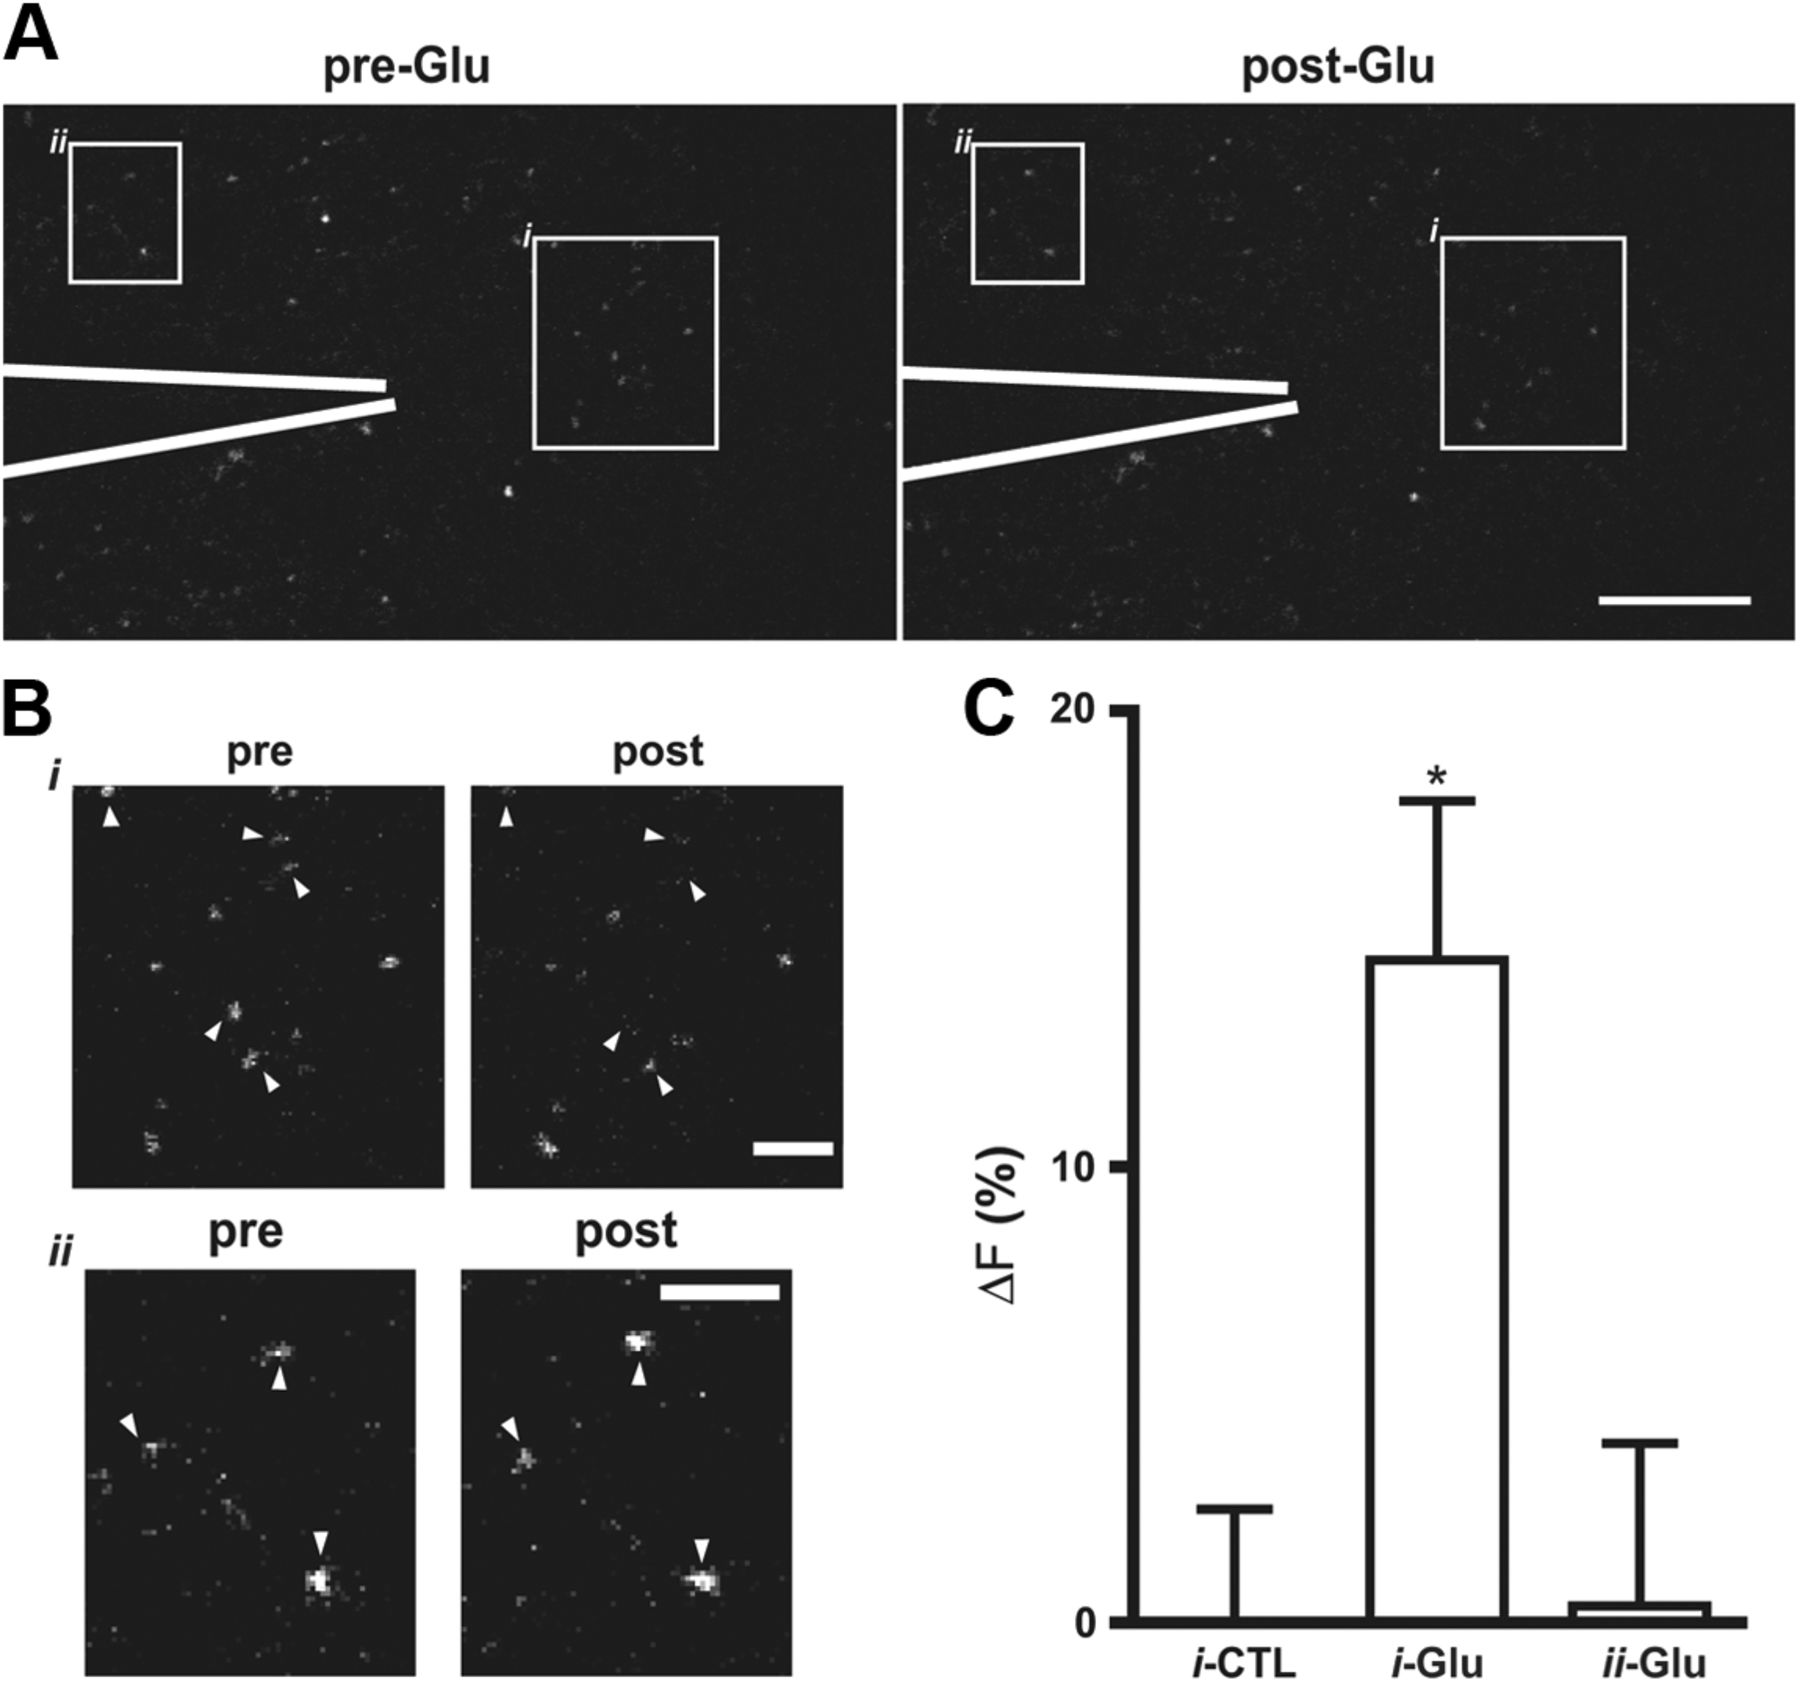
To confirm that glutamate can induce serotonin release, glutamate was delivered into the DR brain slice through a puffer pipette. Repetitive puffs (3 Hz for 1 min) of glutamate (but not vehicle) evoked serotonin depletion from puncta (Fig. 5). Conventional release from terminals triggered by dendritic ionotropic glutamate receptors relies on propagating APs. Therefore, terminals would not be expected to respond directly to local glutamate puffs. Furthermore, AP propagation would ensure that release from terminals was evoked at sites distal to locally applied glutamate. However, puncta depletion occurred only in front of the pipette and not to the side of the pipette (Fig. 5, compare data from boxes i and ii). This localized response is consistent with the conclusion that local glutamate application evokes serotonin release from dendrites.

Localized puncta depletion by glutamate puffs. A, 3P serotonin image in the brain slice with a puffer pipette indicated in white. The boxed regions i and ii are positioned in front and to the side of the pipette, respectively. Scale bar, 20 μm. B, Boxed regions i and ii. Scale bar, 5 μm. C, Quantification of responses evoked by puffing vehicle (CTL, n = 7) or glutamate (Glu) analyzed in front of the pipette (i, n = 13) or to the side of the pipette (ii, n = 11). i-Glu was different from CTL and ii-Glu: *p < 0.05. Error bars indicate SEM.
Therefore, the hypothesis that glutamate receptor-evoked responses are derived from dendritic VMAT2 vesicles was tested. For these experiments, it was necessary to identify dendrites and to inhibit VMAT2 with reserpine. Both of these requirements were met by imaging the exogenously applied fluorescent serotonin analog dHT, which is taken up by SERT into the cytoplasm and then packaged by VMAT2 in vesicles (Gershon and Sherman, 1982; Colgan et al., 2009). First, as with sulforhodamine B (Fig. 4A), dHT labels the cytoplasm, enabling identification of large tapering dendrites emanating from the soma (Fig. 6A, top). Second, although the fluorescence of reserpine confounds 3P serotonin measurements, reserpine does not interfere with dHT fluorescence detection and can be included in the medium to prevent vesicular packaging of the analog (Colgan et al., 2009). Therefore, the effect of reserpine on AMPA-evoked dHT fluorescence depletion was examined. In fact, preventing vesicular packaging of dHT with reserpine reduced Ca2+-dependent AMPA responses in dendrites (Fig. 6A,B). Thus, glutamate receptor activation induces release from VMAT2 vesicles in serotonin neuron dendrites.

VMAT2 is required for dendritic release. A, Top, Image stack showing a dHT-labeled raphe neuron. Bottom, Pseudocolored dHT signal in the boxed region of the dendrite before (CTL) and after AMPA. Scale bars: Top, 20 μm; bottom, 2 μm. B, Dendritic dHT fluorescence response to vehicle (CTL, n = 9), AMPA in 0 Ca2+ (n = 9), AMPA (10 μm; n = 5), and AMPA in slices in which dHT was applied in the presence of reserpine (500 nm; n = 13). AMPA was different from other experimental conditions: *p < 0.05. Error bars indicate SEM.
Action potential-independent responses
While forward propagating APs evoke release from terminals, backpropagating APs can trigger somatodendritic transmitter release (Ludwig and Pittman, 2003). Consistent with this expectation and previously reported AP-dependent exocytosis from the serotonin neuron soma (de Kock et al., 2006), blocking voltage-gated sodium channels with TTX inhibited AMPA-stimulated somatic serotonin fluorescence responses (Fig. 7A,B, Soma). However, surprisingly, fluorescence depletion of puncta was unaffected by TTX (Fig. 7A,B, Puncta). This independence from sodium channels is not consistent with AMPA-evoked release from terminals, which would be mediated by the propagation of TTX-sensitive APs. Therefore, the observed TTX insensitivity further supports the conclusion that glutamate receptor activation stimulates release from dendrites.

Dendritic serotonin release does not require voltage-gated sodium channels. A, Pseudocolored summed z-projection of serotonin signal in soma (scale bar, 10 μm) and single optical section of dendritic serotonin puncta (scale bar, 2 μm) before (CTL) and after AMPA in the presence of TTX (1 μm). B, Quantification of somatic and dendritic serotonin release response in the absence and presence of TTX (n ≥ 8). ****p < 0.0001. Error bars indicate SEM.
Dendritic release can be produced by backpropagation of the Ca2+ component of the AP without the involvement of sodium channels (Acuna-Goycolea et al., 2008). To explore whether this mechanism operates in serotonin neuron dendrites, patch-clamped sulforhodamine B-filled serotonin neurons were directly stimulated by injection of current pulses into the soma to evoke a 30 s, 10 Hz train of APs (Fig. 8A). If the Ca2+ component of the AP propagates to evoke dendritic release, then APs induced by somatic current injection would evoke serotonin release from puncta in large tapering dendrites. However, while release from the soma was robust (Fig. 8B, Soma), no serotonin release was evoked from puncta located in large tapering processes (Fig. 8B, Dendrites). The insensitivity to APs verifies that the large tapering processes are dendrites, not axons. More importantly, these experiments show that, unlike serotonin release from the soma and terminals (Hery and Ternaux, 1981; de Kock et al., 2006) or dendritic release of other transmitters by spiking neurons (Ludwig and Pittman, 2003), dendritic serotonin release is not evoked by backpropagating APs.

Dendritic serotonin release is independent of somatic action potentials. A, Recorded somatic APs evoked by 0.2 nA current pulse injection at 10 Hz for 30 s. Calibration: Vertical, 25 mV; horizontal, 2 s. Inset, Expanded timescale of 0.5 s region indicated by black bar. B, Serotonin release in the soma and dendritic puncta evoked by somatic APs (n ≥ 4). Dendritic puncta ranged in distance from soma (∼25–125 μm) with no apparent trend in release with distance. **p < 0.01. Error bars indicate SEM.
L-type Ca2+ channels support dendritic, but not somatic, serotonin release
Without a requirement for APs, the above results raise the question of how glutamate receptors induce Ca2+ entry to stimulate dendritic serotonin release. To identify the Ca2+ channel responsible for AMPA-evoked dendritic serotonin release, specific blockers were applied to the slice. First, we considered that local dendritic release by nonexcitable retinal amacrine cells is triggered by Ca2+ entry through AMPA receptors (Chávez et al., 2006). However, 100 μm IEM 1460, a Ca2+-permeable AMPA receptor antagonist, did not affect AMPA-induced fluorescence depletion of puncta (Fig. 9A, left).

Dendritic release requires L-type Ca2+ channels. A, Dendritic release responses to AMPA or NMDA in the presence and absence of IEM 1460 (100 μm) or nimodipine (3 μm). n ≥ 5. ****p < 0.0001. B, Somatic release response to AMPA or NMDA in the presence and absence of nimodipine (3 μm). n ≥ 5. Nimodipine did not have a significant effect in the soma. Error bars indicate SEM.
With the exclusion of Ca2+ influx through AMPA receptors, a role for L-type Ca2+ channels was tested. Previous consideration of dendritic Ca2+ signals in serotonin neurons (de Kock et al., 2006) had not considered the contribution of voltage-gated Ca2+ channels perhaps because L-type channels make a small contribution to somatic Ca2+ current in DR serotonin neurons (Penington et al., 1991) and other channels would be prone to inactivation. However, the Cav1.3 L-type channel isoform, which activates at negative potentials and can produce sustained currents (Lipscombe et al., 2004), is abundant in the DR (Sukiasyan et al., 2009) and modulates depression-like behavior (Busquet et al., 2010). Furthermore, L-type channels have been implicated in dendritic release of neuropeptides and cannabinoids (Simmons et al., 1995; Lenz et al., 1998). Therefore, the hypothesis that L-type Ca2+ channels are important for release by serotonin neuron dendrites was tested by applying 3 μm nimodipine, a specific L-type channel blocker with antidepressant properties (Casamassima et al., 2010). As expected, nimodipine did not affect AMPA-evoked release from the soma (Fig. 9B, left). However, nimodipine abolished AMPA-evoked fluorescence depletion from DR puncta (Fig. 9A, middle). Given the insensitivity of serotonin release from terminals to L-type channel blockers (Sharp et al., 1990), this further supports the conclusion that depletion of puncta reflects serotonin release from dendrites. Furthermore, these results demonstrate that L-type Ca2+ channels are required for the AMPA-evoked response.
Previously, Ca2+ influx through NMDA receptors had been found to directly evoke serotonin release from the soma in absence of Mg2+, leading to the hypothesis that a similar mechanism operates in dendrites (de Kock et al., 2006). However, because physiological Mg2+ normally attenuates (but does not completely block) NMDA receptor-evoked Ca2+ influx, it was not clear whether this release could occur in the presence of Mg2+. In fact, even with the high concentration used here, NMDA was not effective at inducing somatic serotonin release in the presence of Mg2+ (Fig. 9B, right). However, even with Mg2+, NMDA did evoke substantial serotonin depletion from puncta (Fig. 9A, right open bar). de Kock et al. (2006) suggested that NMDA-induced release might be mediated solely by Ca2+ permeation through the NMDA receptor itself (i.e., without the involvement of voltage-gated Ca2+ channels). However, given that Ca2+ influx through NMDA receptors was not sufficient for release from the soma, the role of L-type channels in NMDA-evoked dendritic release was examined. As was found with AMPA, NMDA-induced depletion of puncta was eliminated by nimodipine (Fig. 9A, right black bar). These results have several implications. First, in the presence of physiological Mg2+, NMDA evokes release preferentially from dendrites. Second, because selectively blocking L-type channels inhibits NMDA-evoked responses, Ca2+ entry through NMDA receptors was not sufficient for the response in the above experiments. Finally, unlike serotonin release from the soma (see above) and terminals (Sharp et al., 1990), dendritic serotonin release triggered by AMPA or NMDA receptors requires L-type Ca2+ channels.
Distinct SSRI antidepressant sensitivity of dendritic serotonin release
SSRI antidepressants such as fluoxetine (Prozac) enhance activation of 5-HT1A autoreceptors, which in turn decreases AP-triggered release of serotonin by DR neurons (Blier et al., 1998; Piñeyro and Blier, 1999). Because APs do not evoke dendritic release (Fig. 8B), the effect of fluoxetine on serotonin fluorescence depletion from the soma and puncta was compared. In both compartments, a high concentration of fluoxetine (10 μm) nearly eliminated AMPA-induced serotonin depletion (Fig. 10A, red bars). Furthermore, in both compartments, inhibition was blocked by preincubation of the slice with the 5-HT1A receptor antagonist WAY 100635 (Fig. 10A, black bars). These results imply that SSRI-autoreceptor inhibition can occur throughout the somatodendritic compartment.

Distinct sensitivity of dendritic serotonin release to the SSRI fluoxetine. A, Somatic and dendritic AMPA-evoked serotonin release responses in the presence of fluoxetine (Fluox, 10 μm) and WAY 100635 (WAY, 100 nm). n ≥ 7. **p < 0.01; ***p < 0.001. B, Fractional inhibition of AMPA-evoked release by fluoxetine in the dendrites (red; IC50 = 1.5 μm) and soma (black; IC50 = 0.3 μm); n ≥ 7. C, Fractional inhibition of AMPA-evoked release by DPAT; n ≥ 8. Error bars indicate SEM.
To determine whether there is a quantitative difference in the operation of this mechanism in dendrites and the soma, AMPA-evoked serotonin release was measured with varying fluoxetine concentrations. Analysis of concentration dependence showed that the fluorescence response of the soma has approximately fivefold greater sensitivity to fluoxetine than responses from puncta (Fig. 10B): log (IC50 in μm) was −0.52 ± 0.20 for the soma and 0.16 ± 0.18 for puncta (p < 0.01). Because differential function of autoreceptors might underlie this difference in SSRI sensitivity, the effect of direct activation of 5-HT1A receptors with the agonist DPAT on AMPA responses in the two compartments was determined. Concentration–response analysis failed to reveal a statistically significant difference between the DPAT effect in the soma and puncta (Fig. 10C). Therefore, differences in SERT function (i.e., specific activity or cell surface expression) or the geometry that affects serotonin diffusion from release sites to autoreceptors (e.g., distance between sites of exocytotic release, SERT, and autoreceptors) must be involved. Most importantly, dendritic serotonin release is characterized by its lower sensitivity to SSRI-autoreceptor inhibition. This reduced sensitivity, along with independence from APs, responsiveness to NMDA, and reliance on L-type Ca2+ channels, uniquely characterizes serotonin release from dendrites.
Discussion
Unique properties of dendritic serotonin release established by 3P microscopy
By using multiphoton microscopy in living brain slices along with immunofluorescence and electron microscopy, vesicular serotonin release from dendrites in the DR was demonstrated for the first time. Punctate fluorescence was established to represent serotonin based on properties of multiphoton excitation, its detection in processes of dialyzed serotonin neurons, and its depletion by parachloroamphetamine in a SERT-dependent manner. Furthermore, several lines of evidence indicate that 3P 5-HT puncta represent a vesicular pool of serotonin within dendrites, including (1) colocalization of serotonin with VMAT2 and the dendritic marker MAP2; (2) ultrastructural distribution of VMAT2 vesicle clusters in DR neuron dendrites; (3) the difficulty to detect serotonin axon terminals in projection areas, likely explained by the more than eightfold abundance of serotonin in dendrites then axons; (4) dendritic serotonin/VMAT2 profiles were much larger than terminal boutons, and consistent with the size of puncta detected by 3P microscopy; (5) 3P puncta were detected in dendrites of filled serotonin neurons; (6) release evoked by electrical stimulation or glutamate agonists required extracellular Ca2+; and (7) the VMAT2 inhibitor reserpine inhibited dendritic responses. Furthermore, in contrast to standard release from terminals triggered by glutamate receptors, responses were localized, required L-type Ca2+ channels, and did not require sodium channels. Together, these data show that serotonin neuron dendrites are capable of vesicular release. However, unlike dendritic release found in other spiking neurons (e.g., dopamine neurons), this release is based on dendritic glutamatergic excitation without a requirement for backpropagating action potentials. Furthermore, dendritic release also was distinguishable from somatic release by its differential sensitivity to NMDA, nimodipine, and feedback inhibition induced by the antidepressant fluoxetine. Thus, DR dendrites release serotonin, and this function is physiologically and pharmacologically unique.
The discovery of this unique release was possible because 3P serotonin microscopy provides advantages over other techniques that are used to measure transmitter release. First, the independence of dendritic serotonin release from backpropagating APs precludes detection with standard patch-clamp experiments that rely on triggering APs from the soma. In contrast, 3P microscopy was able to resolve dendritic serotonin release responses to field stimulation, glutamate puffs, and ionotropic glutamate receptor activators. Second, the proximity of some dendritic VMAT2 vesicle clusters to serotonergic somata and terminals confounds identification of the site of origin for serotonin detected with electrochemical or dialysis probes. Furthermore, resolving quantal release at dendrites with a blindly positioned probe is not feasible because of the sparseness of VMAT2 vesicle clusters. Thus, probe-based methods, despite their great sensitivity, have not been well suited for detecting dendritic serotonin release. Given that dendritic release sites can now be localized in living brain tissue with 3P microscopy, future studies could combine probe and optics-based methods. Therefore, 3P microscopy will continue to be an advantageous tool for studying dendritic serotonin release.
Action potentials and Ca2+ channels in somatodendritic serotonin release
Our experiments showed that NMDA receptors preferentially induce serotonin release from dendrites, while AMPA receptors could evoke release from throughout the somatodendritic compartment. In both cases, dendritic release required L-type Ca2+ channels. However, AMPA-evoked release in the soma, where L-type channels are not abundant (Penington et al., 1991), was mediated by other channels activated by APs. We propose that NMDA was not as efficient at inducing somatic spiking as AMPA in these experiments, but was effective at inducing local depolarization to activate dendritic L-type channels. This could occur as a result of differential distribution of the receptors, differences in membrane potential in the soma and dendrites, which would affect Mg2+ block of NMDA receptors, or compartment-specific coupling of NMDA receptors to Ca2+-activated K+ channels (Isaacson and Murphy, 2001).
These results also raise the question of why APs were not effective at inducing activation of L-type Ca2+ channel-dependent serotonin release in dendrites. Recent observations suggest that this could be explained by ineffective AP backpropagation. Specifically, dynamic-clamp experiments (Tucker et al., 2012) suggest that previous experimental results (Milescu et al., 2010) could be explained by an absence of sodium channels in serotonin neurons dendrites. Under such circumstances, APs, which are brief, would be expected to decrement with distance (Tucker et al., 2012) and so would not be as effective in activating L-type channels as glutamatergic synapses, which produce longer-lasting depolarizing potentials in dendrites. Consistent with this scenario, somatic spiking induces Ca2+ responses that decrement with distance in DR serotonin neuron dendrites (de Kock et al., 2006). Thus, APs might fail to backpropagate in dendrites, ensuring that serotonin release by DR dendrites is not directly coupled to release by the soma and terminals.
Physiological implications of dendritic serotonin release
The unique control of serotonin release from dendrites allows for spatial segregation of serotonin signaling. Specifically, because backpropagating APs are ineffective at stimulating dendritic release, baseline tonic and bursting activity (Rouchet et al., 2008), as well as increased APs induced by neuropeptides and norepinephrine, could evoke serotonin release from the soma and terminals, without concomitant release of serotonin from dendrites. Furthermore, subthreshold synaptic glutamatergic transmission could evoke serotonin release from a dendritic site without affecting the soma or even other dendritic regions. Local release by a dendritic site could therefore regulate local inputs that possess serotonin receptors, including topographically organized afferents and interneurons (Zifa and Fillion, 1992), as well as neighboring serotonin neurons through dendrodendritic activation of autoreceptors. However, with strong glutamatergic input, release from the stimulated dendrite, soma and terminals would be coordinated because robust dendritic depolarization would evoke APs in the soma and axon terminals. Thus, stimulus location, mechanism, and strength likely determine the extent of coordinated release from DR serotonin neuron compartments. The compartment-specific control mechanisms governing release of serotonin, therefore, increases the computational capacity of serotonin signaling.
Pharmacological implications of dendritic serotonin release
Dendritic release showed reduced sensitivity to autoreceptor-mediated inhibition induced by the SSRI fluoxetine, but not by an autoreceptor agonist. This finding suggests that subsaturating antidepressant doses may have a more limited effect on dendritic serotonin release evoked by local synaptic input than on AP-dependent release from the soma and terminals (i.e., when AP activity is inhibited by SSRIs, dendrites may continue to release serotonin). Indeed, this scenario may explain why acute fluoxetine administration markedly increases extracellular serotonin in the raphe nuclei, which involves both somatic and dendritic release, but not in terminal regions, where release is specifically coupled to firing rate (Malagié et al., 1995). Dendritic serotonin release could therefore contribute to the somatodendritic autoreceptor activation that delays SSRI effectiveness in the clinic. Together, these observations raise the possibility that the time lag in the therapeutic action of SSRI antidepressants (Blier et al., 1998; Piñeyro and Blier, 1999; Adell et al., 2002) may be reduced by selective inhibition of dendritic release.
Dendritic serotonin release may also be relevant to non-SSRI antidepressant drugs. In the intact brain, there is evidence of ongoing 5-HT1A autoreceptor activation in the DR, which reduces serotonin neuron activity (Fornal et al., 1996; Mundey et al., 1996; Commons, 2008). A contribution of dendritic serotonin release to autoreceptor activation would imply that specifically diminishing dendritic serotonin release would increase serotonergic tone in terminal regions and thus produce antidepressant effects. Based on the characterization of dendritic serotonin release presented here, NMDA receptors and L-type Ca2+ channels are pharmacological targets for selective inhibition of dendritic serotonin release. Thus, our results suggest that inhibitors of NMDA receptors and L-type Ca2+ channels, by reducing dendritic serotonin release, might have antidepressant effects. In this light, it is striking that the NMDA receptor antagonist ketamine and the L-type Ca2+ channel inhibitor nimodipine have antidepressant effects in humans (Machado-Vieira et al., 2009; Casamassima et al., 2010) and that Cav1.3 L-type channels modulate depression-like behavior (Busquet et al., 2010). Therefore, it would be interesting to conduct in vivo studies to determine whether there is a link between dendritic serotonin release and the clinical efficacy of non-SSRI antidepressants.
Footnotes
This work was supported by National Institutes of Health Grants R21 DA25739 and R01 NS32385 (E.S.L.) and DA21801 (K.G.C.). We thank Drs. Chet DeGroat, Dinara Shaikiryanova, Kristal Tucker, and Rebecca Seal (University of Pittsburgh, Pittsburgh, PA) for their comments.
The authors declare no competing financial interests.
- Correspondence should be addressed to Edwin S. Levitan at the above address. elevitan{at}pitt.edu


