

Abstract
The main olfactory bulb (MOB) in mammals receives massive centrifugal input from cholinergic neurons in the horizontal limb of the diagonal band of Broca (HDB) in the basal forebrain, the activity of which is thought to be correlated with animal behaving states, such as attention. Cholinergic signals in the bulb facilitate olfactory discrimination and learning, but it has remained controversial how the activity of HDB cholinergic neurons modulates neuronal excitability and olfactory responses in the MOB. In this study, we used an optogenetic approach to selectively activate HDB cholinergic neurons and recorded the effect of this activation on the spontaneous firing activity and odor-evoked responses of mouse MOB neurons. Cells were juxtacellularly labeled and their specific types were morphologically determined. We find that light stimulation of HDB cholinergic neurons inhibits the spontaneous firing activity of all major cell types, including mitral/tufted (M/T) cells, periglomerular (PG) cells, and GABAergic granule cells. Inhibitions are significantly produced by stimulation at 10 Hz and further enhanced at higher frequencies. In addition, cholinergic activation sharpens the olfactory tuning curves of a majority of M/T cells but broadly potentiates odor-evoked responses of PG cells and granule cells. These results demonstrate strong effects of the basal forebrain cholinergic system on modulating neuronal excitability in the MOB and support the hypothesis that cholinergic activity increases olfactory discrimination capability.
Introduction
Cholinergic neurons in the basal forebrain regulate attention as well as learning and memory by releasing acetylcholine to modulate the neuronal processing in a wide range of forebrain areas (Wenk, 1997; Hasselmo, 1999; Yu and Dayan, 2005). Stimulation of basal forebrain cholinergic neurons modifies neuronal representations of visual, somatosensory, or auditory signals (Tremblay et al., 1990; Kilgard and Merzenich, 1998; Goard and Dan, 2009). In the olfactory system, pharmacological disruptions of cholinergic signals impair performance in olfactory behavioral tasks, whereas treatments that augment acetylcholine levels improve odorant discrimination (Roman et al., 1993; Ravel et al., 1994; Doty et al., 1999; De Rosa et al., 2001; Linster et al., 2001).
The mammalian main olfactory bulb (MOB) processes sensory information from the olfactory epithelium and conveys its output signals to higher brain structures via mitral/tufted (M/T) cells (Firestein, 2001; Shepherd, 2004). The MOB receives strong centrifugal inputs from the horizontal limb of the diagonal band of Broca (HDB), in which many cholinergic neurons are located (Macrides et al., 1981; Brashear et al., 1986; Salcedo et al., 2011). Although it is commonly believed that acetylcholine modulates signal processing in the MOB (Fletcher and Chen, 2010), its exact effects appear to be complex and different studies report seemingly opposite findings. For example, it has been reported that electrical stimulation of HDB excites GABAergic granule cells and thus indirectly inhibits M/T cells (Nickell and Shipley, 1988b). However, several other studies find that acetylcholine inhibits granule cells and increases the activity of M/T cells by disinhibition (Elaagouby et al., 1991; Kunze et al., 1991; Castillo et al., 1999). Acetylcholine is thought to enhance odorant discrimination of mitral cells (Linster and Cleland, 2002; Chaudhury et al., 2009), but its effects on interneurons have not been directly examined. In addition, previous experiments often use the methods of pharmacological perturbations. It remains untested how signal processing in the olfactory system is modulated by rapid and selective activation of HDB cholinergic neurons.
In this study, we used an optogenetic method to selectively stimulate HDB cholinergic neurons and performed in vivo physiological recordings to examine the stimulation effects on the spontaneous activity and olfactory responses of MOB neurons. Cells were juxtacellularly labeled after recordings. This approach offers several advantages. Because the MOB receives centrifugal input from both cholinergic neurons and GABAergic neurons in the HDB, optogenetic stimulation allows selective activation of cholinergic neurons. Moreover, it stimulates the release of acetylcholine in vivo with high temporal precision. Morphological labeling also enables more accurate identification of cell types.
We find that optical activation of HDB cholinergic neurons inhibits the spontaneous firing activity of a vast majority of bulbar neurons, including M/T cells and interneurons. In addition, we show that cholinergic activity sharpens the olfactory tuning curves of a majority of M/T cells but nonselectively increases the responsiveness of interneurons. These results directly demonstrate that the centrifugal cholinergic input can substantially modulate neuronal excitability and enhance the discrimination capability of bulbar projection neurons.
Materials and Methods
Animals and surgery.
All experiments were performed on adult ChAT–ChR2–EYFP transgenic mice (8–16 weeks old, 16–30 g) of either sex. This transgenic line was generated using a bacterial artificial chromosome (BAC) transgene strategy and has been characterized in detail recently (Ren et al., 2011; Zhao et al., 2011). Animal care and use were performed following the institutional policy of the National Institute of Biological Sciences (Beijing, China).
In vivo electrophysiology.
For recordings from anesthetized mice, animals were intraperitoneally injected with urethane (1.64 g/kg, 20%). Mice were mounted in a stereotaxic apparatus and kept warm (37°C) with an electric heating pad. The skull above the olfactory bulb was thinned, and a small hole was then opened. Borosilicate microelectrodes (10–30 MΩ resistance) were pulled on a horizontal puller (P-2000; Sutter Instruments), filled with 4% Neurobiotin (Vector Laboratories) dissolved in 1 m NaCl, and lowered to search for extracellular units. Recordings were performed with an AxonClamp 2B amplifier (Molecular Devices). After the isolation of a single unit, electrophysiological signals were further amplified and bandpass filtered at 0.5–3 kHz (Brownlee 440 Amplifier). Signals were digitized at 15 kHz with an E-series DAQ card (National Instruments). Data acquisition and experimental control were performed by custom-written program implemented in Visual Basic.
Odorant delivery.
The odor stimuli consists of 16 monomolecular chemicals, including butyric acid, ethanol, ethyl butyrate, N-amyl-acetate, ethyl acetate, benzyl acetate, heptanal, valeraldehyde, octanal, benzaldehyde, acetophenone, 2-heptanone, butanone, benzene, iso-propyl ether, and 2, 3-dimethylpyrazine (all from Sigma). Odorants were stored in headspace vials and delivered in a sequential order by a custom-made robotic olfactometer based on a programmable dispensing robot (Tan et al., 2010). Odorants were diluted to 1% of saturated vapor in the airflow and presented to the front of mouse nostrils at a constant flow rate of 4 L/min. To ensure the timing accuracy of odorant delivery, odorants were delivered by switching on a three-way solenoid valve (WTB-3R-M6F; Takasago Electric). Neurons were tested with up to 16 odorants, each of which was delivered for five consecutive trials. The duration of odor application for each trial was 2 s with a 23 s intertrial interval to reduce habituation (Wilson, 1998; Zhan and Luo, 2010). An additional stream (100 ml/min) of pure air was injected into the airflow circuit for 3 s after the termination of a trial to minimize residual odorants from the previous trial. Teflon tubing was used to reduce cross-contamination.
Electrophysiological recordings from brain slices.
ChAT–ChR2–EYFP mice were anesthetized with pentobarbital (100 mg/kg, i.p.) and transcardially perfused with cold oxygenated artificial CSF (aCSF) at a rate of ∼2 ml/min. The modified aCSF for perfusion contained the following (in mm): 225 sucrose, 119 NaCl, 2.5 KCl, 1 NaH2PO4, 4.9 MgCl2, 0.1 CaCl2, 26.2 NaHCO3, 1.25 glucose, 3 kynurenic acid, and 1 Na-ascorbate (all chemicals were from Sigma). Mice were then rapidly decapitated, and brains were cut with a vibratome (VT1200; Leica). Slices were incubated for at least 1 h at 34°C within oxygenated aCSF containing the following (in mm): 125 NaCl, 2.5 KCl, 2 CaCl2, 1.3 MgCl2, 1.3 NaH2PO4, 1.3 Na-ascorbate, 0.6 Na-pyruvate, 20 glucose, and 25 NaHCO3. During recording, slices were submerged and superfused (2 ml/min) with aCSF at room temperature (22–25°C). Recording pipettes (4–7 MΩ) were filled with internal solution containing the following (in mm): 130 K-gluconate, 10 HEPES, 0.6 EGTA, 5 KCl, 3 Na2ATP, 0.3 Na3GTP, 4 MgCl2, and 10 Na2phosphocreatine, pH 7.2–7.4. Voltage-clamp and current-clamp recordings were performed with a computer-controlled amplifier (MultiClamp 700B; Molecular Devices). For voltage-clamp recordings, neurons were held at −60 mV. Traces were low-pass filtered at 1.2 kHz (voltage clamp) or 2.6 kHz (current clamp) and digitized at 10 kHz (DigiData 1440; Molecular Devices). Data were acquired and analyzed using the Clampfit 10.0 software (Molecular Devices).
Laser light stimulation.
For light stimulation in vivo, a hole was opened in the skull above the HDB that was ipsilateral to the recording site (0.3 mm anterior to bregma and 2.0 mm lateral to the midline). An optical fiber (200 μm core diameter, numerical aperture 0.22) was lowered for 4.3 mm with a lateral to medial 7.5° angle to target the HDB. The optical fiber was coupled to a diode-pumped solid-state 473 nm laser and controlled by a VD-IIA DPSS laser driver. Light pulses (15 ms per pulse at 5–50 Hz) were controlled with digital commands from a Master-8 stimulator (A.M.P.I.). For examining the effects of HDB stimulation on spontaneous firing activity, we applied 30 s trains of light pulses at the frequencies of 5–50 Hz. To test the effect of light stimulation on olfactory responses, the start of laser stimulation was synchronized to trial initiation. Because the entire session for odorant applications lasted for ∼60 min, we gave 8 s trains of light pulses with 23 s intervals to prevent potential depletion of synaptic acetylcholine. To stimulate HDB neurons in brain slices, blue light pulses were generated with the same laser. An optical fiber was submerged in aCSF and placed ∼300 μm above the recording site. Delivery of light pulses was controlled by digital commands from a Digidata 1440 digitizer.
Analysis of in vivo physiological data.
The sorting of extracellular spikes were performed with the Spike2 software (Cambridge Electronic Design). Data were further processed with custom-written programs in MATLAB (MathWorks). Peristimulus time histograms (PSTHs) were computed by counting the number of spikes within sequential time bins (200 ms) and then averaged over five trials for each odorant.
To calculate the effect of light stimulation of HDB cholinergic neurons on the spontaneous firing activity of bulbar neurons, we measured the mean firing rates of 30 s duration immediately before and during light stimulation, respectively. The response strength of a neuron to an odorant was quantified by subtracting the mean spontaneous rate (3 s preceding odorant initiation) from the mean firing rate during the odorant application within each trial and then averaging across trials. Positive values of response strength indicate excitation and negative ones inhibition.
To plot the olfactory tuning curves, the values of response strength of each individual neuron before light stimulation were arranged against all odorants along the horizontal axis so that the strongest excitatory response was placed in the middle of the curve, and the weak or inhibitory ones were at both ends in descending orders. The response strengths during laser stimulation were plotted with the same order of odorant arrangement as those before light stimulation. The mean effect of light stimulation on the olfactory response of a neuron is defined as variance: V = ∑ |ri − ril|/N, where N is the total number of tested odor stimuli, ri is the response strength to odorant i before light stimulation, and ril stands for the value of response strength to odorant i during light stimulation. Thus, the value of V represents the mean absolute change in the response strength of the cell to an odorant, with the value of zero indicating no effect.
Retrograde tracing.
Mice were anesthetized (0.05 mg/kg atropine and 80 mg/kg pentobarbital, i.p.) and then mounted in a stereotaxic apparatus. A hole was opened in the skull above the olfactory bulb. A glass pipette was loaded with 10% Texas Red dextran amines (molecular weight of 3 kDa; Invitrogen) and pressure injected into the MOB using a microprocessor-controlled nanoliter injector (Nanoliter 2000; WPI). The pipette tip was initially started in the dorsal bulb and then sequentially lowered for additional injections. A total of 1 μl of tracers was injected within one bulb.
Histology.
After the completion of a recording session, neurons were labeled using a juxtacellular labeling technique as described previously (Pinault, 1996). Briefly, Neurobiotin in a recording pipette was electrophoresed into neurons with small positive currents (<10 nA; 0.2 s on/0.2 s off). The amplitudes of the injected currents were adjusted so that the evoked firing of action potentials was tightly synchronized with current injection. One hour after the labeling process, mice were killed with an overdose of pentobarbital and perfused by cold saline and then 4% paraformaldehyde in PBS. The brains were postfixed in 4% paraformaldehyde overnight at 4°C and cryoprotected with 30% sucrose. Coronal sections (50 or 60 μm thick) were cut with a freezing cryostat (Leica CR1900) and then reacted with Cy3-conjugated streptavidin (1:500; 2 h; Jackson ImmunoResearch) in 0.1 m PBS with 0.3% Triton X-100. The specific cell types of recorded bulbar neurons were determined by their soma location and dendritic morphology.
For mice with retrograde tracer injection, animals were killed with an overdose of pentobarbital after 5–7 d of survival, and their brains underwent histological processes. To confirm the cholinergic identity of ChAT–ChR2–EYFP-expressing (ChAT–ChR2–EYFP+) neurons, brains were sectioned coronally at 40 μm thickness with a freezing microtome. Sections were rinsed with 0.3% Triton X-100 in 0.1 m PBS, blocked with 4% normal bovine serum for 2 h, and then incubated with the rabbit anti-vesicular acetylcholine transporter (VAChT) antibody (1:500; Synaptic Systems) in the blocking solutions for overnight at 4°C. The sections were visualized with Cy3-conjugated goat anti-rabbit antibody (1:500; 2 h at room temperature; Jackson ImmunoResearch). Fluorescently labeled cells were detected on a confocal microscope (Carl Zeiss LSM 510 Meta) using a 20× or 40× objective. Images were reconstructed using Adobe Photoshop (Adobe Systems).
Results
Light stimulation of HDB cholinergic neurons
Throughout the study, we used the adult ChAT–ChR2–EYFP BAC transgenic mouse line. In these mice, the expression of the light-sensitive ChR2–EYFP fusion protein is driven by the promotor for choline acetyltransferase (ChAT), the enzyme critical for acetylcholine synthesis (Boyden et al., 2005; Ren et al., 2011; Zhao et al., 2011). We verified the accuracy of ChR2–EYFP expression in HDB cholinergic neurons by immunostaining against VAChT, a marker of cholinergic neurons (Fig. 1A). After the injection of fluorescent tracer Texas Red dextran amines into the MOB, many neurons were retrogradely labeled in the HDB in which cholinergic neurons are located (Fig. 1B). Some of the labeled neurons were ChR2–EYFP+, confirming that the MOB receives centrifugal input from cholinergic neurons in the HDB of ChAT–ChR2–EYFP mice. Consistent with previous findings that the MOB is additionally innervated by GABAergic neurons in the HDB (Brashear et al., 1986; Záborszky et al., 1986), ChR2–EFYP expression was not detected from a substantial number of retrogradely labeled neurons (Fig. 1B).

Optogenetic activation of HDB cholinergic neurons. A, Immunostaining against VAChT (red) verifies the cholinergic nature of ChAT–ChR2–EYFP+ neurons (green) in the HDB of ChAT–ChR2–EYFP mice. Arrows point to VAChT-immunopositive and EYFP+ neurons. Because of the membrane localization of ChR2 protein, EYFP signals tend to be weak in somata. B, Retrograde tracing confirms that the MOB receives input from HDB neurons, some of which are cholinergic. The fluorescent tracer Texas Red dextran amines were placed in the MOB to retrogradely label neurons in the HDB (red). Many tracer-labeled cells were EYFP+ (arrows). However, some of the labeled neurons lacked ChR2–EYFP expression, consistent with previous findings that the MOB is innervated by both cholinergic and non-cholinergic neurons in the HDB. C, Recordings from brain slices demonstrate that ChR2–EYFP+ neurons in the HDB can be activated by blue light stimulation with high temporal precision. The top panel shows that a brief pulse of blue light (5 ms; blue bar) elicited the firing of an action potential when the cell was recorded in the current-clamp mode (top trace) and an inward photocurrent in the voltage-clamp mode (bottom trace). The bottom panel shows that continuous light stimulation (500 ms; 20 mW/mm2; blue bar) resulted in depolarization and action potential firing in current-clamp mode (top trace) and a sustained photocurrent in voltage-clamp mode (bottom trace). D, Brief light pulses evoked reliable firing of action potentials at up to 50 Hz. E, Extracellular recordings from cells in the HDB of anesthetized mice illustrate that trains of light pulses (blue bars; 20 mW output from tip; 15 ms pulses; 50 Hz) produce vigorous firing of action potentials that tightly couples to the light stimulation. The left trace shows the recording from a representative HDB neuron, and the right trace displays a zoom-in view of the effect of 10 s light stimulation on neuronal firing.
We performed whole-cell recordings from acute brain slices to test whether light stimulation could activate cholinergic neurons in the HDB. For all six cells examined, brief blue light pulses (5 ms) rapidly elicited firing of action potentials and the induction of inward currents (Fig. 1C). Steady blue light pulses (500 ms, 473 nm, 20 mW/mm2) similarly produced action potential firing in the current-clamp mode and a sustained inward current in the voltage-clamp mode (Fig. 1C). In the current-clamp mode, trains of brief light flashes at different frequencies (5–50 Hz) generated precisely timed, highly reliable firing of action potentials (n = 5 cells; Fig. 1D).
We further tested the dynamics of activating HDB neurons with light stimulation in vivo. In urethane-anesthetized mice, we recorded extracellular single units using a glass recording electrode and placed an optical fiber into the brain with the fiber tip above the HDB. We used the parameter of 10 s illumination (15 ms pulses at 50 Hz) with 20 s intervals to examine whether light stimulation increased the firing frequency of HDB neurons. In five neurons, we observed immediate increases of spike firing activity after the start of light stimulation and almost instant termination of this activation at the end of light illumination (Fig. 1E). Thus, the use of ChAT–ChR2–EYFP transgenic mice allows us to selectively and precisely activate HDB cholinergic neurons in vivo.
Stimulating HDB cholinergic neurons inhibits M/T cells and sharpens their olfactory responses
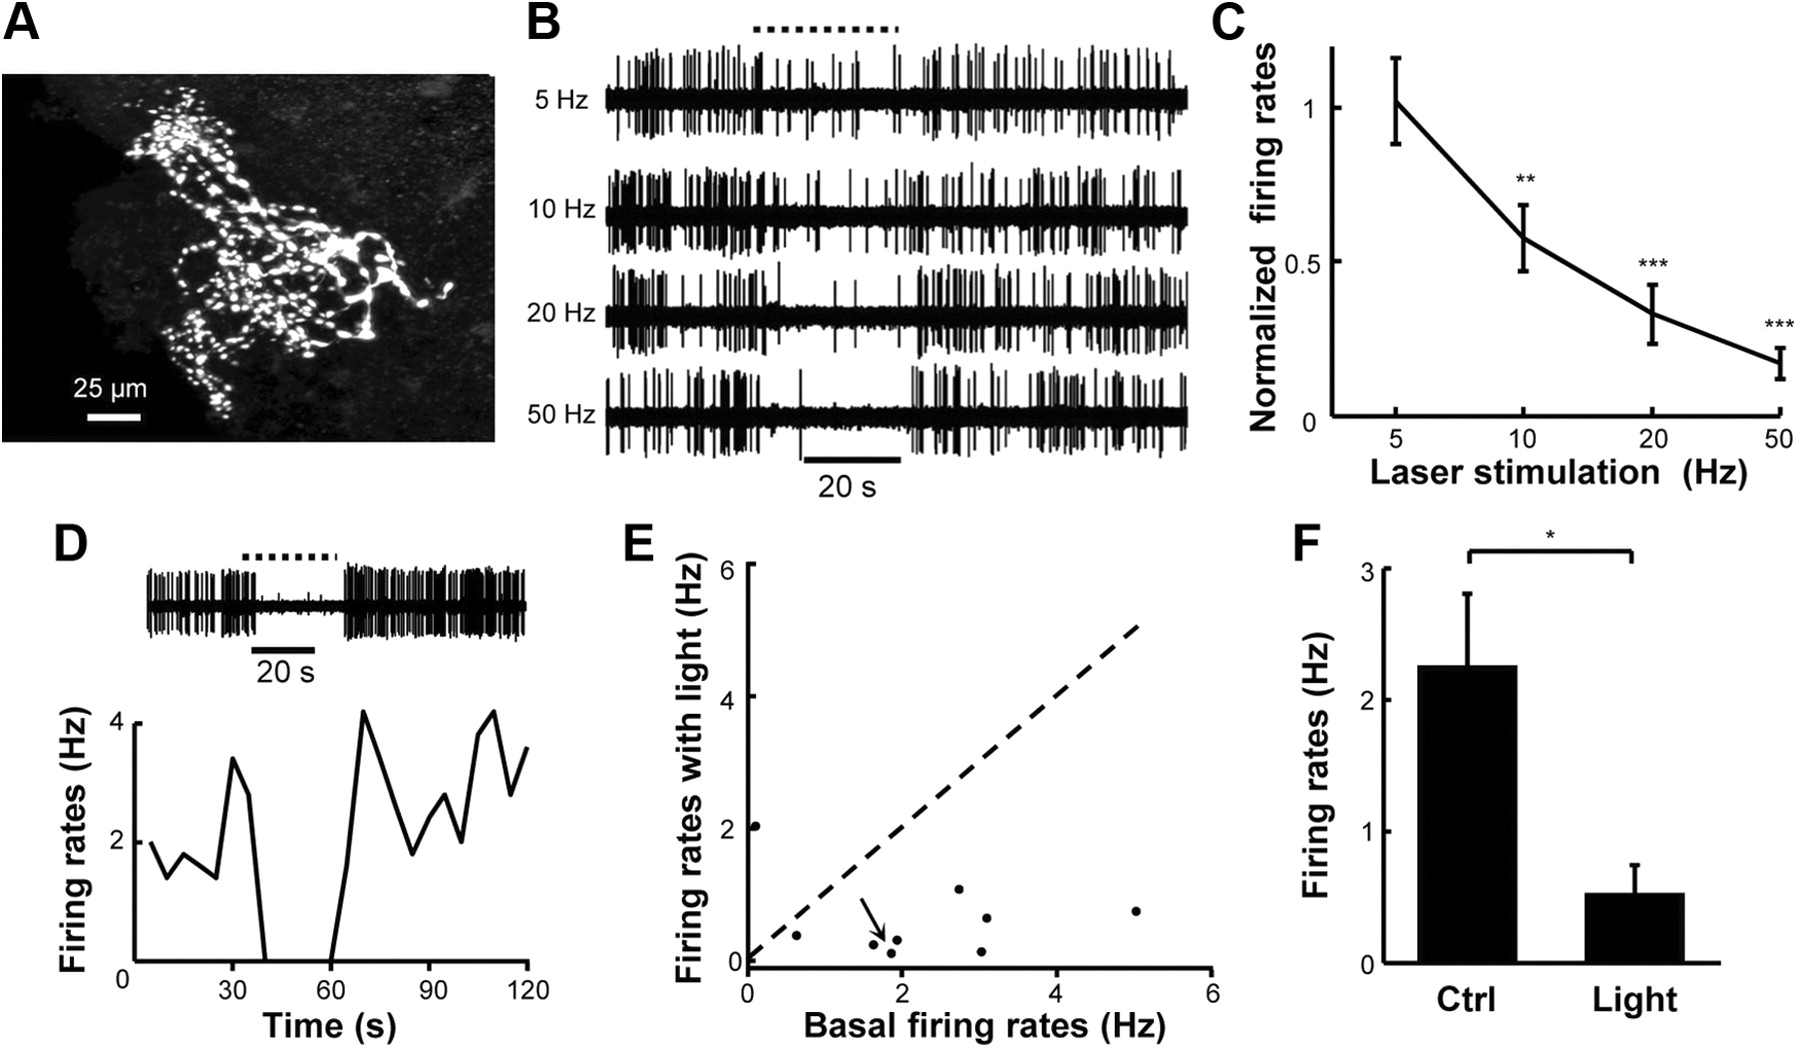
To study how the activity of cholinergic neurons affects signal processing in the MOB, we extracellularly recorded the firing activity of bulbar neurons and selectively activated HDB cholinergic neurons by passing light through an optical fiber (Fig. 2A). M/T cells are the principal neurons that receive excitatory input from olfactory sensory neurons and project to extrabulbar brain regions (Hasselmo, 1999; Shepherd, 2004). A total of 25 M/T cells (18 mitral cells and 7 tufted cells) were extracellularly recorded and then juxtacellularly labeled from anesthetized mice. Their cell types were defined by the following morphological criteria: (1) the location of their somata in the mitral cell layer for mitral cells or the external plexiform layer for tufted cells; (2) the extension of a single apical dendrite into a glomerulus; (3) the presence of lateral dendrites in the external plexiform layer; and (4) the emanation of axonal terminals in the internal plexiform layer and the granule cell layer. The morphology of a representative mitral cell is illustrated in Figure 2B.

Activating HDB cholinergic neurons inhibits the spontaneous activity of M/T cells. A, A simplified schematic drawing shows the method of light stimulation of HDB cholinergic neurons and recordings from MOB neurons. An optical fiber was lowered with its tip above the HDB of ChAT–ChR2–EYFP mice. A glass pipette filled with Neurobiotin is used to record and fill neurons in the MOB. B, The morphology of a representative mitral cell, which was juxtacellularly labeled with Neurobiotin and visualized with Cy3–streptavidin. C, Physiological traces show that stimulating HDB cholinergic neurons resulted in suppression of spontaneous firing of a mitral cell in a frequency-dependent manner. The dashed line above the traces indicate light stimulation at the frequencies of 5, 10, 20, and 50 Hz (pulse duration of 15 ms). D, Population data on the effect of stimulating HDB at different frequencies on the spontaneous firing rates of M/T cells (n = 25 cells). Data are normalized to the mean spontaneous firing frequency within 30 s before light stimulation. In this and subsequent figures, error bars indicate SEM. E–G, Light stimulation at 50 Hz profoundly suppress the firing activity of M/T cells. E, Raw physiological trace (top) and the plot of mean firing rate (5 s per point) show that the cell shown in B is drastically inhibited after the optical activation (horizontal bar, 30 s) of HDB cholinergic neurons. F, Scatter plot of the mean firing rates before (horizontal axis) and during 30 s, 50 Hz light stimulation (vertical axis) of HDB cholinergic neurons. Each dot represents an individual M/T cell. Dashed line indicates no change of firing rates in spontaneous activity after light stimulation. Arrow points to the cell shown in B. All 25 M/T cells exhibit a reduction of spontaneous firing in response to 50 Hz light stimulation. G, Bar graph shows that 50 Hz light stimulation produces a 84% reduction in spontaneous firing rates. ***p < 0.001, paired t test; n = 25 M/T cells. Ctrl, Control.
We first examined how the spontaneous firing activity of M/T cells is influenced by activating HDB cholinergic neurons. After recording the basal spontaneous firing rates for at least 120 s, we stimulated cholinergic neurons by delivering a 30 s train of light pulses (15 ms per pulse) at the frequencies of 5, 10, 20, and 50 Hz (Fig. 2C). Stimulation of HDB cholinergic neurons at 5 Hz often did not produce obvious change in firing activity. Increasing the stimulation frequency to 10 Hz resulted in an >50% reduction in firing activity (Fig. 2C,D). Stimulation at higher frequencies immediately resulted in almost complete silence and then a rapid rebound of firing activity after the termination of light illumination. This inhibitory effect is especially reliable when the light stimulation was given at 50 Hz (Fig. 2E). By plotting the firing rates of individual neurons during stimulation against those before stimulation (Fig. 2F), we observed strong inhibitions from all M/T cells tested (n = 25 cells). The bar plot in Figure 2G shows that the average firing activity was reduced by ∼84% after 50 Hz light stimulation. These results thus suggest powerful inhibition of spontaneous firing activity of M/T cells by activating HDB cholinergic neurons.
We then analyzed whether odor-evoked responses of M/T cells could be changed by stimulating HDB cholinergic neurons. Individual M/T cells were tested with 16 structurally dissimilar monomolecular odorants belonging to the functional groups of alcohol, acetate, aldehyde, ketone, ether, benzene, and pyrazine. Odorant pulses (2 s, 1% saturated vapor) were delivered by a robotic olfactometer (Tan et al., 2010). Odorants were consecutively tested for five trials, each of which lasted 8 s and included 3 s baseline before odor delivery. An interval of 23 s was inserted between trials to minimize response habituation. After establishing the response profiles of each cell to the 16 odorants, blue light pulses at 10 or 50 Hz were applied to stimulate HDB cholinergic neurons throughout the trials, and the odor-evoked responses were reexamined.
A total of 400 odor-cell pairs were tested for the 25 M/T cells. By plotting the response strengths of these odor–cell pairs before and during light stimulation of HDB cholinergic neurons, we observed that HDB stimulation produced clear potentiation or suppression of response strengths for many odor–cell pairs (Fig. 3A). Stimulation at 50 Hz generated a more obvious effect and produced a small but significant increase in the mean response strength (Fig. 3B). Because the changes were bidirectional, we quantified the light stimulation effects by summing the absolute differences in the response strengths of individual odorants and then dividing the sum by the number of test odorants. Thus, the value of mean variance represents the mean absolute difference in response strength to an odorant. At the stimulation frequency of 50 Hz, the mean variance was 1.7 ± 0.2 (mean ± SEM), which indicates difference as large as the mean spontaneous firing rates of the recorded M/T cells (Figs. 2G, 3D). The variance value was significantly lower when the light stimulations were delivered at 10 Hz (1.2 ± 0.1; Fig. 3C,D), suggesting that the effect depends on stimulation intensity.

The response tuning of M/T cells is sharpened by the activity of HDB cholinergic neurons. A, Scatter plot of response strengths during light stimulations at 10 Hz (left) and 50 Hz (right) against the same during control conditions. Dots represent individual odor–M/T cell pairs. Dashed line indicates no change in response strength following light stimulation. B, Bar plot of the mean response strength of M/T cells before and during light stimulation. n.s., Statistically not significant. ***p < 0.001, paired t test; n = 400 odor–cell pairs. Ctrl, Control. C, The distribution of the variance indexes of 25 M/T cells. Each dot represents an individual M/T cell to light stimulation at 50 Hz (blue) or 10 Hz (red). Cells were aligned by values of variance indexes at 50 Hz. The variance index of an individual cell was calculated by averaging the absolute difference of odor-evoked responses before and during light stimulation. D, Mean variance index for 10 and 50 Hz stimulations. **p < 0.01, paired t test; n = 25 cells. E, Olfactory tuning curves of four M/T cell before and during laser stimulation at 10 or 50 Hz. Numbers represent changes of firing rates (spike/s; ΔHz) induced by odorant application, with positive ones indicating excitation and negative ones inhibition. F, Sample raw traces (top panels) and PSTHs (bottom panels) show diverse effects of activating HDB cholinergic neurons on odorant-evoked responses of the cell. Italic letters a and b correspond to the data values indicated by arrows in E1. Light stimulation of cholinergic neurons enhanced the excitatory response to the optimal odorant (a) but reduced the response to a non-optimal odorant (b). Black horizontal bars indicate 2 s odorant application and blue bars indicate light stimulation.
More interestingly, stimulating cholinergic neurons substantially reformatted the individual olfactory tuning properties of a majority of M/T cells (19 of 25 cells tested). Among the 19 responsive cells, 14 of them exhibited consistent pattern changes that suggest sharpening of olfactory tuning by the activation of HDB cholinergic neurons. At the basal line, eight cells responded with clear excitation to a selective subset of odorants and thus showed bell-shaped tuning curves to the panel of 16 test odorants. Figure 3E illustrate the tuning curves of four M/T cells before and during light stimulation at 10 and 50 Hz. HDB cholinergic stimulations often enhanced the excitatory responses to the subset of most effective odorants. In addition, the stimulations usually suppressed the weak excitatory responses or increased the amplitudes of inhibitory responses. The specific odor response patterns of the mitral cell shown in Figure 3E1 are further illustrated in Figure 3F. Before light stimulation, iso-propyl ether was the most effective odor, and N-amyl acetate was ∼40% less effective (Fig. 3F). After light stimulation, the response to iso-propyl ether was further increased, whereas those to other odorants were mostly reduced, resulting in an almost 10-fold difference for iso-propyl ether and N-amyl acetate during 50 Hz light stimulation (Fig. 3E1,F).
We quantified the effects on response contrast by measuring the changes in evoked firing rates of optimal odorants and those of the non-optimal odorants. Light stimulation at 10 and 50 Hz increased the optimal responses from the basal level of 5.3 ± 1.1 to 5.8 ± 1.5 and 7.8 ± 1.3 spikes/s, respectively (p < 0.05 between control and 50 Hz stimulation, paired t test; n = 8 M/T cells). In contrast, the non-optimal responses were reduced from 1.0 ± 0.2 to 0.6 ± 0.3 and 0.6 ± 0.3, respectively. Thus, the overall contrast between optimal and non-optimal responses was increased from ∼5-fold to 10- and 13-fold for the stimulations of 10 and 50 Hz. For another six M/T cells, our test odorants evoked only weak excitatory or inhibitory responses. Light stimulation often suppressed the weak excitatory responses and increased the amplitudes of inhibitory ones (Fig. 4A,B). The overall response strength to these non-optimal odorants was significantly reduced by HDB stimulation (from 1.1 ± 0.3 to 0.7 ± 0.3 and 0.4 ± 0.3 spikes/s, respectively; p < 0.001 for both paired t tests; n = 96 odor–cell pairs).

HDB cholinergic activation could enhance inhibitory responses or produce odor-specific modulations for a subset of M/T cells. A, B, The olfactory tuning curves (A) and representative traces (B) of a mitral cell show increased inhibition after stimulation of HDB cholinergic neurons at 10 or 50 Hz. Ctrl, Control. C, D, The tuning curves and traces of a broadly responsive mitral cell. Light stimulation at 10 Hz did not produce strong effects on tuning, but stimulation at 50 Hz resulted in enhanced excitation of several odorants. Same conventions as Figure 3, E and F.
The results from the 14 M/T cells thus suggest that HDB cholinergic activity sharpens olfactory response tuning of M/T cells by enhancing responses to optimal odorants and suppressing those to non-optimal odorants. Conversely, we observed inconsistent effects from the remaining five M/T cells. One example is illustrated in Figure 4, C and D. This cell was broadly activated by all 16 odorants. Stimulation of HDB cholinergic neurons at 10 Hz did not strongly change the tuning property of this mitral cell. Stimulation at 50 Hz enhanced its responsiveness to several odorants, although the response to its previously most effective odorant was not changed. The heterogeneity might reflect the complexity of cholinergic effects on signal processing in the MOB.
HDB cholinergic neurons inhibit MOB interneurons and broaden their olfactory responsiveness
M/T cells in the MOB are far outnumbered by interneurons, which mainly consist of periglomerular (PG) cells and granule cells (Shepherd, 2004). The somata of PG cells are located in the periglomerular region in the glomerular layer. PG cells extend their dendrites into nearby glomeruli and send their axons laterally to more distant glomeruli. In the granule cell layer, axonless granule cells extend their peripheral dendrites into the external plexiform layer and form dendrodendritic synapses with M/T cells. Through their lateral connections, PG cells and granule cells are believed to provide inhibitory signals to shape the olfactory responses of M/T cells (Mori et al., 1999; Shepherd, 2004).
We recorded and filled 10 cells that were classified as PG cells because their somata are located in the periglomerular region and their dendrites and axons are restricted within the glomerular layer (Fig. 5A). We examined the effect of activating cholinergic inputs on the spontaneous firing activity of PG cells by giving 30 s trains of light pulses (15 ms pulses at 5–50 Hz) into the HDB of ChAT–ChR2–EYFP mice. Because PG cells are believed to mainly release the neurotransmitter GABA to inhibit M/T cells (Mori et al., 1999; Aungst et al., 2003; Shepherd, 2004), we had expected that light stimulation of HDB cholinergic neurons would excite PG cells to mediate the inhibitory effects on M/T cells. Interestingly, HDB stimulation inhibited a vast majority of spontaneously active PG cells (n = 8 of 9 cells; Fig. 5B–F). This inhibition was statistically significant at the frequency of 10 Hz and became more profound with stimulations at higher frequencies (Fig. 5B,C).
The spontaneous firing activity of PG cells is suppressed by stimulating HDB cholinergic neurons. A, The morphology of a representative PG cell. B, C, Physiological traces (B) and normalized spontaneous firing rates (C) show that HDB stimulation inhibits the firing activity of PG cells in a frequency-dependent manner. The curve in C includes eight PG cells that were inhibited by light stimulation. **p < 0.01, ***p < 0.001, paired t tests between control and light stimulation at respective frequencies. D, Light stimulation of HDB cholinergic neurons at 50 Hz completely silenced spike firing of a PG cell. E, Scatter plot reveals that the spontaneous firing activity of a vast majority of PG cells (8 of 9) was reduced by activating HDB cholinergic neurons. F, Bar graph shows that 50 Hz light stimulation significantly reduces spontaneous activity of PG cells (*p < 0.05, paired t test; n = 9 cells). Ctrl, Control.
In contrast to the inhibitory effect on spontaneous firing activity, light stimulation of HDB cholinergic neurons produced broad increases in excitatory responses of PG cells (Fig. 6). Stimulation at the frequencies of both 10 and 50 Hz resulted in a general upper shift in olfactory responsiveness for a majority of odor–PG cell pairs (Fig. 6A). At the level of population data, the response strengths were increased by 45.8 or 62.7%, respectively (Fig. 6B). This broad increase in odor-evoked responses was observed from a majority of PG neurons tested (n = 6 of 10 cells). A typical example is shown in Figure 6, C and D. This PG cell initially did not respond to any test odorant. However, it was excited by all 16 test odorants during HDB cholinergic stimulation at both 10 and 50 Hz. For the other four PG cells, light stimulations enhanced response strengths to only a subset of odorants during strong stimulation (Fig. 6E,F). These results thus suggest that activation of HDB cholinergic neurons broadly increases the excitatory responses of a majority of PG cells, although the effects can be odor specific for some individual PG cells.

Light stimulation of HDB cholinergic neurons potentiates the olfactory responses of PG cells. A, The odor-evoked responses of PG cells are increased by light stimulation of HDB cholinergic neurons at 10 Hz (1) or 50 Hz (2). B, Bar graph shows a significant increase in the mean response strength of PG cells during light stimulation, and higher frequency stimulation leads to a stronger potentiatory effect on odor responses. ***p < 0.001, paired t test; n = 160 odor–cell pairs. Ctrl, Control. C, D, The tuning curves (C) and physiological traces (D) illustrate that activating HDB cholinergic neurons produces a broad increase in the excitatory responses of a PG cell. E, F, The olfactory tuning curves (E) and representative traces (F) of a PG cell show non-uniformed potentiation by light stimulation. Ctrl, Control.
Granule cells represent the largest population of neuron types in the MOB. We recorded and filled 18 granule cells and confirmed their neuronal type based on the location of their somata in the granule cell layer and the presence of their spiny dendrites in the external plexiform layer (Fig. 7A). Similar to PG cells, a vast majority of granule cells were inhibited by HDB cholinergic stimulations (n = 15 of 16 granule cells that were spontaneously active). For cells that were inhibited, the effect was statistically significant at the stimulation frequency of 10 Hz and became increasingly potent at higher frequencies (Fig. 7B,C). At 50 Hz, light stimulation profoundly suppressed the firing activity and resulted in an overall 77% reduction of firing activity (Fig. 7D–F).

Stimulating HDB cholinergic neurons inhibits the spontaneous firing activity of granule cells. A, The morphology of a granule cell. B, C, Physiological traces (B) and plot of normalized firing rates (C) show the frequency-dependent inhibition of granule cells by the stimulation of HDB cholinergic neurons. The curve in C excludes data from one granule cell that was not inhibited by cholinergic activation. ***p < 0.001, paired t tests between control and light stimulation at different frequencies; n = 15 cells. D, The physiological trace and plot of mean firing rate of a granule cell that exhibited a reduction in spontaneous activity after 50 Hz light stimulation. E, Scatter plot illustrates that the spontaneous firing activity of a vast majority of granule cells (15 of 16) was reduced by HDB stimulation. F, Population data show that 50 Hz light stimulation results in a significant reduction in the mean spontaneous activity of granule cells (**p < 0.01, paired t test; n = 16 cells). Ctrl, Control.
Activating HDB neurons could also produce strong effects on the odor-evoked responses of granule cells. Light stimulation of HDB cholinergic neurons often potentiated olfactory response and produced 80 and 101% increase in the mean response at the level of the entire population of 288 odor–granule cell pairs (Fig. 8A,B). Twelve of the total of 18 granule cells displayed a broad enhancement of responsiveness to essentially all odorant stimuli tested following HDB stimulation. Figure 8, C and D, shows a typical granule cell that doubled the spike firing rates to nearly all test odorants during the light stimulation at both 10 and 50 Hz. Light stimulations potentiated the responses to approximately half of the test odorants for five other granule cells (Fig. 8E,F). The heterogeneity in the number of affected odorants among granule cells suggests that HDB cholinergic activity may enhance responsiveness in an odor-dependent manner for some granule cells.

Activating HDB cholinergic neurons enhances the olfactory responses of granule cells. A, Scatter plots show the potentiatory effects on odor-evoked responses of granule cells by stimulating HDB at 10 Hz (1) or 50 Hz (2). B, Bar plots of olfactory response strength before and during 10 or 50 Hz light stimulation. ***p < 0.001, paired t test; n = 288 odor–cell pairs. Ctrl, Control. C, D, The tuning curves (C) and raster plot (D) illustrate that activating HDB cholinergic neurons broadly increased olfactory responsiveness of a granule cell. The raster plot in D displays the firing activity of a total of 80 trials for 16 odorants. Trials were aligned along the vertical axis, and each action potential is plotted as a black dot along the horizontal axis. E, F, The olfactory tuning curves (E) and representative traces (F) of a granule cell show odorant-specific potentiation of response strength by HDB stimulation.
Discussion
The mammalian olfactory bulb is modulated by centrifugal projections that release acetylcholine, norepinephrine, or serotonin (De Olmos and Heimer, 1980; Macrides et al., 1981; Shipley et al., 1985; Shipley and Ennis, 1996). The basal forebrain cholinergic system has been shown to play important roles in olfaction-mediated behaviors (Fletcher and Wilson, 2002; Wilson et al., 2004; Mandairon et al., 2006; Chaudhury et al., 2009). In this study, we selectively activated HDB cholinergic neurons using an optogenetic approach and investigated its effect on neuronal excitability and olfactory responses in the MOB. Our experiments demonstrate that light stimulation of cholinergic neurons inhibits the spontaneous firing activity of all three major cell types, including M/T cells, PG cells, and granule cells. In addition, cholinergic activation also sharpens the olfactory tunings of a majority of M/T cells and broadly increases the olfactory responsiveness of interneurons. These results reveal several insights on the functions and mechanisms into the cholinergic regulation of signal processing in the MOB.
Olfactory signals are projected from olfactory sensory neurons to the MOB along the lines of odorant receptor identities. Sensory neurons expressing a given receptor converge into one or a few glomeruli in the MOB (Buck and Axel, 1991; Mombaerts et al., 1996). M/T cells possess a single apical dendrite to receive its main excitatory input from a specific glomerulus (Hasselmo, 1999; Shepherd, 2004). PG cells in the glomerular layer provide a venue for lateral connections between glomeruli. M/T cells also extend several basal dendrites to interact laterally by forming dendrodendritic synapses with granule cells. Most PG cells and all granule cells are GABAergic and have been hypothesized to sharpen the tuning of M/T cells via lateral inhibition (Mori et al., 1999; Restrepo et al., 2009; Tan et al., 2010). It has been proposed that centrifugal neuromodulatory inputs mainly target interneurons to adjust neural computation in the bulb (Shipley and Ennis, 1996).
In the rodent MOB, massive fibers originated from HDB neurons primarily terminate in the glomerular layer and internal plexiform layer to form synapses with M/T cells and interneurons, mainly PG cells and granule cells (Nickell and Shipley, 1988a; Le Jeune and Jourdan, 1993; Salcedo et al., 2011). Consistently, bulbar neurons express nicotinic-type and muscarinic-type cholinergic receptors (Castillo et al., 1999; Crespo et al., 2000). However, different groups have made conflicting observations of cholinergic effects on bulbar neurons. Recordings from brain slices show that acetylcholine excites mitral cells and PG cells via nicotinic receptors, whereas it inhibits granule cells via muscarinic receptors (Castillo et al., 1999; D'Souza and Vijayaraghavan, 2012). In contrast, several recordings demonstrate that muscarinic receptors mediate the inhibitory effects of acetylcholine on PG cell and excitatory effects on granule cell excitability (Ghatpande et al., 2006; Pressler et al., 2007; Pignatelli and Belluzzi, 2008). Inconsistency also exists among in vivo recordings from different groups. Two early studies report inhibitions of putative mitral cell by either local infusion of acetylcholine or electrical stimulation of HDB (Bloom et al., 1964; Nickell and Shipley, 1988b). In contrast, several other recordings indicate that HDB stimulation inhibits granule cells and excites mitral cells (Elaagouby et al., 1991; Kunze et al., 1991). Moreover, a recent study reports that pharmacological manipulation of acetylcholine transmission does not affect the spontaneous firing activity of mitral cells, suggesting lack of cholinergic effects on the excitability of mitral cells in vivo (Chaudhury et al., 2009).
Our data demonstrate that selective stimulation of HDB cholinergic neurons strongly inhibits the spontaneous firing activity of M/T cells. This result is consistent with the two early studies (Bloom et al., 1964; Nickell and Shipley, 1988b) but differs from most of other in vivo recordings. Our technical approaches circumvent several potential confounding factors often associated with electrical stimulation or pharmacological interventions. Because the MOB receives input from GABAergic and cholinergic neurons that are intermixed in the HDB (Záborszky et al., 1986), electrical stimulation of the HDB likely activates these two neuron populations and thus increases both GABA and acetylcholine signals in the bulb. In addition to the advantage of selectivity, optical stimulation of cholinergic neurons releases acetylcholine at their action sites and thus avoids the potential issues of physiologically irrelevant drug dosage, multiple receptor types and slow diffusion that are associated with local drug infusions. Last, morphological labeling of recorded cells allows us to more accurately cluster the response patterns according to specific cell types.
What are the cellular mechanisms underlying the inhibitory effect of cholinergic signals on M/T cells? One possibility is that acetylcholine excites GABAergic interneurons via muscarinic receptors and in turn inhibits M/T cells by releasing GABA (Pressler et al., 2007). However, we find that light activation of HDB cholinergic neurons profoundly suppresses the firing activity of a vast majority of interneurons, including both PG cells and granule cells. It is possible that cholinergic activity directly inhibits both M/T cells and interneurons by acting on multiple acetylcholine receptors other than what have been reported to activate interneurons (Castillo et al., 1999; Ghatpande et al., 2006; Pressler et al., 2007; Pignatelli and Belluzzi, 2008). In addition, acetylcholine may target the axonal terminals of epithelial olfactory neurons to dampen the spontaneous sensory drive (D'Souza and Vijayaraghavan, 2012).
Computational modeling has theorized that the basal forebrain cholinergic system serves to increase lateral inhibition and sharpens odor representation of M/T cells (Linster and Cleland, 2002). Physiological recordings using a small number of odorants with similar molecular structures suggest that pharmacologically increasing acetylcholine levels reduces the overlap between the representations of similar odors by mitral cells (Chaudhury et al., 2009). For a majority of M/T cells, light stimulation of HDB cholinergic neurons increases the responses to optimal odorants yet suppresses the responses to non-optimal odorants. It is possible that phasic release of acetylcholine enhances the efficacy of synaptic connections between M/T cells and GABAergic interneurons. Consequently, the strengthened lateral inhibition increases response contrast and sharpens olfactory tuning.
For a subset of M/T cells, the modulatory effect of cholinergic activity does not seem to fit the model of increased lateral inhibition. The variability of stimulation effects is unlikely attributable to a failure to activate HDB cholinergic neurons, because the spontaneous firing activity of all M/T cells is modified by light stimulation. Rather, the diverse effects may be the evidences for the complexity of intrabulbar circuitry. A single odorant often activate multiple glomeruli with variable degrees, and the M/T cells associated with these glomeruli form intricate interactions (Meredith, 1992; Rubin and Katz, 1999; Uchida et al., 2000; Wachowiak and Cohen, 2001; Soucy et al., 2009). Additionally, cholinergic terminals are not evenly distributed in the MOB (Gómez et al., 2005; Salcedo et al., 2011). As a result, the olfactory tuning curves of individual M/T cells may be differentially influenced depending on the difference between their directly associated glomeruli and the set of glomeruli activated by test odorants.
Strikingly, cholinergic activation produces a broad enhancement of responsiveness to odorants for a majority of PG cells and granule cells. Because the activity of GABAergic PG cells and granule cells is thought critical for lateral inhibition (Mori et al., 1999; Tan et al., 2010), the increase in the responsiveness of interneurons provides additional support to the hypothesis that cholinergic signals sharpen the tuning of M/T cells. Although it seems paradoxical that cholinergic activity reduces neuronal excitability but increases olfactory responses of interneurons, the differential effects may be explained by the expression of different receptors on neuronal somata and synapses between M/T cells and interneurons (Castillo et al., 1999; Crespo et al., 2000; Pressler et al., 2007).
Behavioral assays have revealed that acetylcholine signals in the olfactory bulb are associated with animal performance of odor discrimination (Linster et al., 2001; Mandairon et al., 2006; Chaudhury et al., 2009; Hellier et al., 2010). We have found that selective activation of HDB cholinergic neurons reduces the basal excitability and sharpens the olfactory tuning properties of M/T cells. The olfactory information carried by a specific odorant receptor is believed to channel to its corresponding subset of M/T cells (Mori et al., 1999; Tan et al., 2010). Our results suggest that the HDB cholinergic input provides a mechanism for animal behaving states, such as attention to modulate neuronal odor representation and thus bulbar output to downstream centers.
Footnotes
M.L. is supported by China Ministry of Science and Technology 973 Program Grant 2010CB833902. We are grateful to G. Feng (Massachusetts Institute of Technology, Cambridge, MA) for ChAT–ChR2–EYFP mice and F. Zhang (National Institute of Biological Sciences, Beijing, China) for slice recordings.
- Correspondence should be addressed to Minmin Luo, 7 Science Park Road, Zhongguancun Life Science Park, Beijing, 102206, China. luominmin{at}nibs.ac.cn


