

Abstract
The processing of motion in visual scenes is important for detecting and tracking moving objects as well as for monitoring self-motion through the induced optic flow. Specialized neural circuits have been identified in the vertebrate retina for detecting motion direction or for distinguishing between object motion and self-motion, although little is known about how information about these distinct features of visual motion is combined. The salamander retina, which is a widely used model system for analyzing retinal function, contains object-motion-sensitive (OMS) ganglion cells, which strongly respond to local motion signals but are suppressed by global image motion. Yet, direction-selective (DS) ganglion cells have been conspicuously absent from characterizations of the salamander retina, despite their ubiquity in other model systems. We here show that the retina of axolotl salamanders contains at least two distinct classes of DS ganglion cells. For one of these classes, the cells display a strong preference for local over global motion in addition to their direction selectivity (OMS-DS cells) and thereby combine sensitivity to two distinct motion features. The OMS-DS cells are further distinct from standard (non-OMS) DS cells by their smaller receptive fields and different organization of preferred motion directions. Our results suggest that the two classes of DS cells specialize to encode motion direction of local and global motion stimuli, respectively, even for complex composite motion scenes. Furthermore, although the salamander DS cells are OFF-type, there is a strong analogy to the systems of ON and ON-OFF DS cells in the mammalian retina.
SIGNIFICANCE STATEMENT The retina contains specialized cells for motion processing. Among the retinal ganglion cells, which form the output neurons of the retina, some are known to report the direction of a moving stimulus (direction-selective cells), and others distinguish the motion of an object from a moving background. But little is known about how information about local object motion and information about motion direction interact. Here, we report that direction-selective ganglion cells can be identified in the salamander retina, where their existence had been unclear. Furthermore, there are two independent systems of direction-selective cells, and one of these combines direction selectivity with sensitivity to local motion. The output of these cells could assist in tracking moving objects and estimating their future position.
Introduction
Motion is omnipresent in the visual scenes that are projected onto our retinas. Head and eye movements cause frequent global shifts of projected images, whereas moving objects within the scene evoke differential motion between the small object area and the background. The detection and correct interpretation of these different motion features in visual scenes can be essential for the survival of an animal.
In the retina, the distinction between global motion signals and local object motion is achieved by the class of object-motion-sensitive (OMS) ganglion cells (Ölveczky et al., 2003). These cells are suppressed when images move coherently across the entire retina, but they respond strongly to local motion signals inside the receptive field center when this motion differs from motion signals of the background. Thus, OMS cells appear to act as detectors of object motion in the presence of self-motion. Yet, these cells do not represent a homogeneous, single type of ganglion cells. Rather object-motion sensitivity may be found for ganglion cells of different types (Ölveczky et al., 2003), and one may therefore hypothesize that specific types of ganglion cells combine object-motion sensitivity with other functional characteristics for further analysis of local motion beyond a mere detection.
One important aspect for analyzing motion stimuli is to identify the motion direction. In the retina, this is realized by direction-selective (DS) ganglion cells, which respond strongly to motion in the preferred direction but are suppressed by motion in the opposite, “null” direction (Barlow and Hill, 1963; Vaney et al., 2001; Borst and Euler, 2011). DS ganglion cells have been observed in many species, including rabbit (Barlow and Hill, 1963; Oyster and Barlow, 1967), cat (Cleland and Levick, 1974; Farmer and Rodieck, 1982), mouse (Weng et al., 2005; Sun et al., 2006; Elstrott et al., 2008; Huberman et al., 2009), fish (Maximov et al., 2005; Tsvilling et al., 2012), pigeons (Maturana and Frenk, 1963; Markram et al., 1998), turtles (Bowling, 1980; Jensen and DeVoe, 1983), frogs (Lettvin et al., 1959; Maturana et al., 1960), and mudpuppy (Werblin, 1970). Surprisingly, the existence of DS ganglion cells is obscure for the retina of the mole salamander, which is one of the most prominent model systems for studying retinal function and in particular motion encoding (Schwartz et al., 2007; Leonardo and Meister, 2013; Chen et al., 2014; Marre et al., 2015), including detailed analyses of the functions and mechanisms of OMS ganglion cells (Ölveczky et al., 2003, 2007; Baccus et al., 2008). While early reports had shown a few examples of DS responses in the salamander retina (Pan and Slaughter, 1991), more recent attempts to characterize and classify salamander ganglion cells did not find significant direction selectivity (Segev et al., 2006).
Here, we report that DS ganglion cells can be identified and thoroughly characterized in the axolotl salamander retina. Moreover, a subset of the identified DS ganglion cells also display object-motion sensitivity. This separates the DS ganglion cells of the salamander retina into two distinct systems, which also differ in their receptive field properties and their organization of preferred directions. Thus, specific ganglion cells jointly encode the occurrence of local object motion as well as motion direction and may therefore play a special role in the tracking of small moving objects.
Materials and Methods
Electrophysiology.
We used isolated retinas from adult axolotl salamanders (Ambystoma mexicanum, pigmented wild-type) of either sex. All experiments were performed in accordance with national and institutional guidelines of the University Medical Center Göttingen. After dark-adapting and killing the animal, the dorsal region of each eye was marked with help of a soldering iron before enucleation to keep track of the retina's orientation. The eye was dissected under infrared light on a stereo-microscope equipped with night-vision goggles. We hemisected the eyes along the edge of the cornea and marked the ventral region with a small vertical cut. We removed the vitreous humor, separated the retina from the eyecup, and removed the pigment epithelium. The retina was mounted onto a semipermeable membrane, stretched across a circular plastic holder, with the photoreceptors facing the membrane. Membrane and retina were positioned onto a multielectrode array (MEA; Multichannel Systems; 252 electrodes; 10 or 30 μm electrode diameter; 60 or 100 μm minimal electrode distance) so that retinal ganglion cells faced the electrodes of the MEA. During recordings and dissection, the retina was superfused with oxygenated (95% O2, 5% CO2) Ringer's solution, containing 110 mm NaCl, 2.5 mm KCl, 1 mm CaCl2, 1.6 mm MgCl2, 22 mm NaHCO3, and 10 mm d-glucose, pH 7.4, at a constant temperature of ∼25°C. Voltage signals of retinal ganglion cells were recorded with 10 kHz sampling rate and bandpass filtered between 200 Hz and 5 kHz. Spikes were sorted offline with custom-made software, based on a Gaussian mixture model (Pouzat et al., 2002).
Pharmacology.
In a subset of experiments, we blocked inhibitory pathways in the retina by switching from the standard Ringer's solution to a Ringer's solution containing 20 μm strychnine, 130 μm picrotoxin, or 10 μm gabazine (SR-95531, Sigma-Aldrich). Strychnine is a competitive glycine receptor antagonist, whereas picrotoxin and gabazine are a noncompetitive GABAa/c and competitive GABAa receptor antagonist, respectively. Recordings resumed 10 min after onset of drug application. We performed control recordings before drug application as well as 20 min after switching back to the standard Ringer's solution.
Visual stimulation.
The retinas were visually stimulated by a monochromatic white OLED microdisplay (eMagin) with 800 × 600 square pixels and 60 Hz refresh rate. Stimuli were projected onto the photoreceptor layer through a 2.0× telecentric lens (Edmund Optics) with a pixel size of 7.5 μm × 7.5 μm on the retina. The mean irradiance of the projected stimuli was 6.33 mW/m2, corresponding to photopic light levels. Visual stimuli were generated through custom-made software, based on Visual C++ and OpenGL.
Receptive field properties.
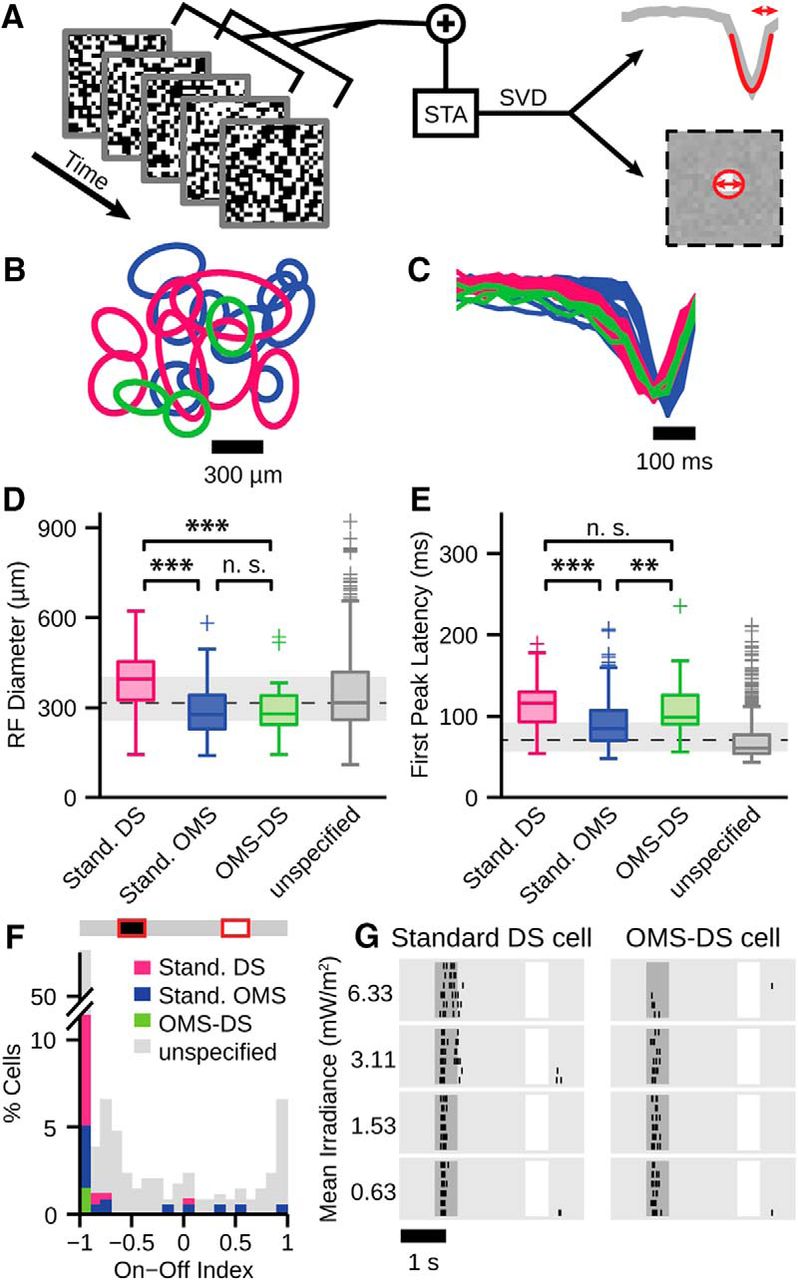
We used a spatiotemporal white-noise stimulus consisting of a checkerboard layout with 80 × 60 individual squares of 75 μm edge length to estimate the receptive field size and temporal dynamics of each cell. Each square was randomly set to black or white (100% contrast) with a probability of 50% each and an update rate of 30 Hz. We obtained the spatiotemporal filter for each cell by calculating the spike-triggered average (Chichilnisky, 2001) and then used singular-value decomposition to separate the spike-triggered average into a spatial and a temporal receptive field component (Wolfe and Palmer, 1998). Spatial receptive fields were fitted with a 2D Gaussian and represented by ellipses corresponding to the 1.5-σ contour of the Gaussian fits. From these ellipses, we obtained the receptive field diameters d =  , where a and b are the major and minor axes of the ellipses. From the temporal receptive field component, we obtained the first-peak latency by fitting a parabola in a 100 ms time window around the strongest positive or negative peak.
Distributions of receptive field diameters and first peak latencies were usually non-Gaussian. Therefore, significance of differences in receptive field properties between different cell classes were tested with the nonparametric Wilcoxon rank sum test. Some cells responded with low firing rates to the white-noise stimulus and thus yielded noisy estimates of spatiotemporal receptive fields. We therefore excluded cells with firing rates <0.3 Hz under white-noise stimulation and noisy temporal filters (where the peak size of the filter was <2 SD of the noise in the filter) from the population analysis of receptive field properties. This affected ∼30% of the recorded OMS cells, which tended to not respond well to this stimulus, but only few other cells.
Direction selectivity.
To determine the directional preference of each cell, we generally used square-wave gratings of 600 μm spatial period and 100% contrast, drifting at a speed of 450 μm/s, corresponding to a temporal frequency of 0.75 Hz. The gratings were presented in a sequence of eight equally spaced directions of motion. Each direction was presented for 6.67 s, with 1.67 s of homogeneous illumination at mean intensity separating successive directions. This sequence was repeated five times. We determined the directional tuning of each cell by calculating the mean firing rates fθ in response to the directions θ, leaving out the stimulus onset response during the first 1.33 s. The vector sum of the fθ in direction θ then yielded the preferred direction of each cell. To quantify the tuning, we calculated a direction selectivity index (DSI) from the mean firing rates to the different directions as follows:
 A DSI close to zero indicates that the cell is not DS, and a DSI close to unity corresponds to strong direction selectivity with narrow tuning. This direction selectivity measure is more robust against spike rate fluctuations than measures that only take the preferred and null direction into account (Mazurek et al., 2014). Cells with a DSI >0.3 generally showed a clear directional tuning and were considered as DS cells for further analyses. Cells with a total mean firing rate <1 Hz for this stimulus were considered as non-DS and were excluded from the analysis of the distribution of the DSI.
For testing the range of spatial and temporal frequencies to which DS cells were directionally tuned, we performed additional experiments where we applied the drifting gratings with different combinations of spatial period and temporal frequency. Spatial period was 300, 600, or 1200 μm, and temporal frequency was 0.375, 0.75, 1.5, or 3 Hz, leading to 12 different combinations, which were applied in randomized order. For each combination, each of the eight motion directions was presented for 6.67 s, except for gratings with temporal frequency of 0.375 Hz, which were presented for 13.33 s to ensure a minimum of five temporal periods presented per direction.
In some experiments, we used drifting dark spots to test whether the cells are also directionally tuned for small objects. The spots had diameters of 210 μm and were distributed across the entire width of the MEA. Minimal distances between spot centers were 930 μm in the direction parallel to the motion and 187.5 μm in the perpendicular direction. We used the same speed and set of directions as for the drifting gratings. Each direction was here presented once for 40 s. During this time, each spot drifted three times across the retina.
Object-motion sensitivity.
We assessed the cells' sensitivity to object motion by using patches of jittering gratings. The circular patches of 750 μm diameter were arranged in a hexagonal pattern on a mean-intensity background, with neighboring patches touching each other. Each patch contained a square-wave grating of 300 μm period at 100% contrast. The gratings jittered with random trajectories, obtained as a random walk with 15 μm step size, updated at 30 Hz. The gratings in the different patches either moved independently of each other, each with its own random trajectory (“differential motion”), as if they represented distinct objects, or they moved coherently with the same trajectory (“coherent motion”), imitating a global motion signal. The central patch was aligned to the center of the MEA and had identical trajectories for both types of motion. Differential and coherent motion were presented in alternating blocks of 23.33 s, separated by 1.67 s of mean-intensity illumination, for a total of six repetitions. The stimulus is similar to the one used previously by Ölveczky et al. (2003) for analyzing sensitivity to differential motion, but the multiple independent patches in the present case allow detecting cells with sensitivity to differential motion over a wider area, suited for the larger-scale MEAs used in this study.
For each cell, we quantified the preference for differential or coherent motion by calculating an object-motion sensitivity index (OMSI) from the mean firing rates in response to differential and coherent motion, fd and fc, respectively, leaving out the first 1 s after stimulus onset, as follows:
 The OMSI ranges from −1 to 1 and is negative for cells that prefer coherent motion and positive for cells that prefer differential (“object”) motion. We considered cells with OMSI of ≥0.7 as OMS.
Component and pattern selectivity.
To test whether different classes of motion-sensitive cells respond differently to more complex motion scenarios with local as well as global motion features, we used a so-called plaid stimulus known from psychophysics and physiology (Adelson and Movshon, 1982; Movshon et al., 1985; Castelo-Branco et al., 2002). The plaid stimulus is a composite motion stimulus whose individual components move locally into different directions than the pattern of the fused components.
The components of the stimulus were semitransparent gratings of black bars in two orientations, rotated with respect to each other by 120°, on a mean-luminance background. The bars were 180 μm wide, with a period of 600 μm. The contrast of each individual bar was −50%, and −75% where the bars crossed. The bars drifted with a velocity of 450 μm/s perpendicular to their orientation. To facilitate comparison with responses to standard drifting gratings, the drift directions of the components were chosen so that the global plaid pattern was moving into the same eight directions as used for the standard drifting gratings. The stimulus was presented five times for 6.67 s for each direction. Tuning and DSI for this stimulus were calculated by considering the motion direction of the global plaid pattern as the reference motion direction of the stimulus.
To determine whether the cells were more strongly driven by the motion of the individual components or by the motion of the pattern, we calculated a “pattern prediction” and a “component prediction” for the direction tuning to the plaid stimulus under the assumption that the cells were either pattern- or component-selective, respectively. The pattern prediction was given directly by the tuning curve measured with the drifting gratings. The component prediction, on the other hand, was obtained by assuming that the cell responded to each of the two stimulus components separately and that these response components could be summed. Concretely, we rotated the tuning curve for the drifting gratings by 60° as well as by −60° and linearly interpolated the rotated tuning curves to obtain values at 0°, 45°, 90°, …, 315° motion direction. The two rotated tuning curves were then summed to obtain the component prediction.
To assess how well the measured tuning curve under the plaid stimulus matched either of the two predictions, we correlated the measured and predicted responses over the eight stimulus directions and computed the correlation coefficients rp and rc for the pattern prediction and component prediction, respectively. To determine whether the measured plaid tuning of a cell was significantly better captured by either the pattern or the component prediction, we then calculated the partial correlations (Movshon et al., 1985) as follows:

 where rpc is the correlation between pattern and component prediction. These partial correlations take into account that the pattern and component predictions are not independent and that therefore the raw correlation measures rp and rc are not independent of each other (Cramér, 1946). Whether a cell was significantly pattern- or component-selective was determined from the one-sided 90% confidence interval of the Fisher transformed partial correlations Zp/c =
  (Smith et al., 2005). The Fisher transformation converts distributions of correlation coefficients into normal-like distributions with unity standard deviation (Fisher, 1915). Cells were significantly component-selective when Zc > 1.28 or Zc − Zp > 1.28 for negative or positive pattern correlations, respectively. Similarly, cells were significantly pattern-selective when Zp > 1.28 or Zp − Zc > 1.28 for negative or positive component correlations, respectively.
Results
We recorded the spiking activity from ganglion cells in the salamander retina with two types of visual motion stimuli: drifting gratings (Fig. 1A) and patches of jittering gratings (Fig. 1B). The drifting gratings were applied in eight different directions and were used to probe the cells' sensitivity for different motion directions. The patches of jittering gratings were applied in two modes. In the differential motion mode (Fig. 1B, top), the gratings in each patch jittered with different trajectories, simulating the independent motion of different objects. In the coherent motion mode (Fig. 1B, bottom), all patches moved synchronously with the same trajectory, resulting in a global motion pattern that simulates the occurrence of fixational eye movements (Ölveczky et al., 2003). The patches were chosen to be considerably larger than typical ganglion cell receptive field centers so that stimulation of the receptive field center generally occurred through a single patch, with other patches activating the periphery of the receptive field.

Classification of standard DS, standard OMS, and OMS-DS cells. A, Layout of drifting-grating stimulus with different motion directions (red arrows) for identifying DS cells. Gray dashed lines indicate borders of the MEA. Ellipses indicate receptive fields of sample standard DS (magenta), standard OMS (blue), and OMS-DS cells (green). B, Layout of stimulus for identifying OMS cells, consisting of patches of jittering gratings, which moved either differentially with independent trajectories (top, cyan and orange traces) or coherently with the same trajectory as the central patch (bottom, orange traces). C–E, Responses of the sample standard DS (C), standard OMS (D), and OMS-DS cell (E). Top, Raster plots for repeated presentation of drifting gratings in eight different directions. Gray bars represent when a dark region covered the receptive field midpoint. Middle, Polar plots of mean firing rates (in Hz) for the eight directions. Arrows indicate the vector sum of the responses divided by 2 for better display. Bottom, Raster plots of responses to differentially and coherently jittering gratings. F–H, Classification of standard DS (magenta), standard OMS (blue), and OMS-DS cells (green) from 30 retinas and 4126 recorded cells (unspecified cells shown in gray). F, Distribution of DSI. Cells with DSI >0.3 are considered DS cells. G, Bimodal distribution of OMSI. Cells with OMSI >0.7 are considered OMS cells. H, Proportions of recorded cell types.
Analysis of preferences for object motion and motion direction reveals three motion-sensitive response types in the salamander retina
Responses to the drifting gratings revealed DS cells, which responded most strongly to a certain motion direction of the drifting gratings but showed little response when the grating moved in the opposite direction (Fig. 1C, top). When the DS cells were activated by the drifting grating, the activity occurred whenever a dark stripe of the grating crossed the receptive field center, as marked by the gray regions in the raster plots (Fig. 1C, top), indicating that the DS cells are OFF cells.
Other cells were not directionally selective but responded much more strongly to the differential motion of the patches of jittering gratings than to the coherent motion, as shown by an example in Figure 1D. The different activity levels of the sample cell occurred even though the cell's receptive field center (Fig. 1B, blue ellipse) was entirely covered by a single patch, and this patch contained identical stimulus sequences during differential and coherent motion. Ganglion cells with such selectivity for differential motion had previously been described by Ölveczky et al. (2003) and are called OMS cells. The present stimulus is slightly different from the one originally used by Ölveczky et al. (2003), where the stimulus had been divided into a central object region and a surrounding background region. Here instead, we used multiple independent object regions with no defined background region, which, although less directly connected to the case of object motion in conjunction with self-motion, allowed us to analyze ganglion cells independently of whether their receptive fields happened to lie in the central stimulus area. This is advantageous for the use of larger electrode arrays, as applied in our work.
Both direction selectivity and object-motion sensitivity had been studied previously as independent phenomena. However, here we found that a subset of DS cells also showed a strong preference for differential motion (Fig. 1E). Thus, these cells combine both types of feature selectivity, and we therefore refer to these cells as OMS-DS cells. They responded selectively to a certain direction of drift (Fig. 1E, middle) and preferred patches of differentially jittering gratings over coherently jittering gratings (Fig. 1E, bottom). Like the “standard” DS cell (Fig. 1C), both the “standard” OMS cell and the OMS-DS cell responded to the black bars of the drifting gratings (Fig. 1D,E, top) and thus appear to be OFF cells.
To systematically analyze the properties of the populations of DS, OMS, and OMS-DS cells, we quantified the degree of direction selectivity and object-motion sensitivity for each recorded cell by appropriate indices (see Materials and Methods). We computed a DSI to measure the angular tuning of the firing rates in response to drifting gratings. Values near zero mean that the cells responded about equally well to all directions, whereas strong responses for only one direction yield DSI values close to unity. We found that the distribution of the DSIs showed a long tail at large values (Fig. 1F). For subsequent population analyses, we considered all cells with a DSI >0.3 as DS.
We computed an OMSI as the normalized difference between the firing rates under differential and coherent motion. The index is positive for cells that preferred differential motion and negative when the cells responded more strongly to coherent, global motion. The OMSI shows a bimodal distribution and is centered in the positive range (Fig. 1G). Hence, most of the cells responded slightly better to differential motion than to coherent motion, yet a particular subset of cells showed especially strong preference for differential motion. For further analyses, we here considered the cells in the rightmost peak as OMS cells and applied a threshold of 0.7.
Among the thus identified OMS and DS cells, a subset of cells belonged to both classes, showing direction selectivity with a DSI >0.3 and object-motion sensitivity with an OMSI >0.7 (Fig. 1H). In the following, we compare the characteristics of these OMS-DS cells to those of the standard DS and standard OMS cells that only crossed threshold for one of the two indices.
OMS-DS cells have long response latencies like standard DS cells but small receptive fields like standard OMS cells
To investigate whether standard DS, standard OMS, and OMS-DS cells also differ in other aspects than their motion preferences, we analyzed their receptive field properties. We calculated the spike-triggered average from the responses to a spatiotemporal white-noise stimulus (Fig. 2A) and separated it into its temporal and spatial receptive field components (see Materials and Methods). While the spatial receptive field component measures the area where a cell is most sensitive to visual stimulation, the temporal receptive field component reflects the response kinetics, indicating, for example, a rapid response after stimulation by an early peak in this component.

OMS-DS cells differ from standard DS cells in receptive field size and from standard OMS cells in response latency. A, Schematics of derivation of temporal filter and spatial receptive field from responses to spatiotemporal white-noise stimulation. The first peak of the temporal filter (top) is fitted by a parabola (red curve) to estimate first-peak latency (arrow). The spatial receptive field (bottom) is fitted by a 2D-Gaussian. Contours at 1.5 σ (red circle) are used to estimate receptive field diameter (arrow). B, C, Receptive field contours (B) and temporal filters (C) of standard DS (magenta), standard OMS (blue), and OMS-DS cells (green) from a single retina. D, E, Box plots of receptive field diameters (D) and first peak latencies (E) of 134 standard DS (magenta), 258 standard OMS (blue), 18 OMS-DS (green), and 852 unspecified cells (gray) from 16 experiments. Central line and box represent the median and the interquartile range (IQR) from first to third quartile, respectively. Whiskers extend to most extreme values within 1.5 × IQR. + indicates outliers. Dashed line and gray bar in background indicate population median and IQR, respectively. **Significant difference at the 1% level (Wilcoxon rank sum test). ***Significant difference at the 0.5% level (Wilcoxon rank sum test). F, Distribution of ON-OFF index from responses to ±40% contrast steps around usual background luminance. G, Responses of sample standard DS and OMS-DS cells to ±40% contrast steps at different background light levels. All 12 standard DS and 6 OMS-DS cells recorded with this stimulus responded similarly.
Figure 2B shows spatial receptive field contours of standard DS (magenta), standard OMS (blue), and OMS-DS cells (green) from a single retina as an example. The corresponding temporal components are displayed in Figure 2C. The temporal receptive field components displayed negative first peaks for all three investigated cell classes, indicating that the cells were activated by negative contrast inside the receptive field, thus confirming that these cells are OFF cells, as had been observed for the responses to the drifting gratings (Fig. 1C–E, top). To compare receptive field sizes and temporal kinetics between the three cell types, we computed for each recorded ganglion cell the spatial receptive field diameter (Fig. 2D) and the first-peak latency of the temporal receptive field component (Fig. 2E). We found that standard DS and standard OMS cells differed in both these measures, with standard DS cells having larger receptive field diameters (390 ± 94 μm vs 289 ± 78 μm, mean ± SD, p < 10−5, Wilcoxon rank sum test) and slower response kinetics with longer first-peak latency (114 ± 27 ms vs 87 ± 27 ms, p < 10−5). Interestingly, OMS-DS cells shared one of these features with the standard DS and the other with the standard OMS cells. Regarding receptive field size, we found that OMS-DS cells also had relatively small receptive fields (297 ± 110 μm), comparable with standard OMS cells (p = 0.74), but significantly smaller than standard DS cells (p = 0.0005). Regarding temporal kinetics, on the other hand, OMS-DS cells showed relatively long first-peak latencies (112 ± 41 ms), comparable with standard DS cells (p = 0.32) and significantly longer than standard OMS cells (p = 0.005).
Thus, although OMS-DS cells are DS as standard DS cells and OMS as standard OMS cells, they can be distinguished from either of these two cell types by their receptive field properties, having smaller receptive fields than standard DS cells and slower temporal filters than standard OMS cells. This indicates that the three functionally distinguished populations of motion-sensitive cells in the salamander retina indeed correspond to different types of retinal ganglion cells. It is also noteworthy that all three populations exhibit rather long integration times compared with the entire set of all recorded ganglion cells (Fig. 2E). This likely reflects the general temporal demands of motion processing because motion processing relies on comparing stimuli across space and time.
In the mammalian retina, DS cells are usually ON- or ON-OFF-type. From the above observations, it seems that standard DS and OMS-DS cells in the salamander are OFF-type. To further test this, we calculated an ON-OFF index (fON − fOFF)/(fON + fOFF) from the firing rates fON and fOFF in response to contrast steps of 40% and −40%, respectively (Fig. 2F, inset). The ON-OFF indices of standard DS and OMS-DS cells were nearly all very close to −1, which indicates that these cells only responded to dark contrast (Fig. 2F). To check whether the pure OFF responses of DS and OMS-DS cells persisted at lower mean light intensities, we performed control experiments, in which we varied the mean irradiance of the projected stimulus over an order of magnitude (Fig. 2G). All 12 standard DS and 6 OMS-DS cells recorded under these conditions exclusively showed OFF responses across all tested light levels, as demonstrated by two examples. This further confirms that standard DS and OMS-DS cells are true OFF-type cells in the salamander retina.
Standard DS and OMS-DS cells differ in their organization of preferred directions
In the mammalian retina, the preferred directions of DS ganglion cells are not randomly distributed but rather cluster around a few distinct directions (Vaney et al., 2001). To investigate whether the two systems of DS cells observed here in the salamander retina display such patterns in their distributions of preferred directions, we determined the preferred directions of the recorded DS cells relative to the orientation of the retina (Fig. 3A,B,D,E) by tracking the retina's orientation during the dissection process (see Materials and Methods). Additionally, for each pair of DS cells recorded simultaneously from the same piece of retina, we calculated the difference between the preferred directions to assess the distribution of preferred directions independently of the tracking of the retina's orientation (Fig. 3C,F).

Standard DS and OMS-DS cells show different organization of preferred directions. A, D, Preferred directions of standard DS (A) and OMS-DS cells (D) of a left-eye retina, with zero degrees pointing into the temporal direction. B, E, Polar distributions of preferred directions from aligned retinas of 8 right and 9 left eyes. Zero degrees here denotes the temporal direction for left eyes and the nasal direction for right eyes. Inset, Frontal view of an axolotl salamander. Arrows indicate the temporal (t), nasal (n), dorsal (d), and ventral (v) direction on the retina for each eye. C, F, Angular differences calculated from simultaneously recorded pairs of standard DS cells (C) and OMS-DS cells (F), respectively. Fits from Gaussian-mixture models indicate peaks at 0° and 120° and at 0°, 90°, and 145° for standard DS and OMS-DS cells, respectively. Data from 24 retinas.
For standard DS cells, we found that preferred directions come in three clusters with preference for temporal, nasal-dorsal, and nasal-ventral motion on the retina (Fig. 3A,B). The distribution of angular differences pooled from 24 retinas shows peaks at 0° and 120° (Fig. 3C), corroborating that preferred directions center around three equally spaced main directions, separated from each other by 120°. However, in our recordings, these three directions were not equally represented. The temporal direction clearly outnumbered the other two preferred directions (Fig. 3B), which also led to a higher peak at 0° than at 120° in the distribution of the angular differences. Whether this uneven distribution reflects an actual stronger representation of the temporal direction among standard DS cells or whether it resulted from a recording bias remains at present an open question.
For the identified OMS-DS cells, we also found that preferred directions were not randomly distributed but clustered around certain values. In particular, the large majority of recorded OMS-DS cells preferred motion in the ventral direction on the retina (Fig. 3D,E). The remaining OMS-DS cells had preferred motion directions mainly in the temporal horizontal direction, and a few cells preferred dorsal motion directions. Correspondingly, the distribution of the angular differences had three peaks (Fig. 3F), suggesting that the preferred directions of OMS-DS cells are organized approximately along the cardinal directions. It seems possible that the strong overrepresentation of the ventral preferred direction among the identified OMS-DS cells reflects a recording bias, but we cannot exclude that there is a strong overrepresentation of the ventral direction by OMS-DS cells in the salamander retina and that the nasal direction is not represented at all. Yet, the organization of preferred directions clearly differs between standard DS and OMS-DS cells, which underscores that these are two distinct populations of DS cells in the salamander retina, likely serving different functions for motion processing.
Furthermore, compared with standard DS cells, the firing rates of OMS-DS cells to drifting gratings were much lower (2.1 ± 1.1 Hz vs 4.6 ± 2.4 Hz, mean ± SD, p < 10−5, Wilcoxon rank sum test). This is consistent with the preference of OMS-DS cells for local object motion and reduced (though not entirely suppressed) responses to global motion of the drifting grating.
Receptive fields of DS cells are consistent with retinal tiling only when separated into subtypes
Dendritic fields of retinal ganglion cells of the same type generally avoid each other so that their receptive fields tile the retina in a mosaic fashion (Wässle and Boycott, 1991). Thus, strongly overlapping receptive fields indicate that the cells are of different cell types.
To investigate tiling for the observed classes of DS cells, we subdivided both standard DS and OMS-DS cells further into groups of similar preferred directions, as shown in Figure 4A for a sample recording with particularly many DS cells. The standard DS cells with temporal preferred direction (violet, top left) were the most numerous and showed tiling of receptive fields with minimal overlap and a high coverage of the recording area (dashed square). For standard DS cells with nasal-ventral (magenta) and nasal-dorsal (blue) preferred directions, fewer cells were recorded. Their receptive fields also did not overlap within each group, yet sampling was not sufficient to cover the recording area. However, these two groups clearly showed overlaps with cells of temporal preferred direction (Fig. 4B), indicating that the different preferred directions of standard DS cells have independent spatial layouts and show tiling only as individual groups.

Receptive fields of DS subtypes tile the retina. A, Receptive fields of DS cells from a left-eye retina, clustered according to preferred direction (indicated by arrows) and object-motion sensitivity. Gray dashed lines indicate borders of the MEA. OMS-DS cells (green) showed only one preferred direction here. B, Overlay of all receptive fields shown in A. C, Distributions of normalized receptive field (RF) distances between pairs of standard DS cells of the same preferred direction (filled, magenta) and of different preferred directions (open, black). Data from 16 retinas. Inset, Distance D between receptive field centers is normalized by the sum of receptive field radii r1 and r2 of Gaussian-fitted receptive fields at 1σ: d = D/(r1 + r2). D, Same as C, but for pairs of standard DS cells preferring motion into the nasal-ventral direction (filled, magenta), pairs of OMS-DS cells preferring motion into the ventral direction (hatched, green), and pairs of one standard DS and one OMS-DS cell preferring motion into approximately the ventral direction (open, black).
The OMS-DS cells (green) observed in this particular recording all preferred the ventral direction of motion. The receptive fields of the OMS-DS cells were also spread across the recording area without overlap with each other. Yet they strongly overlapped with receptive fields of standard DS cells of different preferred directions, supporting that OMS-DS cells should be treated as a separate type of DS ganglion cells.
For comparing the receptive field tiling from several retinas, we calculated the distances between receptive field centers of DS cell pairs and normalized them by the sum of their receptive field radii (Fig. 4C, inset). For standard DS cell pairs within the same directional subtype, small receptive field distances were found to be underrepresented (Fig. 4C,D, magenta), indicating that there is little receptive field overlap within the subtypes of standard DS cells. By contrast, standard DS cells of different subtypes more often had strongly overlapping receptive fields (receptive field distance less than half a receptive field diameter; Fig. 4C, black line), showing that receptive field tiling is violated for standard DS cells when subtypes of preferred directions are disregarded. For OMS-DS cells, we also found that receptive fields appeared to avoid each other when a single preferred direction was considered (Fig. 4D, hatched green; here for ventral motion, the most frequently encountered preferred direction of OMS-DS cells). Yet, receptive fields of these OMS-DS cells overlapped much more often with standard DS cells (Fig. 4D, black line), even when these were constrained to be of a similar preferred direction (here nasal-ventral). Thus, receptive field tiling is only preserved if standard DS and OMS-DS cells are indeed considered to be distinct cell types.
Direction selectivity is robust against changes in spatial or temporal frequency
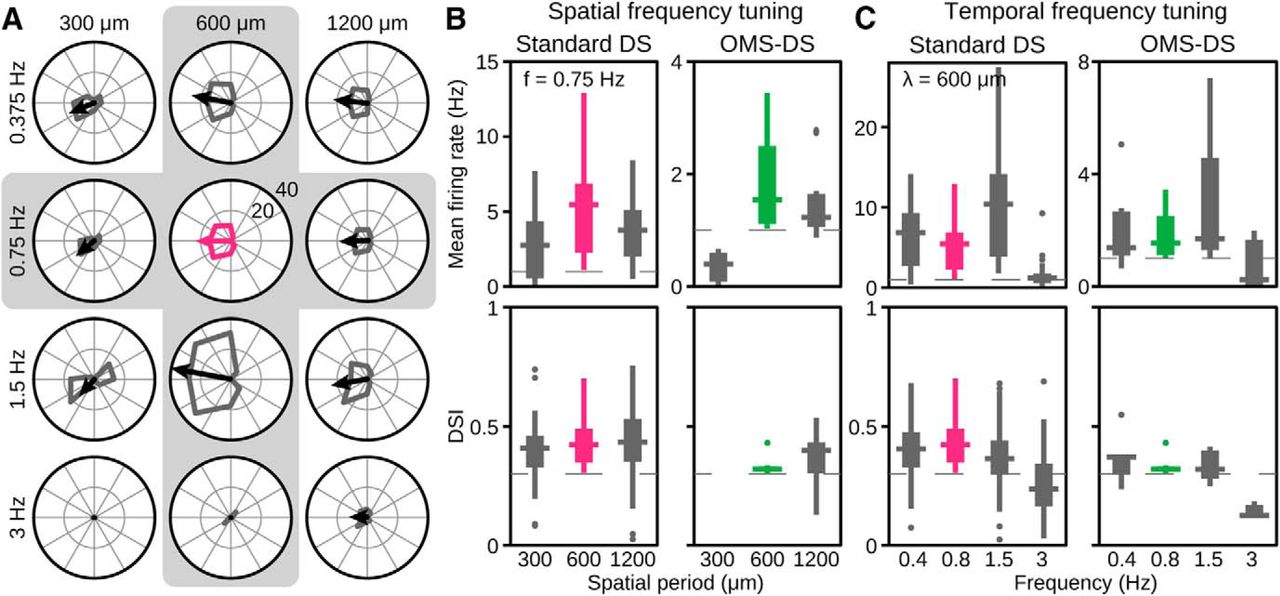
To check whether the observed direction selectivity in the salamander retina depends on the specific temporal and spatial scales of the applied grating stimuli, we performed additional experiments where we applied different combinations of spatial and temporal frequencies (Fig. 5). Figure 5A shows the resulting direction tuning curves for a sample standard DS cell. The cell displayed consistent direction tuning for large enough and slow enough gratings but did not respond well to small gratings of 300 μm spatial period or to fast gratings of 3 Hz temporal frequency.

Direction selectivity of standard DS and OMS-DS cells persists over a range of spatial and temporal frequencies. A, Directional tuning of a standard DS cell for different spatial periods (λ = 300, 600, 1200 μm) and temporal frequencies (f = 0.375, 0.75, 1.5, 3 Hz). Tuning under standard condition marked in magenta (λ = 600 μm, f = 0.75 Hz). B, C, Spatial (B) and temporal (C) frequency tuning of 76 standard DS cells (left) and 7 OMS-DS cells (right). Box plots showing the median, the interquartile range, and the full range for the distribution of average firing rates over all eight grating directions (top) and for the distribution of the DSI (bottom). Dashed lines indicate thresholds above which cells were considered DS. Box plots of DSI only include cells with mean firing rates >1 Hz because lower firing rates rendered the DSI noisy and unreliable. For λ = 300 μm, no measured OMS-DS cell had sufficient firing rate. Spatial frequency tuning (B) is here shown for temporal frequency fixed at the standard condition of f = 0.75 Hz, and temporal frequency tuning (C) for a spatial period fixed at the standard condition of λ = 600 μm. Data from the standard stimulus condition are shown in magenta and green for standard DS cells and OMS-DS cells, respectively. Data from four retinas.
In general, we found that, for large enough gratings, directional tuning was consistently observed for both standard DS and OMS-DS cells, but firing rates decreased for smaller gratings of 300 μm spatial period, in particular for OMS-DS cells (Fig. 5B). The latter may reflect the potent suppression of OMS-DS cells by peripheral stimulation with high-frequency gratings (Ölveczky et al., 2003). Similarly, we found for both cell types that directional tuning did not depend strongly on temporal frequency over a considerable range (Fig. 5C). However, for the highest tested temporal frequency of 3 Hz, firing rates were strongly reduced and directional tuning deteriorated accordingly. Thus, direction selectivity in the salamander retina is fairly robust against changes in temporal and spatial frequency but breaks down at high spatial and temporal frequencies.
GABAergic inhibition is involved in both direction selectivity and object-motion sensitivity
Direction selectivity in mouse and rabbit has been found to be mediated by GABAergic inhibition (Barlow and Levick, 1965; Wyatt and Day, 1976; Ariel and Adolph, 1985) from starburst amacrine cells (Weng et al., 2005; Briggman et al., 2011). These amacrine cells inhibit the response of a DS cell when a grating is drifting into the DS cell's null direction. GABAergic amacrine cells are also present in the salamander retina (Werblin et al., 1988; Yang et al., 1991), but whether they contribute to the computation of direction selectivity has not been studied yet. Regarding object-motion sensitivity, Ölveczky et al. (2003; see also Baccus et al., 2008) found a wide-field glycinergic amacrine cell in the tiger salamander that might be responsible for shutting down the responses of the OMS cell whenever the scene in the center and the far surround move coherently.
To investigate whether the observed motion processing in the three distinguished classes of ganglion cells also depend on specific inhibitory mechanisms, we performed recordings in the presence of 20 μm strychnine as a glycine antagonist as well as in the presence of 130 μm picrotoxin or 10 μm gabazine (SR-95531) as different types of GABA receptor antagonists. Direction selectivity in both standard DS and OMS-DS cells was not affected by the application of strychnine (p = 0.18 and p = 0.89, respectively, tested here and in subsequent analyses with a two-sided signed-rank test), but both picrotoxin and gabazine abolished direction selectivity in both classes of cells (p < 10−3 for standard DS cells and p < 0.05 for OMS-DS cells for both drugs; Fig. 6). This suggests that GABAergic inhibition is involved in the computation of motion direction in both standard DS and OMS-DS cells, whereas glycinergic inhibition is not.

GABAa/c antagonists suppress direction selectivity, but glycine antagonist strychnine does not. A, B, Raster plots and tuning curves of individual standard DS cells to drifting gratings before (left), during (middle), and after (right) application of strychnine (A) or picrotoxin (B). Red arrows indicate directions of drifting gratings. C–E, Effects of strychnine (C), picrotoxin (D), and gabazine (E) on the DSI of standard DS (magenta), standard OMS (blue), OMS-DS (green), and unspecified cells (gray). DSIs during drug application are plotted against the control, obtained before drug application. C, D, Arrows indicate standard DS cells in A and B, respectively. Data from three retinas per drug.
To investigate the effect of inhibition block on object-motion sensitivity, we first performed a similar experiment as originally described by Ölveczky et al. (2003). A circular patch with jittering square-wave gratings was displayed in the center, surrounded by another grating that jittered with a different trajectory (compare Fig. 7A, inset). This stimulus was displayed with different sizes of the central patch. As displayed for a sample standard OMS cell that lay in the center of the recording area (Fig. 7A), the firing rate decreased rapidly beyond a certain patch size. When applying strychnine, firing rates decreased less strongly with increasing patch size and saturated at an activity level that was higher than that under control conditions for large patch sizes. This strychnine-induced reduction of response suppression for increasing center patch size replicated the previous observations (Ölveczky et al., 2003).

Glycine and GABAa/c antagonists reduce object-motion sensitivity. A, Normalized firing rates of a standard OMS cell in response to a circular patch of varying size with jittering gratings (inset) before (left), during (middle), and after application of strychnine (right). A background grating jittered with a different trajectory, similar to Ölveczky et al. (2003). Red ellipse indicates the cell's receptive field. Mean firing rates from three trials are normalized by the maximum firing rate and plotted against patch radius. Error bars indicate SD. B–D, Responses of individual standard OMS cells to patches of jittering gratings before (left), during (middle), and after (right) application of strychnine (B), picrotoxin (C), and gabazine (D), respectively. B, Cell is the same as in A. E–G, Effects of strychnine (E), picrotoxin (F), and gabazine (G) on the OMSI of standard DS (magenta), standard OMS (blue), OMS-DS (green), and unspecified cells (gray). OMSIs during drug application are plotted against the control, obtained before drug application. Arrows indicate the standard OMS cells from A–D, respectively. Data from the same experiments as in Figure 6.
This effect of strychnine could also be demonstrated with our multiple-patch stimulus of differentially or coherently jittering gratings. Under strychnine, the sample cell showed a strong reduction of object-motion sensitivity (Fig. 7B). Because our multiple-patch stimulus lets us more easily quantify object-motion sensitivity via the OMSI even for ganglion cells that are not in the center of the recording area, we performed further analyses with this stimulus. The population analysis showed that strychnine systematically reduced the OMSI (p < 10−5) and turned the originally bimodal distribution of the OMSI into a unimodal distribution centered near zero (Fig. 7E), consistent with the previously reported effect of strychnine on object-motion sensitivity.
Yet, we also found that blocking of GABAergic inhibition strongly affected object-motion sensitivity, as shown for two sample cells in the presence of picrotoxin (Fig. 7C) and gabazine (Fig. 7D). Population analysis revealed a substantial effect of the GABA blockers on object-motion sensitivity (p < 10−5; Fig. 7F,G), with OMSIs even more strongly reduced to a narrow, zero-centered distribution than during strychnine application. Thus, both glycinergic and GABAergic inhibition appear to be involved in regulating object-motion sensitivity, suggesting that the underlying circuitry for generating object-motion sensitivity in salamander might be more complex than previously assumed. Furthermore, standard OMS and OMS-DS cells revealed no difference in how their object-motion sensitivity was affected by pharmacology, thus providing no evidence for different mechanisms of suppression under global motion in these cell classes.
Standard DS and OMS-DS cells respond differently to composite motion stimuli
The dual sensitivity of OMS-DS cells to motion direction and local object motion suggests that these cells should respond well to small objects moving in the preferred direction. We therefore tested the cells' responses to small black spots, moving across the screen in different directions. We found that OMS-DS cells responded well to this stimulus (Fig. 8C), with similar direction tuning as for the drifting gratings (compare Fig. 8B). However, this did not distinguish OMS-DS cells from standard DS cells, which also responded well with directional tuning to the small moving spots (Fig. 8C).

Standard DS and OMS-DS cells respond differentially to global and local motion features. A–D, Responses of individual standard DS (middle) and OMS-DS cells (bottom) to different motion stimuli (top). A, Responses to coherent and differential motion of patches of jittering gratings. B–D, Polar plots of mean firing rates in response to drifting gratings (B), drifting spots (C), and a composite plaid stimulus (D). Arrows indicate preferred directions of the cells for each stimulus. DSI values indicate degree of direction selectivity for the respective stimuli. C, Standard DS and OMS-DS cells keep their directional tuning for moving spots compared with drifting gratings. D, Top, Plaid stimulus composed of two moving gratings, rotated by 120° with respect to each other, moving in different directions (cyan arrows). The composite plaid pattern moves into another direction (red arrow). Middle and bottom, Motion direction in the tuning-curve plots corresponds to the motion of the composite plaid pattern. Cyan and red dashed lines indicate tuning predictions for when the cells would respond to either the individual gratings (“component prediction,” cyan) or to the composite pattern (“pattern prediction,” red). E, Distribution of OMSI values for significantly pattern- or component-selective DS cells (see Materials and Methods). **Significance at the 1% level (Wilcoxon rank sum test). Data from 6 retinas with 115 DS cells; 30 and 15 cells were significantly pattern- or component-selective, respectively.
This raised the question of whether differences in object-motion sensitivity might be relevant for detecting motion direction for more complex motion stimuli, featuring a composition of object and global motion. To test this hypothesis, we applied a motion stimulus known from psychophysics as a plaid stimulus (Stoner et al., 1990; Castelo-Branco et al., 2002). It consists of two semitransparent gratings, crossing each other and separated in our case by 120°. Each grating moved with the same speed in a direction orthogonal to the orientation of the grating. The crucial aspect of this stimulus is that it can be interpreted either as a composition of the differentially moving bars or as a single, globally moving pattern whose motion direction is different from the directions of its two moving components. We thus hypothesized that a DS cell with preference for global patterns should respond most strongly when the pattern motion is aligned with the cell's preferred direction, whereas a DS cell with preference for object motion may be more strongly influenced by the motion directions of the individual bars.
Indeed, as shown by two sample cells in Figure 8D, standard DS cells displayed a motion tuning for the direction of the global plaid pattern very similar to the tuning obtained under drifting gratings, indicating that the relevant motion for these cells was the global motion of the fused gratings. The sample OMS-DS cells shown in Figure 8D, on the other hand, showed a more complex tuning pattern for the direction of the plaid pattern. The strongest responses did not occur when the fused pattern moved in the preferred direction of the cell, but rather when the pattern moved in such a way that one of its two components had a motion direction aligned with the cell's preferred direction. Thus, the individual motion components determined the cells' responses more strongly than the global stimulus pattern.
We then aimed at measuring for each cell whether its responses to the plaid stimulus corresponded either to detecting the motion direction of the global pattern or its components. To do so, we compared how well its tuning under the plaid stimulus was predicted either directly by the tuning to the drifting grating or by assuming that the cell responded in a directionally tuned fashion to either of the two components (see Materials and Methods), similar to analyses previously performed for cortical neurons (Movshon et al., 1985). Because in the retina, tuning to motion direction is often broad, pattern-based and component-based predictions of many cells were rather similar and did not allow distinguishing whether the responses better matched either of the two conditions. However, a subset of DS cells could be identified that had significant partial correlations with either the prediction obtained directly from the drifting grating (“pattern-selective”) or with the component-based prediction (“component-selective”). We found that these two groups indeed differed in their object-motion sensitivity (p = 0.005, Wilcoxon rank sum test). Pattern-selective DS cells had substantially smaller object-motion sensitivity indices than component-selective DS cells (Fig. 8E). This indicates that object-motion sensitivity in DS cells may aid the detection of object motion direction even in the presence of conflicting global motion.
Discussion
Analyzing motion signals in visual scenes appears to be among the central computational tasks of the early visual system. Two fundamental aspects of motion analysis are to detect the motion direction and to discern whether motion signals reflect movement of the observer or of an object in the outside world. We here showed that the salamander retina possesses three types of ganglion cells which encode specific aspects of this motion information (Fig. 1). In particular, we observed standard DS cells, which show preference for certain motion directions, and standard OMS cells, which are suppressed by coherent global motion while responding strongly to local or differential motion. The third identified type of ganglion cells with specific motion sensitivity combined these two stimulus selectivities. These OMS-DS cells displayed both direction selectivity and suppression under global motion signals, suggesting that the cells are of particular importance for detecting the motion direction of small objects. Several observations indicate that OMS-DS cells indeed constitute a distinct type of ganglion cells. First, OMS-DS cells have smaller receptive fields than standard DS cells and slower filter kinetics than standard OMS cells (Fig. 2). Second, OMS-DS cells have a different organization of preferred motion directions than standard DS cells (Fig. 3). And third, their receptive fields often overlap with receptive fields of standard DS cells (Fig. 4). For all three investigated cell types, the sensitivity for particular motion features depended on inhibitory mechanisms (Figs. 6, 7), although the involved inhibitory neurotransmitters did not hint at differences in mechanisms of direction selectivity or object-motion sensitivity between OMS-DS cells and standard DS or OMS cells, respectively.
Direction selectivity in the salamander retina
DS ganglion cells had previously been observed in the retinas of many species. Surprisingly, for the tiger salamander (Ambystoma tigrinum), one of the most commonly studied systems for functional investigations of the retina, detailed investigations of direction selectivity had been lacking, and analyses of functional classification of ganglion cell types had not found significant direction selectivity (Segev et al., 2006). An earlier report, however, had provided a few examples of DS responses in the tiger salamander retina and shown that further cells became direction selective under blockage of GABAb receptors in the retina (Pan and Slaughter, 1991).
In agreement with these earlier examples, we here found that pronounced direction selectivity can be observed in the closely related species of axolotl salamanders (Ambystoma mexicanum), another member of the genus of mole salamanders. Although we cannot exclude that there exists a species difference in the occurrence of DS ganglion cells, the otherwise strong similarity between the axolotl and tiger salamander retina lets us hypothesize that tiger salamanders should also possess two systems of DS ganglion cells, which may have been missed so far due to some combination of recording bias, stimulus selection, and developmental state of the animals. Indeed, we found that the DS cells analyzed here did not respond well to drifting gratings at high speeds. For a temporal frequency of 3 Hz, both standard DS and OMS-DS cells showed a substantial decrease in firing rate and a concomitant deterioration in the magnitude and reliability of direction selectivity (Fig. 5). Together with the overall rareness of DS ganglion cell, this may explain why earlier studies that had applied such fast gratings (Segev et al., 2006) may have missed direction selectivity in the salamander retina.
Our findings here suggest that direction selectivity, when measured in the appropriate range of stimulus parameters, may be a useful feature in studying functional types of ganglion cells also in the retina and may aid the efforts of cell-type specific analyses in this widely used model system (Fairhall et al., 2006; Segev et al., 2006; Bölinger and Gollisch, 2012; Marre et al., 2012; Asari and Meister, 2014; Liu and Gollisch, 2015; Wang et al., 2016).
Functional distinction of two types of DS cells
It seems likely that the two different types of DS cells observed here in the salamander retina serve different functions for the animal. Standard DS cells respond well to global motion signals and may therefore convey information about self-motion of the animal or its eye. The relatively large receptive fields of standard DS cells (Fig. 2D), allowing these cells to integrate motion signals over a wide area, corroborate their putative role in representing global motion. Further support for this functional hypothesis comes from the organization of preferred motion directions into three clusters, which approximately align with the relevant motion directions for the three semicircular canals in the vestibular system of the axolotl (Maddin and Sherratt, 2014). This indicates that the visual information contributed by standard DS cells serves to complement vestibular information about self-motion.
OMS-DS cells, on the other hand, appear particularly suited to report motion direction for small objects. The relatively small receptive fields (Fig. 2D) support the sensitivity to small objects, potentially representing prey. Indeed, DS cells that displayed preference for local motion signals showed strong directional tuning also to small drifting dark spots and were more sensitive to the individual motion components of a composite motion stimulus (Fig. 8). For tracking a moving object within a constantly moving scene, information about the object's current motion direction can improve the estimated position (Kalman, 1960; Faisal and Wolpert, 2009; Kwon et al., 2015), especially when it is occluded by another object for a short time period (Kristan et al., 2009). For example, in flies, the tracking of an object is less precise when the pathway that detects motion direction is blocked and only the information about the object's position is transmitted to downstream integration centers (Bahl et al., 2013).
Analogies and differences of motion processing in salamander and mammalian retina
The recently discovered W3 ganglion cells of the mouse are thought to provide a functional analog of the standard OMS cells in the salamander because of the strong suppression of W3 cells by peripheral motion (Zhang et al., 2012; Kim et al., 2015). Similarly, for the two systems of DS ganglion cells observed here in the salamander retina, we find correspondence with the systems of ON and ON-OFF DS cells of the mammalian retina. Like the standard DS cells investigated here, the mammalian ON DS cells also comprise three subtypes: one with preferred direction along the nasal-temporal axis and the other two with preferred directions rotated by 120° from that axis (Oyster and Barlow, 1967; Sun et al., 2006). Because of their tuning to slow velocities (Oyster, 1968; Wyatt and Day, 1975; Sivyer et al., 2010) and their projections to the accessory optic system (Simpson, 1984), ON DS cells are thought to be important for image stabilization by encoding the direction of slow full-field motion (Vaney et al., 2001; Dhande et al., 2013; Yonehara et al., 2016), analogous to the function hypothesized here for standard DS cells in the salamander retina. However, we did not find any strong velocity tuning for either type of DS cells analyzed here, as all cells responded well to a fairly broad range of velocities (Fig. 5), similar to DS cells in turtle retina (Ariel and Adolph, 1985). Substantial decreases in firing rate and direction tuning occurred for both cell types only at the largest tested temporal frequency of 3 Hz.
The salamander OMS-DS cells, on the other hand, might be the analog of the ON-OFF DS cells in mouse and rabbit, which have four subtypes with preferred directions separated by 90° (Oyster and Barlow, 1967; Weng et al., 2005; Briggman et al., 2011) and smaller receptive fields than ON DS cells (Barlow et al., 1964). In addition to the signals that mediate direction selectivity, ON-OFF DS cells receive suppressive signals from the receptive field periphery (Hoggarth et al., 2015). In rabbit retina, they have furthermore been found to be suppressed by coherent motion (Chiao and Masland, 2003; Ölveczky et al., 2003). The analogies between the standard DS and OMS-DS cells in salamander and the ON and ON-OFF DS cells in mouse and rabbit suggest that the separate, parallel processing of motion direction for global and local motion signals could be fairly universal across species.
Whether direction selectivity in the salamander and in the mammalian retina is computed via similar mechanisms remains an open question. In rabbit and mouse, the direction selectivity of ON and ON-OFF DS cells is mediated by GABAergic inhibition from starburst amacrine cells (Wyatt and Day, 1976; Fried et al., 2002; Taylor and Vaney, 2003; Weng et al., 2005; Briggman et al., 2011), and GABAergic inhibition also appears to be a critical component of generating direction selectivity in the salamander retina (Fig. 6). In the mammalian retina, this inhibition is provided by starburst amacrine cells, which are the only acetylcholine-releasing cells in the mammalian retina. Acetylcholine-releasing amacrine cells had also been found in the inner nuclear layer and in the ganglion cell layer of the salamander retina at similar depths as in the mammalian retina (Zhang and Wu, 2001). Thus, it seems feasible that the analogy of direction selectivity in the mammalian and salamander retina extends beyond the functional characteristics also to the mechanisms.
However, an interesting discrepancy to the ON and ON-OFF DS cells in mammals is that both types of DS cells observed here in the salamander retina are OFF-type. OFF-type DS cells have also been observed in retinas of frog and turtle (Bowling, 1980; Watanabe and Murakami, 1984; Ariel and Adolph, 1985). The OFF-type classification was evident in the responses both to the moving gratings (Fig. 1C–E) as well as to increments and decrements of light intensity (Fig. 2F) and was independent of the background light intensity over a considerable range (Fig. 2G). Thus, we here found a close functional analogy between specific ganglion cell types in the mammalian and salamander retina despite differences in the basic property of preferred contrast polarity. This raises interesting questions about the evolutionary origin of direction selectivity in the retina, but it should be seen in light of the fact that the salamander retina is generally dominated by OFF-type cells (Burkhardt and Fahey, 1998; Segev et al., 2006; Marre et al., 2012).
Footnotes
This work was supported by Dorothea Schlözer Programme of Georg-August University Göttingen, by Deutsche Forschungsgemeinschaft (Grant GO 1408/2-1 and Collaborative Research Center 889,C1), and by European Union Seventh Framework Programme FP7-ICT-2011.9.11 under Grant 600954 (“VISUALISE”).
The authors declare no competing financial interests.
- Correspondence should be addressed to Dr. Tim Gollisch, University Medical Center Göttingen, Department of Ophthalmology, Waldweg 33, 37073 Göttingen, Germany. tim.gollisch{at}med.uni-goettingen.de


