

Abstract
A unifying function associated with the default mode network (DMN), which is more active during rest than under active task conditions, has been difficult to define. The DMN is activated during monitoring the external world for unexpected events, as a sentinel, and when humans are engaged in high-level internally focused tasks. The existence of DMN correlates in other species, such as mice, challenge the idea that internally focused, high-level cognitive operations, such as introspection, autobiographical memory retrieval, planning the future, and predicting someone else's thoughts, are evolutionarily preserved defining properties of the DMN. A recent human study demonstrated that demanding cognitive shifts could recruit the DMN, yet it is unknown whether this holds for nonhuman species. Therefore, we tested whether large changes in cognitive context would recruit DMN regions in female and male nonhuman primates. Such changes were measured as displacements of spatial attentional weights based on internal rules of relevance (spatial shifts) compared with maintaining attentional weights at the same location (stay events). Using fMRI in macaques, we detected that a cortical network, activated during shifts, largely overlapped with the DMN. Moreover, fMRI time courses sampled from independently defined DMN foci showed significant shift selectivity during the demanding attention task. Finally, functional clustering based on independent resting state data revealed that DMN and shift regions clustered conjointly, whereas regions activated during the stay events clustered apart. We therefore propose that cognitive shifting in primates generally recruits DMN regions. This might explain a breakdown of the DMN in many neurological diseases characterized by declined cognitive flexibility.
SIGNIFICANCE STATEMENT Activation of the human default mode network (DMN) can be measured with fMRI when subjects shift thoughts between high-level internally directed cognitive states, when thinking about the self, the perspective of others, when imagining future and past events, and during mind wandering. Furthermore, the DMN is activated as a sentinel, monitoring the environment for unexpected events. Arguably, these cognitive processes have in common fast and substantial changes in cognitive context. As DMN activity has also been reported in nonhuman species, we tested whether shifts in spatial attention activated the monkey DMN. Core monkey DMN and shift-selective regions shared several functional properties, indicating that cognitive shifting, in general, might constitute one of the evolutionarily preserved functions of the DMN.
Introduction
The human default mode network (DMN) consistently decreases its activity during task performance, compared with rest (Shulman et al., 1997; Raichle et al., 2001). Furthermore, the DMN is activated during a number of high-level internally directed cognitive processes, such as autobiographical memory retrieval, planning the future, imagining the perspectives of others, or even daydreaming (Buckner and Carroll, 2007; Mason et al., 2007; Buckner et al., 2008; Spreng et al., 2008; Andrews-Hanna et al., 2010). Reduced DMN activity has also been correlated with improved task performance and memory encoding (Otten and Rugg, 2001; Daselaar et al., 2004; Li et al., 2007). On the other hand, the DMN has been implicated in monitoring the external world for unexpected events, exhibiting a broad low-level focus of attention (Buckner et al., 2008). This is in line with studies where the recruitment of DMN regions correlated with faster reaction times following unexpected target events (Gilbert et al., 2006; Hahn et al., 2007; Sadaghiani et al., 2009). However, DMN correlates were reported also in other species, including mice (Rilling et al., 2007; Vincent et al., 2007; Mantini et al., 2011; Lu et al., 2012; Stafford et al., 2014), challenging the idea that the above listed internally focused, high-level cognitive operations are the main evolutionarily preserved defining property of the nonhuman DMN. Key characteristics of neurological and psychiatric diseases, such as Alzheimer's disease, schizophrenia, depression, and autism, may be instrumental in helping resolve this conundrum. First, core nodes of the DMN are affected at disease onset (Leech and Sharp, 2014; Utevsky et al., 2014). Second, a common symptom of patients suffering from these diverse pathologies is the breakdown of cognitive-shifting abilities, a property that is critically important in everyday life (Perry and Hodges, 1999; Berger et al., 2003; Reichenberg and Harvey, 2007; Waltz et al., 2013). Moreover, it has recently been shown that high-level executive control requiring major revisions of cognitive context significantly activated human DMN regions (Crittenden et al., 2015). To test the generality of the latter finding, we hypothesized that mental-shifting operations between series of internal thoughts or memories (e.g., during autobiographical memory, mind wandering, imaging the future, or theory-of-mind like operations), but also shifts during the passive and seemingly indifferent observation of the environment, might constitute one of the evolutionarily preserved functioning principles of the DMN. If true, the DMN should be more active during conditions requiring more shifting operations compared with conditions with fewer shifts, and critically important, also in nonhuman species. Therefore, we aimed to study monkey DMN functions by experimentally controlling cognitive shifts using a selective covert spatial attention task. Large rule-driven changes in attentional context (shift events) consisted of the reallocation of attentional weights in space and were compared with small changes when attentional weights were maintained at the same location (stay events). This comparison was done in analogy to a recent human study during which sufficiently large as opposed to small changes in cognitive context recruited DMN regions (Crittenden et al., 2015). First, we aimed to investigate to which degree shift and stay selective activations in monkeys differed in their spatial overlap with the DMN. Therefore, the DMN was characterized using four complementary methods and compared with cortical regions engaged during attention conditions, requiring large attentional shifts compared with very similar task conditions requiring comparably small shifts. Specifically, we scanned 3 monkeys (Vanduffel et al., 2001) with a challenging covert spatial attention task (Caspari et al., 2015) previously used in humans to identify attentional shifting areas in the superior parietal lobule (Molenberghs et al., 2007). We predicted that attentional l shifting, as opposed to sustained contralateral attention during the same task, would activate areas coinciding with the DMN.
Materials and Methods
Animal care and experimental procedures were performed in accordance with the National Institute of Health's Guide for the care and use of laboratory animals, European legislation (Directive 2010/63/EU) and were approved by the Ethical Committee of KU Leuven. The details of the general fMRI procedures and training of monkeys have been described previously (Vanduffel et al., 2001; Nelissen et al., 2005). The attention data have been described in detail previously (Caspari et al., 2015).
Subjects and training
Three rhesus monkeys, including 2 females (M13, M24, and M35; Macaca mulatta; 3–6 kg; 3–9 years of age) participated in the experiments. Whereas M24 and M35 participated only in the present experiment, M13 was a subject in previous fMRI experiments (fixation, free viewing, auditory, and saccade tasks). Animal housing and handling were in accordance with the recommendations of the Weatherall report, allowing locomotor behavior, social interactions, and foraging. All animals were group-housed (cage size at least 16–32 m3) with cage enrichment (toys, foraging devices) at the primate facility of the KU Leuven Medical School. They were fed daily with standard primate chow supplemented with bread, nuts, raisins, prunes, and fruits. The monkeys were exposed to natural light conditions, with additionally 12 h of artificial light throughout the year, independent of the season. The animals received their daily water supply during the experiments until satiated.
Monkeys were trained daily, during the normal light-on period for several hours, in a mockup of an MRI scanner for all tasks. They were scanned following several months (∼4) of training, when fixation performance exceeded 90%–95%, and when false-alarm rates were close to 0%. The monkey sat in a sphinx position, head fixed to the plastic monkey chair, directly facing the screen. Eye positions were monitored at 120 Hz, using pupil position and corneal reflection (Iscan).
Monkey fMRI
Contrast-agent-enhanced functional images (Vanduffel et al., 2001; Leite et al., 2002) were acquired with a 3.0 tesla horizontal bore full-body scanner (TIM Trio; Siemens Healthcare). The same data were used as in Caspari et al. (2015) and Caspari et al. (2017) for describing the attentional shift network in monkeys, however completely outside the context of the DMN. All other data are novel. Using a gradient-echo T2*-weighted EPI sequence, we acquired data for the (1) selective attention task [40 horizontal slices; TR, 2 s; TE, 17 ms (M13, M24), 19 ms (M35); 1.25 × 1.25 × 1.25 mm3 isotropic voxels, image acceleration factor of 3 (M13, M24), or 2 (M35)] and (2) the resting state scans used for the functional connectivity analyses [36 horizontal slices; TR of 1.4 s; TE, 16 ms; 1.25 × 1.25 × 1.25 mm3 isotropic voxels, image acceleration factor of 3 (M13, M24), or 2 (M35)]. M13 was scanned with a custom-built, eight-channel phased-array receiver coil, and a saddle-shaped, radial transmit-only surface coil (Kolster et al., 2009). M24 and M35 had been implanted with 8- and 5-channel receiver coil arrays, respectively, mounted on top of the skull, beneath the headpost, improving sensitivity for MRI (Janssens et al., 2012). Temporal signal-to-noise (tSNR) calculations of the dorsal half of the brain covering the regions of interest (ROIs) clearly showed the benefit of implanted higher-channel coils: M13 (8 channel external): tSNR = 46.24, M24 (8 channel implant): tSNR = 140.14. M35 (5 channel implant): tSNR = 63.50. Scanning of M24 was performed with the same scanner, main parameters, and transmit coil as with M13, but with the addition of a 36 cm inner-diameter head gradient set (AC88, maximum strength: 80 mT/m; maximum slew rate: 800 T/m/s). The resting state scans of M35 were also performed with the AC88 (to reach the same parameters as for M13/M24 with the 5-channel implant coils). Slices were oriented transversally, covering the entire brain. As MION (Sinerem; Laboratoire Guerbet,or Feraheme) measurements depended only on blood volume (Mandeville and Marota, 1999), all signal values have been inverted.
The main selective-attention task was scanned using an event-related design, and a run lasted 610 s (305 volumes, including 4 dummy volumes). The localizer experiment to assess the stimulus representation was scanned with a block design with the same parameters as the selective attention experiment, a run lasting 490 s (245 volumes, including 4 dummy volumes), as described above. The resting-state scans were acquired at a different date after the selective attention and localizer experiments, subjects awake while fixating, with runs lasting 590.8 s (422 volumes, including 4 dummy volumes).
High-resolution anatomical images were acquired for each monkey in separate scan sessions under anesthesia, using a single radial transmit-receive surface coil and an MPRAGE sequence (TR, 2200 ms; TE, 4.05 ms; 208 slices; 0.4 mm isotropic voxel size).
Stimuli and tasks
For the selective-attention task, the experimental setup was adapted from the human experiment performed by Molenberghs et al. (2007), exactly as used by Caspari et al. (2015). Two stimuli occupied opposite locations to the left and right of center and on the horizontal meridian at 9.25 degrees eccentricity (Fig. 1I). There were two possible linked stimulus pairs: a square with a triangle or a circle with a diamond. All stimuli were white on a black background and matched in area (1.59 deg2). Each stimulus pair contained a relevant and an irrelevant stimulus. Monkeys were extensively trained to distinguish relevant from irrelevant shapes. When the relevant, but not the irrelevant, shape dimmed (e.g., the square or the circle), the monkey had to respond by manually interrupting a light beam to receive a liquid reward. Monkeys thus covertly displaced or maintained their attentional focus together with the relevant stimuli in a rule-based manner. The allocation of attention was probed by the randomly inserted dimming events. The dimmings (100 ms) were rare (14% of relevant and of irrelevant stimuli) with the luminance contrast (gray level) set at detection threshold. M13 and M24 responded during 50% of all scan sessions with the right hand and to the other half with the left, M35 with the left hand only.

Stimuli and task used to measure covert spatial attention shifts. Top, Schematic of display viewed by the monkey. One of the two stimulus pairs (each consisting of a relevant and an irrelevant shape) was presented at any given time while the monkey fixated within a 2 × 3 degree fixation window. Top left, Dimming of the relevant shapes had to be indicated by a manual response to receive a juice reward. Top right, Dimming of the irrelevant shapes had to be ignored. Each pair was replaced, with no temporal gap, by the succeeding pair after 2250 ms, resulting in a shift (I, III), stay (II, IV), or null (V, null left) event. The monkey's attention was locked to the relevant stimulus (square or circle) and shifted (or stayed) with it during consecutive stimulus displays.
The sustained attention baseline was transiently interrupted by one of two event types consisting of a replacement (without temporal gaps) of one stimulus pair by another after 2250 ms, occupying the same two positions. In the first event type (Fig. 1I,III), the relevant stimulus of the new pair appeared at the position previously occupied by the irrelevant stimulus of the preceding pair, and vice versa. This feature change, in altering the position of the relevant stimulus, elicited a shift in spatial attention (shift event). A “shift-right” event (Fig. 1I) corresponded to a spatial shift of the relevant stimulus from the left to the right hemifield, and a “shift-left” (Fig. 1III) to a spatial shift from right to left.
In event Type 2 (Fig. 1II,IV), the relevant stimulus of the new pair appeared at the same position as the relevant stimulus of the preceding pair. Hence, the relevant stimulus site remained unchanged, inducing no spatial shift in attention. This was called a stay event: “stay-right” (Fig. 1II) or “stay-left” (Fig. 1IV). With this event, attention was already deployed to the target location before the feature change (event onset). One-third of all trials were null events (Fig. 1V, “null left”). During these events, the stimuli remained on the screen without being changed. Each run contained an equal number of shift, stay, and null events. The positions occupied by the stimuli, as well as the number of relevant and irrelevant dimming events, were matched across event types. Dimmings were equally distributed between 50 and 1500 ms after event onset and temporally dissociated from the actual events of interest: the stay, shift, and null events. Importantly, relevant and irrelevant dimming trials used to probe the allocation of attention were rare (14% of the trials). During task performance, eye movements, reaction times, hits, misses, and false alarms were measured and have been reported by Caspari et al. (2015).
During the localizer and resting state, scans monkeys were awake and rewarded for fixation on a red square (0.3 × 0.35 visual degrees) in the center of the screen.
fMRI data analysis
Preprocessing.
The raw EPI images were corrected for the lowest-order off-resonance effects and aligned with respect to the GRE reference images before performing a SENSE image reconstruction (Pruessmann et al., 1999). Residual N/2 artifacts in the reconstructed images were removed using an algorithm based on the UNFOLD method (Madore et al., 1999) and were further corrected for higher-order distortions using a nonrigid slice-by-slice distortion correction (Kolster et al., 2009). Subsequent data analysis was performed with the SPM5 software package (http://www.fil.ion.ucl.ac.uk/spm), running under MATLAB (The MathWorks). The functional image time series were preprocessed to compensate for slice-dependent time shifts, motion corrected within and across sessions, and linearly detrended, then coregistered to the anatomical image, and finally spatially normalized to the 112RM template (McLaren et al., 2009) aligned to the F99 surface-based atlas (Van Essen et al., 2001), with a voxel size of 1 × 1 × 1 mm. Images were smoothed with a 1.5 mm kernel.
Data analysis of main experiment (event-related).
The following events entered the GLM: stay events, composed of a feature change (Fig. 1II, stay-right, IV, stay-left); shift events, composed of a feature change and a spatial shift (Fig. 1I, shift-right, III, shift-left); and null events (Fig. 1V, null left, no feature change). An equal number of null-left and null-right events constituted the attention baseline. The number of correctly executed trials analyzed for each event type was equalized for left- and right-sided attention. Only trial sequences with at least 3 or more consecutive and correctly executed fixation trials were included in the analysis. The dimming and reward events within these series of correctly executed fixation trials were excluded from the analyses. The GLM included 5 regressors for the five conditions, 2 eye movement regressors, and 6 additional head motion regressors (translation and rotation in 3D), per run. Each condition was modeled by convolving a Gamma function (delta = 0, tau = 8, and exponent = 0.3), modeling the MION hemodynamic response function, at the onset of the condition (transition of stimulus displays). The first two main contrasts of interest were stay-left versus stay-right (contrast 1) and vice versa (contrast 2). These delineated areas reflecting the current locus of attention and will be deemed “contralateral stay,” relative to the observed hemisphere.
Activations correlating with “transient” spatial attention shifts regardless of the direction of the shift were visualized by contrasting bilateral “shifts” versus “stay” (shift-left and shift-right vs stay-left and stay-right, contrast 3).
Data were first analyzed per subject and scanning day (session) with a fixed-effects GLM. Runs with fixation performances <85% were excluded. For M13, this resulted in 9 sessions with a total of 131 runs (an average of 15 runs/session), for M24, 12 sessions with a total of 181 runs (an average of 15 runs/ session), and for M35, 10 sessions with a total of 171 runs (averaging 17 runs/ session) that were included in the analyses. Next, we computed a session-wise second-level mixed-effect analysis (MFX) (Friston et al., 2005), with the “con-images” of contrasts 1–3, obtained from the first level analyses as input, including a total of 31 images per contrast [9 (M13) +12 (M24) +10 (M35) sessions]. All statistical maps were based on this MFX analysis and were shown at a threshold of p = 0.01, both uncorrected. The relatively low threshold for the shifting contrast was justified since we had a clear a priori hypothesis concerning superior parietal involvement (Caspari et al., 2015). Second, to compute raw time courses for the group, we performed a group fixed-effects analysis (FFX). This was done by selecting the best 69 runs of each animal based on behavioral performance (percent fixation and response-performance), analyzed in group space. These 207 runs were pooled for the FFX analysis, and the final contrasts (same as used in the MFX analysis) were thresholded at familywise error (FWE, p < 0.05). This procedure was performed to extract time courses and beta values for only those clusters reaching the above-mentioned threshold in the statistically more stringent MFX analysis. Importantly, all reported ROIs of the MFX analysis were also present in the corresponding contrasts at FWE correction of the group FFX.
Finally, FFX analyses were performed in each single subject for the event-related task, and the corresponding contrasts (1–3) were thresholded at p < 0.0001 for M24 and M35, and at p < 0.001 in M13; because of lower SNR, as it was scanned without implant coils (Janssens et al., 2012).
A cluster extent threshold of 10 voxels was applied to all volume maps.
Analysis of stimulus localizer data (block design) to define “DMN fixation versus visual.”
The data from the stimulus localizer experiment were preprocessed and analyzed the same way as the event-related data of the main experiment, using a GLM. Data were first subjected to session-wise FFX analyses for each animal: 2 scanning days per monkey, M13: 26 runs, M24: 35 runs, M35: 44 runs. The onset of each condition (1, red fixation dot only, “stimulus OFF” or “stimulus ON” conditions; 2, bilateral; 3, unilateral left; 4, unilateral right stimulus display) was modeled over the entire 20 s block extent. The FFX t maps used to calculate the single monkey and group “task-related deactivations” (DMN Fixation vs Visual) were obtained by contrasting the fixation-only condition (1) with all the “stimulus ON conditions” (2–4), and thresholded at FWE (p = 0.05) correction in the group and the single subjects. In M13 (scanned without implant coils), blocked design localizer maps were thresholded at p < 0.0001 uncorrected.
Analysis of the resting state data.
We acquired two sessions of resting state scans per monkey and included all runs with a minimal fixation performance of 87%: M13: 16 runs (1), 19 runs (2); M24: 19 runs (1), 17 runs (2); M35: 20 runs (1), 20 runs (2).
Independent component analysis (ICA) to define “DMNic.”
Spatial ICA extracts maximally independent patterns of coherent fMRI activity (Calhoun et al., 2001), and was applied to the datasets of the group (2 sessions per monkey), and for each single monkey by means of the GIFT toolbox. The estimation of the number of independent components (ICs) was performed using the minimum description-length criterion (Calhoun et al., 2001). As we were interested only in determining the DMN component for the group and in each subject, we set the number of components to be estimated to 20, thus approximating model orders commonly used in human studies of large-scale brain networks (Calhoun et al., 2001; Smith et al., 2009; Abou-Elseoud et al., 2010). After reduction of dimensionality by means of principal component analysis (accounting for at least 99.99% explained variance), ICs were retrieved by means of the fast ICA algorithm, with a deflation approach and hyperbolic tangent (tanh) nonlinearity (Esposito et al., 2005; Mantini et al., 2013). Component time courses and spatial maps for each session were then back-reconstructed using the aggregate components and the results from the data reduction step (Calhoun et al., 2001). To quantify the reliability of the decomposition, ICA was reiterated 10 times using the ICASSO toolbox (Himberg et al., 2004), resulting in a stability index. Stability indices for each estimate-cluster approaching 1 would indicate a close-to-orthogonal and highly consistent component, stable across multiple ICA runs. All the ICs obtained were scaled to empirically derived z scores (dividing by the SD of the original time course), representing the correlation strength of each voxel and the associated component. Applying the spatial correlation sorting option in GIFT (Correa et al., 2007) with respect to the mask of the model monkey DMN as reported by Mantini et al. (2011) (defined from a task-related deactivation meta-analysis in 10 monkeys, the hallmark of the DMN), we selected the best matching DMN component in the group and each single animal, which we called “DMN task” (or “DMNt”) throughout the paper. Two components (one that overlapped well with frontal cortex and one that overlapped with parietal cortex) were selected for the frontal-parietal network. A minimal z score of 1 was used as the lower limit threshold for the functional connectivity (Hutchison et al., 2011).
Seeding to define “DMNseed.”
The resting-state data were additionally preprocessed in preparation for functional connectivity analysis, according to previously described procedures (Vincent et al., 2007; Mantini et al., 2011), and will only be described briefly. The processing steps included (1) bandpass filtering (between 0.0025 and 0.05 Hz); (2) regression of white matter and ventricle signals, and their first derivatives; and (3) regression of 3D motion parameters, and their first derivatives. “DMNseed” was defined by placing 2 mm midline spherical seed in the posterior cingulate cortex (PCC) (areas 23/31, coordinate 0–25 10 in RM112 in F99 space aligned to the anterior commissure). This location was chosen to minimize confounds due to differential seed selection (Margulies et al., 2009; Hutchison and Everling, 2012). The average time course signal in the ROI was obtained (across voxels), and a whole brain connectivity map was created and converted to z scores by the Fisher's r-to-z transformation (Zar, 1998), correcting the degrees of freedom for the autocorrelation in the time series (Shumway and Stoffer, 2006). A FFX across all runs (of the group or of each single monkey) was used to create group-level or single-subject correlation maps (Genest, 1992), and thresholded at FWE correction (p = 0.05).
Correlation analysis and hierarchical clustering.
Following the same statistical approach as described above (Seeding to define “DMNseed”), Z score maps were then back-converted to correlation maps by the Fisher's z-to-r transform (Zar, 1998), and plotted. A correlation matrix between the ROI time courses was calculated with the seeds (2 mm spheres around the local maxima) of (1) DMNic, (2) DMNt, (3) all shift, and all stay (4) ROIs (3 and 4 were described by Caspari et al., 2015). Seeds were chosen according to positions of overlap of the 3 DMN definitions as seen in Figure 4A [areas PGm/31/V6A, left and right PO/V6, bilateral posterior superior temporal sulcus (STS) regions termed caudal temporal parietal occipital (TPOC), and caudal area 46, as well as the frontal eye field (FEF), where the activation was present in the volume of DMNic], excluding the overlap in the calcarine (most ventral part on the flat map; see Fig. 4A), and listed in Table 1. Significances in the average correlation matrices were calculated based on the statistics of the session-wise MFX (2 sessions per subject, with a total of 6). Thus, each session was treated as a separate subject and significance threshold was a set to p < 0.001.
Local maxima and origin of ROIs entering the cross-correlation matrix and dendrograma
Next, to visualize the unsupervised clustering of all the ROIs of the three different networks (default mode, shift, and stay) based on their functional correlation values, we applied hierarchical cluster analysis using the average linkage algorithm (Everitt et al., 2001; Mantini et al., 2011).
Surface-based projections.
For visualization on flat maps or inflated brains, the resulting t maps from the MFX analyses were projected onto the macaque F99 brain (Van Essen, 2004). Flat maps were created using FreeSurfer (http://surfer.nmr.mgh.harvard.edu/). All surface maps where thresholded at a minimal surface area extent of 30 mm2 (http://surfer.nmr.mgh.harvard.edu/fswiki/mri_surfcluster).
Definition of anatomical labels.
The anatomical labels used to designate the positions of our activations on inflated F99-brain surfaces were derived from three independent sources. Area labels for V1, V2, V3, V4, V4A, PITd, PITv, and area MT were derived from previous retinotopy experiments, combining data from 5 monkeys (probability maps of 50% overlap, including M13 and M24) (Janssens et al., 2014). Lateral intraparietal (LIP) (pooled LIPa and LIPi), FEF, areas 11, 12, 45, 46, and V6A were based upon Nelissen et al. (2011) and on the template anatomy of M12 (Ekstrom et al., 2009), and were warped to the F99 surface using the FreeSurfer surface-to-surface registration algorithm. Activations not falling into any of those atlases were defined anatomically with the aid of the monkey atlas of Paxinos et al. (2008).
ROI and raw time course analysis.
The MFX did not allow us to extract raw time courses. Raw time courses were therefore computed using data from an FFX (Friston et al., 1995; Caspari et al., 2015) using the best 69 runs, as determined behaviorally (% fixation, % misses), from each of the 3 animals, resulting in a total of 207 runs normalized to the template. Only ROIs/activations that were present in the contrasts of the FFX analysis at FWE (p = 0.05, correcting for multiple comparisons) and at the same time in the more stringent corresponding MFX contrasts (as defined above) were reported (Caspari et al., 2015). Functional ROIs were defined as 2 mm spheres around the local maxima derived from FFX (within a mean vector distance of 1.6 ± 0.7 mm, ± SD, from the MFX local maximum). Percent signal change was calculated for these ROIs with the fMRI signal extracted and averaged across all voxels of the 2 mm sphere. The raw signal was then high-pass filtered (256 s), and an independent baseline was determined for each data point (TR) by calculating the moving average of the raw fMRI signal in a sliding window of ±50 data points (±100 s) (Cui et al., 2009; Arsenault et al., 2013; Caspari et al., 2015). Trials per condition were then aligned at time point zero and peristimulus time histograms were computed for each MRI run. Time courses were plotted in two ways: (1) against the sustained attention baseline (represented by the null events); and (2) against the running average baseline. Also, we computed the average time course of all ROIs listed in Table 1, averaging per time point and condition across either all ROIs of the default mode (DMNt, DMNic), all ROIs of the shift, or all ROIs of the stay left or the stay right networks (within the respective hemisphere activated for contralateral attention). The correlation coefficient was calculated comparing the average time courses per time point and condition across DMN and shift ROIs, DMN and both stay left and right ROIs. The p value was computed with a t statistic. To characterize the activity of the raw average DMN ROI-time course, we calculated a two-way repeated-measures ANOVA on the PSC with factors (1) shift versus stay, and (2) left versus right (Caspari et al., 2015) using STATISTICA version 12 (StatSoft 2014; www.statsoft.com).
Definition of overlap: shift voxels and DMN voxels. The DMN activation map (blue), consisting of a meta-analysis of 15 experiments (N = 15) (including 10 subjects, 9 male, 1 female which corresponded to M13), compares the fixation condition versus active task (visual, attention, action-observation, auditory) (Mantini et al., 2011). This consensus map was thresholded at N = 8, saved as a mask, rigidly aligned with the F99 brain used for segmentation in Freesurfer, and then projected onto the gray matter surface (flat map and inflated views) together with the MFX t map contrasts “shift versus stay” (hot color) and “contralateral stay” (green transparent color). Surface ROIs were defined in FreeSurfer (http://surfer.nmr.mgh.harvard.edu/), and the percent overlap of shift/stay voxels with the DMN (including gray matter voxels only) was calculated relative to the total number of shift/stay voxels, respectively. To generalize our results to other existing DMN definitions in monkey, this calculation was also performed with respect to DMNic, DMNseed, and DMN Fixation versus Visual. We also tested whether the measured overlap between the shift/stay networks and the DMN differed from an overlap based on a random distribution of shift/stay selective voxels. Therefore, we randomly shuffled (1000×) the location of the shift and stay voxels along the cortical sheet, and calculated each time the overlap with the four DMN definitions. We normalized the values by the total number of shift or stay selective voxels to calculate the fraction of shift and stay voxels that overlap by chance within the DMN. p values were calculated by determining how often the observed (nonshuffled) percent overlap would be obtained by chance.
Results
Importantly, attention-related changes during shift and stay events were temporally dissociated from the rarely occurring dimming events used to measure behavioral compliance. Eye movements, reaction times, hits, misses and false alarms have previously been reported (Caspari et al., 2015) and are summarized in Table 2.
Monkey behavior: reaction times (RTs), hits, and missesa
Topological comparison of DMN, shift, and stay networks
We specifically wanted to compare fMRI activity during periods requiring many versus few cognitive shifts, which can be captured by contrasting activations induced by shift and stay events during a covert spatial attention tasks. Specifically, shift-sensitive activations were defined by contrasting bilateral shift (shift left and shift right) with stay events (stay left and stay right) (Fig. 2, hot colors). Both events were visually matched and differed only with respect to the spatial reallocation of attentional weights during the cognitive shift event. More widespread shift-selective activations (shift vs stay) were observed in posterior parietal cortex, caudomedial occipital cortex (cmoc) and the most caudal tip of the STS: that is, the caudal temporal parietal occipital area TPOC. Additionally, small frontal foci, including subcompartments of areas 46, F6, 11, 12, and anterior cingulate cortex, were bilaterally activated. Overall, the shift activations were spatially segregated from stay-selective activations (defined by the contrasts stay left vs stay right and vice versa), predominantly located in lateral occipital and ventral temporal cortex (Fig. 2, green).

Shift and contralateral modulation of attention compared with the monkey DMN. Inflated (bottom, medial-parietal and lateral view) and flattened (top) surfaces of the F99 monkey brain showing data of the mixed-effects group analysis (3 monkeys), for shifting (hot color, with scalebar) and contralateral attention (green transparent color), both compared with the probabilistic monkey DMN (blue) (Mantini et al., 2011). Task-related data are shown at uncorrected level (MFX) but are present at corrected level (FWE, p < 0.05) in the FFX. Numbers indicate percent overlap of voxels activated for shifting (red box), and contralateral attention (green box), with the DMN (LH and RH). Retinotopic outlines (white, 0.25°–12.25° eccentricity) are from Janssens et al. (2014). D, Dorsal; A, anterior; V, ventral; P, posterior. Sulci: i.p., Intraparietal; c, central; st, superior temporal. PP, Posterior parietal; apcs, anterior principal sulcus; PITd/v, posterior inferotemporal dorsal/ventral.
Next, we compared shift-selective activations with the monkey DMN, using a meta-analysis of task-specific deactivations across 15 monkey experiments (Mantini et al., 2011) (Fig. 2, blue). Specifically, in 10 animals, we contrasted rest with active task conditions, the original definition of the DMN (Raichle et al., 2001; Hutchison and Everling, 2012). A high overlap between shift-selective and DMN voxels was observed (left hemisphere [LH], 51%; right hemisphere [RH], 57.8%; Fig. 2, hot color and blue overlay), in contrast to a very small overlap between voxels activated for sustained contralateral attention and DMN voxels (LH, 5.2%; RH, 8.3%; Fig. 2, green and blue overlay). The strongest overlap was located in caudomedial and parietal cortex and the posterior tip of the STS (TPOC). Specifically, in frontal cortex, the overlap between shift and DMN voxels was less complete, or partially merged with stay selective voxels. In bilateral area 46, stay, shift, and DMN regions abutted, whereas they largely overlapped in ACC, and on the lateral and medial banks of the intraparietal sulcus.
Raw fMRI time courses of DMN, shift, and stay networks
The hallmark of the DMN is its higher activity level during rest compared with active tasks, as also shown by single-cell recordings in monkey (Hayden et al., 2009). How then can the current results be reconciled with shift-selective activations in posterior parietal cortex showing increased activity levels relative to baseline (null events)? These apparent discrepancies may be explained by the type of baseline used to determine “activations”. Instead of using the more traditional manner of plotting activity data against a baseline condition (null events in the present experiment, which indeed also require significant attentional deployment; Fig. 3B,D), the raw time courses were evaluated against a baseline moving average (sliding window of ± 50 data points, i.e., ± 100 s, see ROI and raw time course analysis) with respect to the target event (Cui et al., 2009; Arsenault et al., 2013; Caspari et al., 2015) (Fig. 3C,E, for shift and stay ROIs, respectively). This approach has the advantage that it displays the raw time course of all conditions without any preassumptions about a baseline condition, hence the “real” fMRI signal after general detrending. Plotting all conditions against the baseline moving average revealed a clear pattern of deactivation for all conditions in all shift-selective foci as seen for the examples in Figure 3C (posterior parietal cortex and area 46), and the average time course of all shift ROIs (Fig. 3G). Critically, this pattern did not emerge in any of the areas selectively activated for sustained contralateral attention, as shown for example areas TEAm and 45 in Figure 3D, E, and for all areas coding stay-left (right hemisphere, Fig. 3I) and stay-right (left hemisphere, Fig. 3J).

Raw time courses of shift, stay, and DMN ROIs. A, F, Coronal sections with activations of the group (n = 3) for shift versus stay (A, same as hot color in Fig. 2), and stay left versus stay right (F, hot color same as green in RH in Fig. 2) are shown in F99 space. Data are from the group mixed-effects analyses (n = 3). B–E, Raw time courses of these example shift (B, C) and stay (D, E) ROIs. G–J, Average time courses are plotted for all shift (G), stay (I, J), and DMN ROIs (H). All ROIs are listed in Table 1. Figure represents percent MR signal change of each condition against a sustained attention baseline (B, D) compared with a moving average baseline (C, E, G–J), at the respective local maxima (2 mm sphere). Dotted lines indicate event onset. Raw time courses are extracted from an equal number of runs across animals (n = 3, FFX). Error bars indicate the SEM across trials. H, Shifts were significantly different from stay events (F(1,11) = 112.8). *p < 0.0001 (repeated-measures ANOVA). Shifts (shift, stay) × (left/right), summarized by the bar plot inset representing data values at 4 s, and the respective SEs across ROIs. Shift left and shift right were also significantly different from the null events/baseline (p < 0.005, paired t test).
In the shift-selective foci, however, the shift conditions showed significantly smaller deactivations than all other conditions, explaining the shift selectivity of these voxels (Fig. 3C, especially G). Second, this way of displaying the raw data also revealed that all conditions on average peaked at 0 ms in the shift-selective foci (Fig. 3G), similar to the DMN foci (Fig. 3H), but not in the stay-selective foci (Fig. 3I,J). This peak represents the time point of the expected stimulus change (feature change) in two-thirds of all trials (i.e., the shift and the stay, but not the null events). Consequently, this signal was not condition specific but inherent to the regularity of the trial structure in this experiment, where conditions changed every 2250 ms on average. When comparing the raw time courses against the moving average baseline (Fig. 3H) within all DMN ROIs (as listed in Table 1), this confirmed the overall deactivation pattern. Remarkably, these completely independently defined DMN-ROIs showed less deactivation for the shift compared with the stay conditions at 4 s after a stimulus change (Fig. 3H, bar plot inset; F(1,11) = 112.8; p < 0.0001, 2 × 2 ANOVA with factors conditions (shift, stay) × direction of attention (left, right)). Thus, the DMN ROIs were shift-selective. Finally, to estimate the similarity of the average raw time course patterns of shift and DMN ROIs (Fig. 3G,H), we computed the cross-correlation of both patterns across all conditions and time points. Shift and DMN time course patterns showed a high cross-correlation (Rshift/DMN = 0.86, p < 0.0001, t test); this was not the case for the stay ROIs (RDMN/stayL = 0.029, p = 0.83; RDMN/stayR = 0.17, p = 0.20). This result cannot be explained by the general autocorrelation of the raw time course signal as the latter should be equally present across shift, stay, and DMN ROIs. Hence, the shift-selective regions fully complied with the definition of the DMN.
Shift and stay networks compared with commonly used DMN definitions
The DMN can be defined using several criteria (Karahanoğlu and Van De Ville, 2015). Hence, do our results also hold true using other commonly used DMN definitions, such as those based on (1) ICA (DMNic) (Moeller et al., 2009; Hutchison et al., 2011; Mantini et al., 2013); (2) seeding in medial posterior cingulate cortex (mPCC, DMNseed) (Vincent et al., 2007; Margulies et al., 2009; Teichert et al., 2010; Mantini et al., 2011; Hutchison and Everling, 2012); and (3) task-related deactivations (same as Fig. 2, DMNt)? To test this at group and individual levels, we also acquired resting state data from each animal while awake and fixating. It has to be noted that these different definitions of the DMN yield a set of core regions which are not exactly identical (Hutchison and Everling, 2012), and their convergence can be inspected in Figure 4A, whereas their overlap with the respective shift and stay networks in the group and single monkeys is reported in Figure 4B.

Task-related shift network compared with currently existing definitions of the DMN. A, (1) DMNt (dark blue): meta-analysis of task-related deactivations (Mantini et al., 2011), corresponding to the original definition used in human (Raichle et al., 2001); (2) DMNic (purple): ICA (IC is spatially best correlating with 1); (3) DMNseed (light blue): defined by seeding in PCC node (area 31/23) indicated on the flat map (dotted circle). DMNvis is not shown on the figure to prevent overcrowding. Numbered circles represent the location of ROIs (local maxima), of each DMN in the corresponding color, that entered the cross-correlation analysis in Figure 6 (also listed in Table 1). For labels and flat map, same conventions as in Figure 2. B, Percent overlap of shift-selective (contrast 3) and stay-selective (contrast 1 and 2) voxels, with each version of the DMN and (C) percent overlap of the DMN with the shift- and stay-selective voxels for the group (bars, N = 3) and individual monkeys (red represents shift activations; green represents stay activations). Same conventions as in Figure 2 (for each contrast), and A (for colors). Rightmost plot represents task-related deactivations in the stimulus localizer data of the same animals contrasting the fixation-only condition versus visual stimulation (DMN Fixation vs Visual). Volume sections of the different DMNs are displayed in Figure 5. Dashed lines indicate the chance level overlap, as determined by randomly shuffling of voxels (1000×) across the gray matter surface. *p < 0.001.
To compare the overlap between the network activated for attention shifts with the group-level (N = 3) and monkey-specific DMNs, we first applied an ICA on the resting-state data of each individual by means of spatial ICA using the GIFT toolbox (Hutchison et al., 2011; Mantini et al., 2013). Spatial ICA extracts maximally independent patterns of coherent fMRI activity (Calhoun et al., 2001). We subsequently identified the independent component that correlated best with the monkey DMNt (Mantini et al., 2011) (Fig. 2, blue) for each subject (M13, R2 = 0.21; M24, R2 = 0.27; M35, R2 = 0.35) and for the group (DMNic, R2 = 0.26). The mean stability index for these DMN components was 0.96 (±0.03 SD) within the single monkeys and 0.81 for the group (computed by reiterating the ICA 10 times using the ICASSO toolbox; see Materials and Methods) (Himberg et al., 2004), indicating that the obtained clusters were consistent across multiple ICA runs. Group results of DMNic are displayed in Figure 4A (purple overlay; for the volume display, see Fig. 5B). To further validate our DMN results with respect to previous studies using a seeding approach (Vincent et al., 2007; Margulies et al., 2009; Teichert et al., 2010; Mantini et al., 2011; Hutchison and Everling, 2012), we placed a seed (2 mm sphere) in medial posterior parietal cortex area 23/31 (Vincent et al., 2007; Margulies et al., 2009; Hutchison and Everling, 2012) as indicated by Figure 4A (light-blue dotted circle; see Fig. 5C, transverse sections). Importantly, this seed was located outside shift-selective areas (Fig. 4A, hot color). Comparison of the three DMN definitions (DMNt, DMNic, and DMNseed) in Figure 4A highlighted common core regions located in cmoc, posterior parietal cortex (including areas 31/V6A/V6/PGm), and spreading into the intraparietal sulcus (including PEa), bilateral posterior STS regions termed TPOC, caudal area 46, and the FEF (only visible in the volume of DMNic, Fig. 5B, transverse slices −16/16, respectively), but not the ACC. In most of these core regions (except FEF), shift-selective voxels overlapped with DMN voxels (Fig. 4A, blue, cyan, and purple overlap with hot colors). Finally, we obtained a fourth DMN-like map in the same animals by contrasting fixation with visual stimulation, obtained in independent localizer scans for identifying the cortical representations of the shapes used in the attention task, and displayed in the volume of Figure 5D. Figure 4B summarizes the percent overlap of shift (Figs. 2, 4A, hot color), and stay-selective voxels (Fig. 2, green), with each of the four DMN definitions for the group and for the individual monkeys.
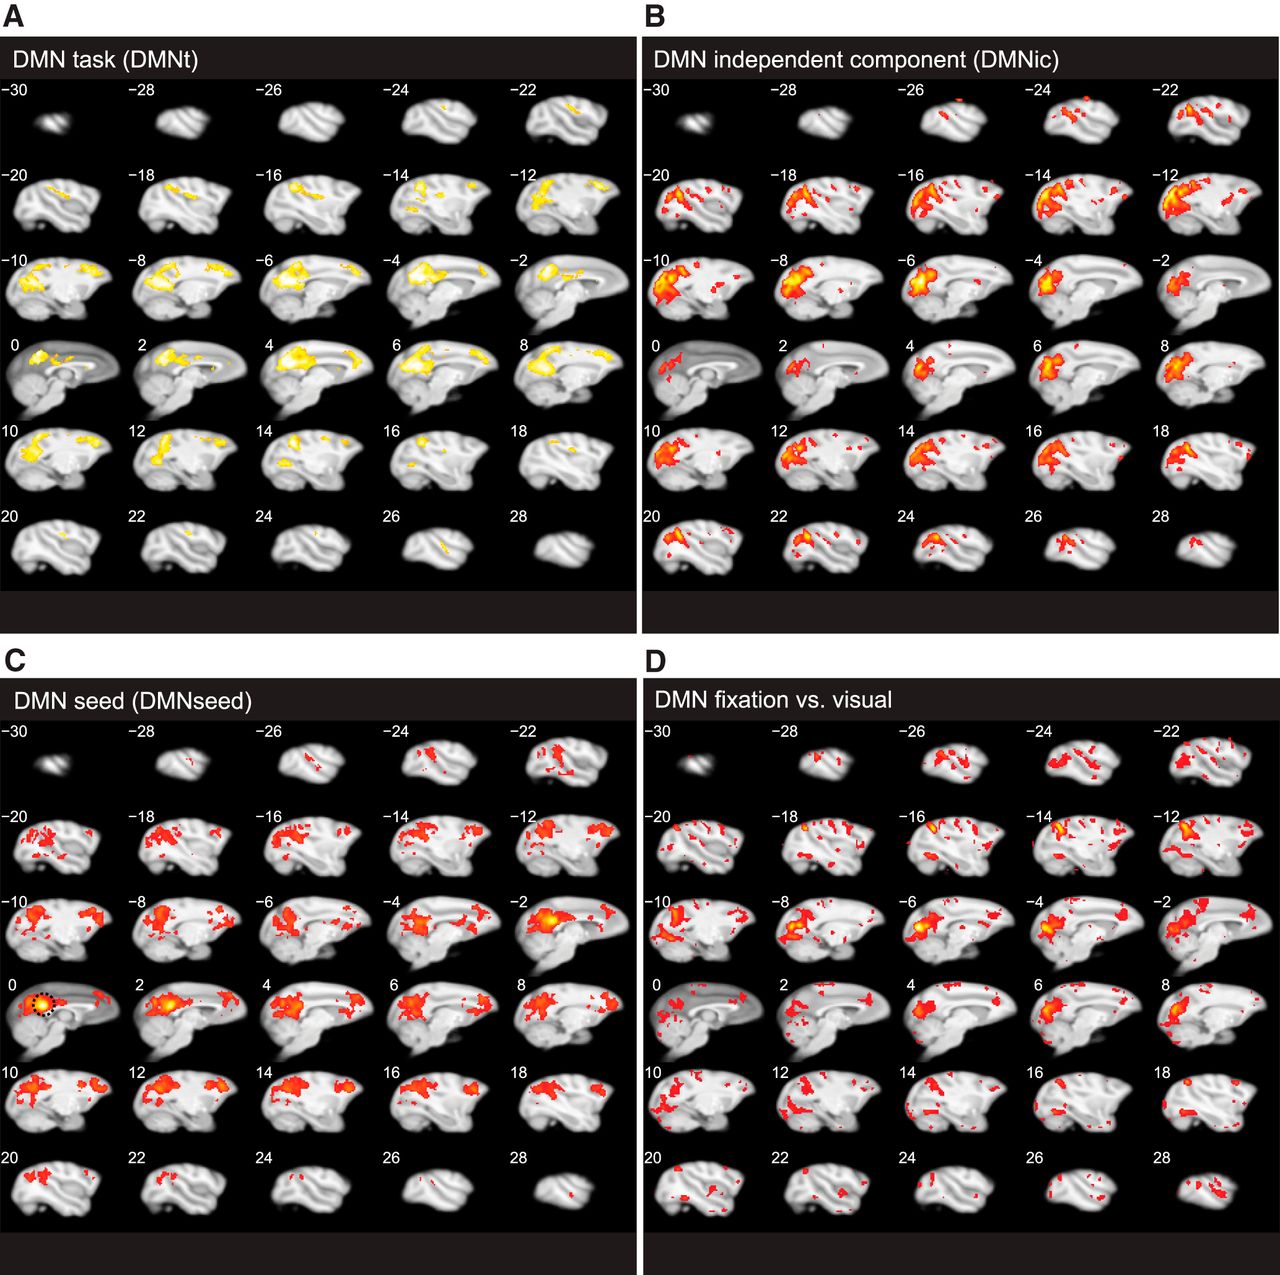
Transverse volume sections of four DMN definitions as displayed in Figure 4A. A, DMNt, as defined by Mantini et al. (2011) in a meta-analysis of task-related deactivations across 15 experiments (at threshold 8 of 15 experiments). B, C, DMNs obtained from the resting state scans across the 3 animals (awake while fixating). B, DMNic, defined by ICA at threshold z = 1 (Hutchison et al., 2011). C, DMNseed, defined by seeding in medial PCC node (border of area 23/31, seed position indicated on slice 0 with dotted circle) (Vincent et al., 2007; Hutchison et al., 2011), FFX, thresholded at FWE (p = 0.05). D, DMN fixation versus visual obtained from an independent stimulus localizer dataset, FFX across all sessions of the 3 monkeys, thresholded at FWE (p = 0.05), contrasting fixation with visual stimulation (same stimuli and eccentricity as shown during selective attention task). fMRI data analysis.
It has to be noted that the DMNt data in Figures 2 and 4B were obtained from a meta-analysis, including M13 and 9 other animals (Fig. 5A, volume sections). The other three DMNs (DMNic, DMNseed, and DMN Fix vs Visual) were individually defined within each of our subjects. Using the data across these three monkey-specific DMNs, we observed an average overlap of 62.06% shift (DMN voxels vs 13.37% stay) DMN voxels. The shift overlap with the DMN was significantly different from an overlap calculated based on a chance distribution of the shift voxels (p < 0.001), as determined by randomly shuffling locations of shift voxels (see Definition of overlap: Shift voxels and DMN voxels). This was not the case for the stay-DMN overlap, except when the DMNseed definition was used, which revealed an overlap marginally above chance level (see Fig. 4B, light blue bars). This indicates that, for the individually defined DMNs, virtually two-thirds of the shift voxels were located within the DMN, whereas stay-selective voxels were mainly located outside the DMN.
Conversely, we also compared the overlap of DMN and shift voxels over the total number of DMN voxels (Fig. 4C). On average (across all DMN definitions), 17.43% of the DMN voxels overlapped with shift voxels (DMNt = 19.11%, DMNic = 13.99%, DMNseed = 16.97%, DMN-fixation-vs-visual = 19.67%, average chance overlap of DMN and shift voxels over the total number of DMN voxels: 3.58%). This suggests that, whereas most of the shift voxels are located within core DMN regions, only a fraction of the entire DMN is specifically recruited for computing one specific type of cognitive shift, namely, spatial attention shifts. As the repertoire of possible cognitive shifts is exceedingly large, our findings are entirely in line with the expectation that only a relatively small fraction of the DMN will overlap with the substrate processing shifts in spatial attention. In contrast, the average overlap of the DMN and the stay voxels relative to the total DMN was below chance (average = 15.75%, chance overlap = 17.57%, DMNt = 12.15%, DMNic = 17.17%, DMNseed = 24.28%, DMN-fixation-vs-visual = 9.42).
We also examined the overlap of the shift and stay activations with a monkey-specific frontoparietal network (FPN) derived from the ICA analysis (see Materials and Methods). We found a significant overlap of FPN and shift voxels over the total number of FPN voxels (group 25.86%, chance level 6.83%). Despite this, the overlap of the shift regions with the DMN (62.06%) was larger than its overlap with the FPN (25.86%). In contrast, the overlap of the stay regions (group 13.37%, chance level 6.83%) with the DMN, although significant, was comparable with its overlap with the frontoparietal network (14.01%). Furthermore, overlap with the DMN (shift 62.06%; stay 13.37%) better separated the shift and stay regions compared with FPN (shift 25.86%; stay 14.01%).
Functional connectivity and unsupervised clustering of DMN shift and stay regions at rest
Next, we performed a cross-correlation analysis on resting state data acquired in each animal, thereby focusing on the nodes of the default mode, shift and stay networks (for the definitions of DMN, shift, and stay nodes, see Table 1). We hypothesized that DMN and shift areas should show more highly correlated spontaneous fMRI activity compared with DMN and stay areas. As can be observed in the cross-correlation matrix (Fig. 6), posterior nodes within the shift network correlated highly with the posterior DMN nodes (r = 0.51, p < 0.001), and even with the entire DMN (r = 0.45, p = 0.0018). This was not the case for the stay nodes (both r = 0.16, p = 0.06). Between the DMN and stay network, area LIP was the main node revealing high correlations with the DMN (r = 0.45, p = 0.004). It needs to be noted, however, that LIP showed both shift and stay signals in the covert attention task (Caspari et al., 2015) and is most likely a central hub for both. Noteworthy is TPOC within the DMN located in the posterior STS, which correlated significantly with most posterior shift ROIs (r = 0.38, p ≪ 0.001). Although functional connectivity tends to decrease with interregional distance (Salvador et al., 2005; Honey et al., 2009), the pattern of the correlation matrix cannot be explained based on distance alone because frontal shift regions were significantly correlated with posterior DMN areas. For example, the anterior principal sulcus, the most frontal node of the shift network, significantly (p < 0.001) correlated with bilateral PO/V6 (r > 0.3) of the DMN. Also, right FEF, as part of the DMN, was significantly (p < 0.001) correlated with left TPOC and cmoc (r > 0.22) of the shift network. Unsupervised, hierarchical cluster analysis applied to the correlation matrix, using the average linkage algorithm (Everitt et al., 2001), confirmed that shift and DMN nodes were intermingled within one cluster, which split into posterior and anterior clusters (Fig. 7). The only exception within the posterior DMN/shift cluster was LIP, which belongs to the stay network (but see above), and left FST, that clustered apart. Exceptional shift nodes were areas 11/12, somatomotor cortex, and area F6, as they were not correlated with the rest of the shift ROIs (r = 1.3, p = 0.05). These formed clusters among the stay ROIs (Fig. 7).

ROI cross-correlation analyses between nodes of task-related shift and stay networks (Caspari et al., 2015) and core nodes of the DMN. Significant correlation between DMN and posterior shift ROIs. Nodes were defined as 2 mm radius spheres around local maxima of each ROI (Table 1). Correlation values are indicated with color code (red represents high correlation; blue represents anticorrelation), representing the average correlation across all sessions of all animals. Significances are computed from a MFX across sessions (n = 6, 2 per animal, at p < 0.001). Black squares in the matrix have the same stereotactic coordinate; hence, no value was calculated. **p < 0.001. 3p < 0.0001. 4p < 0.00001. 5FWE (p = 0.05). Same conventions as in Figures 2–4. L, Left; R, right; PO, parieto-occipital.

Clustering across stay, shift, and DMN ROIs. Dendrogram represents the unsupervised clustering of all the ROIs from the correlation matrix in Figure 6 based on their functional correlation values, using the average linkage algorithm (Everitt et al., 2001; Mantini et al., 2011). Clusters with a linkage distance >0.5 are colored according to whether they include stay (green), or shift (red) seeds, or a mixture of shift and DMN seeds (purple).
Discussion
We used an attention paradigm comparing activity during task epochs requiring either profound or small cognitive shifts. We demonstrated that fMRI activations induced by shifts of attention, and not by sustained attention, largely coincide with core nodes of the monkey DMN. Crucially, when these DMN regions were independently defined, they showed significant shift selectivity. Also, the average raw fMRI time courses of independently defined DMN and shift nodes were highly correlated. Unexpectedly, the regions involved in shifting attention showed substantial deactivations for all task conditions relative to the raw baseline fMRI signal, which is a hallmark of the DMN. Finally, a functional cross-correlation analysis among core nodes of the default mode, shift and stay networks, using independent resting state data acquired in the same subjects, revealed high functional correlations between all posterior regions of the shift network and the DMN. This provides additional evidence that attention shift and DMN-ROIs share functional properties during task performance (Fox and Raichle, 2007). Our results were independent of the exact DMN definition because four commonly used versions of the DMN (Hutchison and Everling, 2012), based on ICA, seeding, task-related deactivations from a meta-analysis, and stimulus-driven deactivations (in the same individuals), revealed highly similar results (Mantini and Vanduffel, 2013). We propose that cognitive shifting, in general, is one of the evolutionary preserved functions of the DMN, which may also explain its involvement in introspective behaviors and a large number of brain pathologies.
Segregation between anterior and posterior shift and DMN ROIs?
Whereas posterior shift-selective regions, such as the caudal (cmoc), medial (posterior parietal), and lateral parietal (TPOC) regions showed virtually complete overlap with the DMN, convergence in frontal regions (ACC, area 46, areas 11/12, F6) was not complete (Figs. 2, 4A). Segregation between frontal and parietal shift-selective ROIs was also apparent in the functional correlation matrix (Fig. 6). Frontal shift regions (especially areas F6, somatomotor cortex, and areas 11/12) correlated less with the rest of the shift ROIs, and all DMN ROIs. The only exception was area 46, also included within the DMN (Mantini et al., 2011). Potentially, some of the anterior shift regions in monkey might be involved in cognitive control during task performance, rather than exhibiting purely DMN or shift-related activity. Cognitive control functions have been linked to activity in monkey ACC (Brown and Braver, 2005; Quilodran et al., 2008; Rushworth and Behrens, 2008), and also area 46 (Ridderinkhof et al., 2004; Rossi et al., 2007). This might explain why both ACC and area 46 converged at the same time with DMN, shift- and stay-selective regions (Fig. 2), indicating a common involvement across networks. Area 12 in monkey lateral prefrontal cortex exerted cognitive control during a complex cognitive set shifting task (Nakahara et al., 2002) and during goal-directed action (Borra et al., 2011). Similarly, presupplementary motor area (F7) was shown to regulate goal-directed behavioral control (Isoda and Hikosaka, 2007; Nachev et al., 2008). In humans, recent evidence suggested that the DMN couples to the frontoparietal control network during goal-directed cognition (Spreng et al., 2010). It is possible that also in monkeys the control network couples to the DMN/shift network, to correctly instantiate a challenging rule-driven cognitive shift.
Posterior and anterior DMN structures may be functionally segregated, as has been suggested for the human DMN using ICA (Damoiseaux et al., 2006; Cassidy et al., 2016) or task-based fMRI (Whitfield-Gabrieli et al., 2011). Also, seeding within human PCC reveals more consistent DMN locations than seeding in mPFC (Greicius et al., 2003). Although mPFC and PCC are highly connected and interacting (e.g., during working memory encoding) (Hampson et al., 2006), both show anticorrelations with a distinct set of areas, and both nodes interact with a different set of task-positive networks (Uddin et al., 2009).
Extent of the DMN compared with the spatial shift-selective network
Overall, many shift voxels (on average 64%, across the four DMN definitions) recruited regions within the DMN. Conversely, the percentage of individual DMN voxels selective for spatial attention shifts was much lower (on average 16.2%). In case cognitive shifting is one of the defining DMN properties, as we propose, this result can be expected because we tested only one of many possible types of cognitive shifts. Also in humans, shifts between mental events, future and past thoughts, between feelings of oneself or another, the internal and external bodily state or internally and externally directed attention, recruit different units of the DMN, which may also contribute to the existence of different definitions (Buckner et al., 2008) or subdivisions (Andrews-Hanna et al., 2010) of the DMN. The richer the set of cognitive shifts, for example, when averaging across unconstrained mental processes, or during meta-analyses pooling the activity induced by a wide variety of cognitive shifts, the more DMN voxels might be identified. For instance, emotional, social, and self-referential DMN functions in humans are more often assigned to anterior DMN regions such as mPFC (D'Argembeau et al., 2005; Gilbert et al., 2006; Mitchell et al., 2006). Visuospatial imagery, episodic memory retrieval, and anticipatory attention shifts, on the other hand, are assigned to posterior DMN regions, including PCC (Small et al., 2003; Lundstrom et al., 2005; Cavanna and Trimble, 2006).
How could cognitive shifting be implemented by the DMN?
Many cognitive processes that have been associated with DMN function can be typified as having frequent cognitive shifts: shifting from one thought to another during mind wandering, autobiographical memory, thinking about your own thoughts and emotions (meta-cognition), thinking about other people's thoughts, emotions, and motivations (theory-of-mind), thinking about and planning your own future, shifting your focus of attention while monitoring the external world, social working memory, and story comprehension. Therefore, we propose that cognitive shifting, in general, is one of the evolutionary preserved functions of the DMN, which may explain its involvement in introspective behaviors and a large number of brain pathologies.
DMN and shift regions show an unexpectedly similar pattern of deactivation (Fig. 3G,H). Mechanistically, a sudden shift may be accomplished through a release of inhibition (Sauseng et al., 2005), leading to a negative fMRI signal being attenuated. Release of inhibition might be energetically the most efficient manner to quickly allocate resources enabling rapid cognitive events. At first glance, our data seem at odds with the lower activity levels of posterior cingulate neurons within the presumptive DMN during an attention and working-memory task compared with rest (Hayden et al., 2009). However, in the working memory condition of that study, a clear tonic release of inhibition was observed upon appearance of a brief, spatially unpredictable memory cue. Likely, this triggered a sudden shift in spatial attention, corroborating the present results. Similarly, single neurons recorded in area 7a, converging with monkey TPOC, are suppressed during covert attention to the visual periphery (Steinmetz et al., 1994). Neurons in area 7a also fired when the locus of attention shifted during the trial, showing an enhancement for a matched stimulus (Rawley and Constantinidis, 2010), and they were influenced by covert shifts of attention away from the point of fixation (Steinmetz and Constantinidis, 1995). Area 7a neurons/monkey TPOC show thus similar properties as DMN and shift regions: DMN-like deactivations together with activation during attention shifts. Together with the average time course of the monkey DMN and shift regions, this is entirely in line with the sentinel hypothesis of the DMN (Buckner et al., 2008).
A similar pattern of deactivation has previously been reported for the right human temporoparietal junction/supramarginal gyrus, showing deactivations during visual search (requiring many shifts across the visual hemifield), and activations during target detection (Shulman et al., 2003, 2007; Anticevic et al., 2010; Gillebert et al., 2012). Parts of this ventral supramarginal gyrus showed a significant BOLD-target detection correlation and a strong deactivation with respect to a passive viewing baseline (Shulman et al., 1997, 2007). In human, this region is heterogeneous (Mars et al., 2012a; Igelström et al., 2015), and at least a portion belongs to the DMN (Mars et al., 2012b).
Human intracranial recordings also showed suppression of DMN gamma band activity during a visual search task (Ossandón et al., 2011). The more suppression of the DMN, the faster targets were detected. Conversely, the DMN was more active when the subject shifted attention for longer periods during the search task. Another study also showed increased activity in human DMN areas, which correlated with faster reaction times when unpredictable stimuli had to be detected, requiring sudden attention shifts (Hahn et al., 2007). Core DMN areas, such as the PCC and mPFC, are activated during anticipatory allocation of attention (Small et al., 2003). Finally, core and medial temporal lobe subnetworks of the DMN are engaged during profound cognitive shifts in humans (Crittenden et al., 2015).
These findings highlight the transient and dynamic nature of the DMN (Ossandón et al., 2011) and its potential involvement in cognitive shifts. Rapid automatic shifts of attention for detecting predators and unexpected, possibly life-threatening events are fundamental for survival of the primate species. Our findings add evidence in favor of the hypothesis that the computation of cognitive shifts in general might be a major driving factor of the DMN. Obviously, the present dataset does not preclude that other functions in addition to cognitive shifting are carried by the DMN. It is noteworthy, however, that most of the functions previously attributed to the DMN can be explained by the cognitive shifting theory. Future studies are also required to investigate whether variants of “cognitive” shifting also activate the DMN of other mammals, including rodents.
Footnotes
This work was supported by Inter-University Attraction Pole 7/11 to W.V. and R.V.; Research Foundation Flanders Senior Clinical Investigator Grant, G0660.09 and G0A09.13 to R.V., and G0A5613, G.062208.10, G0B8617N, and Odysseus G0007.12 to W.V.; KU Leuven OT/12/097 to R.V.; Programme Financing PFV/10/008 to R.V. and W.V.; European Union Seventh Framework Grant Agreement 604102 (Human Brain Project, SGA1) to W.V.; and Hercules to W.V and R.V., J.T.A. is a postdoctoral fellow of FWO. We thank S. Verstraeten, M. De Paep, W. Depuydt, A. Coeman, C. Fransen, P. Kayenbergh, I. Puttemans, C. Ulens, S. De Pril, A. Hermans, and G. Meulemans for technical and administrative support; and S. Raiguel for comments on the manuscript.
The authors declare no competing financial interests.
- Correspondence should be addressed to Dr. Wim Vanduffel, Laboratory for Neuro- and Psychophysiology, KU Leuven Medical School, 3000 Leuven, Belgium. wim{at}nmr.mgh.harvard.edu


