Article Text

Abstract
Background: The responsible genes have not yet been identified for many genetically mapped disease loci. Physically interacting proteins tend to be involved in the same cellular process, and mutations in their genes may lead to similar disease phenotypes.
Objective: To investigate whether protein–protein interactions can predict genes for genetically heterogeneous diseases.
Methods: 72 940 protein–protein interactions between 10 894 human proteins were used to search 432 loci for candidate disease genes representing 383 genetically heterogeneous hereditary diseases. For each disease, the protein interaction partners of its known causative genes were compared with the disease associated loci lacking identified causative genes. Interaction partners located within such loci were considered candidate disease gene predictions. Prediction accuracy was tested using a benchmark set of known disease genes.
Results: Almost 300 candidate disease gene predictions were made. Some of these have since been confirmed. On average, 10% or more are expected to be genuine disease genes, representing a 10-fold enrichment compared with positional information only. Examples of interesting candidates are AKAP6 for arrythmogenic right ventricular dysplasia 3 and SYN3 for familial partial epilepsy with variable foci.
Conclusions: Exploiting protein–protein interactions can greatly increase the likelihood of finding positional candidate disease genes. When applied on a large scale they can lead to novel candidate gene predictions.
- HPRD, Human Protein Reference Database
- OMIM, Online Mendelian Inheritance in Man
- Y2H, yeast two-hybrid protein–protein interaction assay
- disease gene
- candidate gene
- disease gene prediction
- protein–protein interactions
- bioinformatics
Statistics from Altmetric.com
- HPRD, Human Protein Reference Database
- OMIM, Online Mendelian Inheritance in Man
- Y2H, yeast two-hybrid protein–protein interaction assay
Many human genetic diseases can be caused by multiple genes. Since they lead to the same or similar disease phenotypes, the underlying genes are likely to be functionally related. Such functional relatedness can be exploited to aid in the finding of novel disease genes.1 Direct protein–protein interactions are one of the strongest manifestations of a functional relation between genes, so interacting proteins may lead to the same disease phenotype when mutated. Indeed, several genetically heterogeneous hereditary diseases are known to be caused by mutations in different interacting proteins, such as Hermansky-Pudlak syndrome and Fanconi anaemia.2,3 Also, a recent study showed that interacting proteins tend to lead to similar disease phenotypes when mutated.4 Therefore protein–protein interactions might in principle be used to identify potentially interesting disease gene candidates.
Many human protein–protein interactions have been reported.5 These literature based interactions are reliable, but are naturally biased toward better studied proteins and have already been exploited by the community for disease gene prediction. Protein–protein interactions from high throughput experiments do not have this bias, though they are also generally less reliable than literature based interactions.6 These high throughput sets are especially interesting for novel disease gene prediction as they can contain previously undescribed protein–protein interactions. There are two human high throughput protein–protein interaction sets available,7,8 but more are available from other species. These first have to be mapped to interactions between human proteins before they can be applied to disease gene prediction.
We investigated how successful protein–protein interactions are in predicting candidate disease genes for genetically heterogeneous hereditary diseases using a systematic large scale bioinformatics approach. To be as comprehensive and unbiased as possible we used both literature-based and high throughput human protein–protein interactions, and human mapped high throughput interactions from three other species—Drosophila melanogaster (fruit fly), Caenorhabditis elegans (nematode), and Saccharomyces cerevisiae (baker’s yeast). To identify potential new candidate disease genes, we examined whether disease proteins had interaction partners which were located within other loci associated with that same disease; such interaction partners were considered to be candidate disease genes. Several of these predictions have since been confirmed.
METHODS
Genetic disease data
Disease data were obtained from the Online Mendelian Inheritance in Man (OMIM, http://www.ncbi.nlm.nih.gov/entrez/query.fcgi?db=OMIM) “Morbid Map” list of diseases. This list contains disease loci and known disease genes from the OMIM database.9 We selected genetically heterogeneous hereditary diseases with at least one known disease causing gene and at least one disease locus lacking an identified causative gene. Disease subtypes were pooled into single diseases. A disease can have several loci, some of which may overlap each other. For instance, there are several X linked mental retardation subtypes, many of which have been mapped to overlapping loci. Therefore, a single protein–protein interaction could result in multiple candidate gene predictions for different disease subtypes.
The loci vary in length and gene count, with a median of 88 genes per locus, and a mean of 123.6; the loci lengths are not normally distributed. Whole chromosome loci were excluded from the analyses. In total, there were 383 diseases in the dataset. Together these diseases have 1195 disease loci with identified disease genes and 432 disease loci lacking identified causative genes.
The dataset used in the benchmark tests contained all the genetically heterogeneous hereditary diseases from Morbid Map with at least two known disease genes (289 diseases, 1114 disease loci with known disease genes, 1003 distinct genes). Only loci with known disease genes were used in the benchmark tests.
Protein–protein interaction sets
Five protein–protein interaction datasets were used in this study, from four different species—human, Drosophila melanogaster, Caenorhabditis elegans, and Saccharomyces cerevisiae (table 1). One of the human interaction sets contained manually curated protein–protein interactions culled from the literature, while all the other protein interaction data were from high throughput protein–protein interaction experiments.
Protein–protein interaction sets used in the study
The non-human protein–protein interactions were mapped to human proteins using orthology relations. Orthology between the other species’ and human proteins was determined using the Inparanoid program,17 with default settings, on the whole (protein) genomes of the species. Genomes were acquired from Ensembl18 for the metazoan species and from the Saccharomyces genome database19 for yeast. Where one non-human protein was orthologous to several human proteins, the interaction was assumed to be valid for all these proteins.
Candidate gene prediction
For all the diseases in the heterogenic diseases dataset, the following actions were undertaken:
-
The protein interaction partners were determined for each known disease protein.
-
The chromosomal locations of the genes coding for these interacting proteins were determined using gene location data from the Ensembl database. The cytogentic loci were mapped to chromosomal base pair ranges using the Ensembl database, which specifies cytogenetic band boundaries as exact base pair positions, rounded off to the nearest 100 kb.
-
These chromosomal locations were checked to see if they fell within one or more disease loci (of the same disease) that lacked a known disease gene.
-
Each interacting protein gene that was located within one of these loci was considered a candidate gene prediction.
-
If a candidate gene lay within multiple (overlapping) loci of the same disease, each of them was counted as a separate prediction.
This procedure was carried out using a custom written C++ program (available on request), as were the benchmark and randomisation tests described below.
Benchmark tests
The benchmark test is introduced to examine how well a protein–protein interaction set performs in recovering known disease genes from different loci known to be involved in the same disease. These tests were therefore carried out analogously to the candidate gene prediction tests, with the exception that the protein interactor positions were examined against the disease loci with known disease genes (as opposed to the loci with unidentified disease genes). As with the prediction tests, these genes and their associated disease loci were taken from OMIM Morbid Map.
If an interactor lay within a disease locus it was considered a candidate gene prediction (a positive). If this interactor was indeed the known disease gene in that locus, it was considered a correct prediction (true positive). If it was not the known disease gene for that locus, it was considered a wrong prediction (false positive).
Randomisation tests
Owing to the complex nature of the data—potentially overlapping loci with different gene counts and networked protein–protein interactions—protein interactor randomisation tests were used to estimate the significance of the candidate gene prediction and benchmark results. In each case the genome was randomly shuffled and each protein in the interaction set was replaced with its counterpart from the shuffled genome. This approach retains the original structure of the interaction network; it only randomises the protein identities.
One thousand randomisation tests were carried out for each of the 10 analyses: five protein–protein interaction sets, each of which was used for both novel disease gene prediction and for benchmarking. In addition, separate randomisation tests were carried out for the two combined datasets, the combined high throughput set, and the total combined set.
Two other types of randomisation tests were carried out for each dataset—namely, the randomisation of the gene positions on the genome, and the shuffling of the protein interactors in the interactor sets. These led to similar results as the interactor identity randomisation (data not shown) and were left out of the results for brevity.
RESULTS
Benchmark tests perform well above random expectation
In order to examine how well protein–protein interaction sets predict disease genes in other loci of the same disease, we first undertook benchmark tests that attempted to predict known disease genes. These tests were carried out using only diseases with multiple known causative genes and their disease associated loci from OMIM Morbid Map, allowing the candidate gene predictions to be evaluated for accuracy and overrepresentation. With regard to the number of disease gene interaction partners that are located in another locus of the same disease, the HPRD interaction stood out as having over twice as many as would be expected by chance (fig 1). The high throughput sets all scored higher than the vast majority of their randomised controls, though the magnitude of this differed from the fly set, scoring higher than all but two controls, to the worm set, scoring higher than 823 of the 1000 randomised controls. We thus show here an overrepresentation of disease gene interaction partners in other disease associated loci, suggesting that disease genes encode proteins that tend to interact with each other.

Overrepresentation of physically interaction proteins from loci associated with the same disease. The different protein–protein interaction sets used are on the X axis, while the Y axis contains the number of disease protein interactors falling within another locus associated with the same disease (hits) in the benchmark locus set. Black stars and associated shaded boxes indicate the values based on the real interaction datasets, while the box plots indicate the values resulting from the 1000 randomised interactor controls per set (numbers in clear boxes are medians). The value for the combined interaction dataset (indicated by the black arrow) is not included in the plot, to keep the Y axis scale manageable. The HPRD and total combined sets score much higher than all their randomised controls; the difference is smaller for the high throughput sets. HPRD, Human Protein Reference Database; HT, high throughput.
The tendency for proteins associated with the same disease to interact with each other can be tested more directly by examining what percentage of these correctly localised interaction partners are indeed the known disease causing genes in those loci (fig 2). Once again, the HPRD protein–protein interactions performed very well. Almost 60% of these interacting proteins corresponded to the known disease causing genes in these loci. The high throughput protein interaction sets had a lower performance (9–17%, with an average of 12%), but they all did much better than their randomised controls. Except for the two smallest sets, all interaction sets substantially outperformed every single run of their corresponding 1000 randomised controls. This implies that disease protein interaction partners, when located within other loci of the same disease, are at least 10-fold more likely to be involved in that disease than the other genes in these loci, given that randomly chosen locus genes have on average a 1% (1/88) chance of being correct.
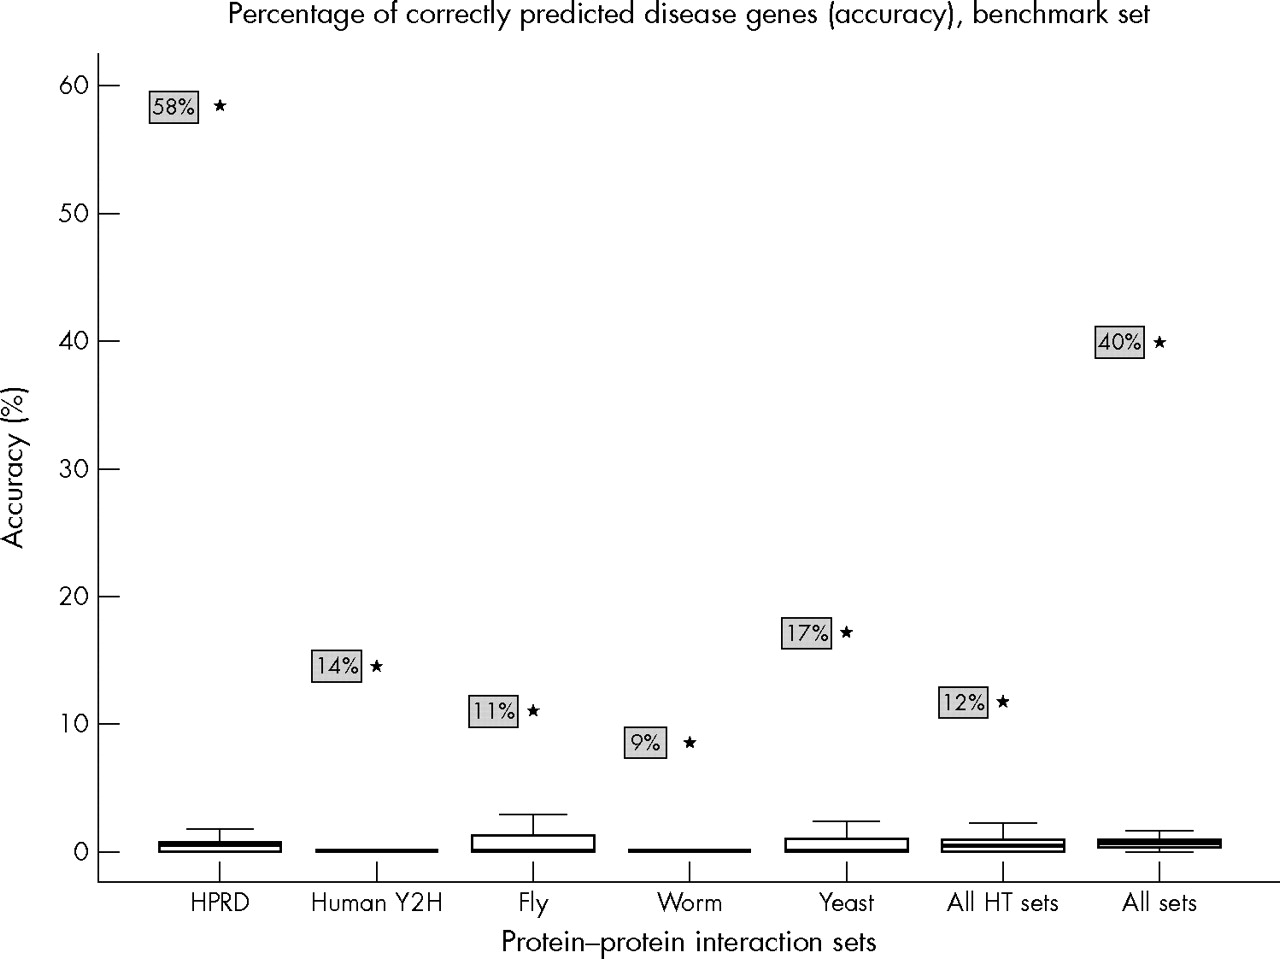
Relatively high likelihood of finding a disease gene from protein interaction data in a given locus. The different protein–protein interaction sets used are on the X axis, while the Y axis contains the percentage of disease protein interactors falling within other disease loci that correspond to the known disease genes in those loci. Black stars (and associated shaded boxes) indicate the values based on the real interaction datasets, while the box plots indicate the values resulting from the 1000 randomised interactor controls per set. Randomised controls have median accuracies of less than 1%. All interaction sets substantially outperform all their controls, with the HPRD scoring exceptionally high. HPRD, Human Protein Reference Database; HT, high throughput.
An interesting result is that the yeast interaction set is more accurate in predicting candidate genes than the other high throughput sets, including those using “native” human proteins. Most of the yeast interactions are based on protein complex purification rather than yeast two-hybrid assays. A likely explanation for the relatively good performances of the yeast interactions is the previously observed higher quality of protein–protein interaction data from protein complex purification experiments relative to yeast two-hybrid assays.6
Candidate disease gene prediction results follow similar patterns
Having established the validity of the approach for known disease genes we compared the likelihood of mapping an interactor to a disease locus to chance expectation for disease loci for which we do not know the disease gene. As shown in fig 3, the three largest datasets and the combined data all showed an increase relative to the medians of the randomisation experiments. This result is consistent with that of the benchmark experiments for the high throughput data. It indicates an appreciable enrichment for true disease genes in the prediction results. Nevertheless the majority of the candidates are still probably false positives.

Candidate disease gene prediction hit counts. The different protein–protein interaction sets used are on the X axis, while the Y axis contains the number of disease protein interactors falling within another locus associated with the same disease (hits) in the candidate gene prediction locus set. Black stars (and associated shaded boxes) indicate the values based on the real interaction datasets, while the box plots indicate the values resulting from the 1000 randomised interactor controls per set (numbers in clear boxes are medians). The fly and worm sets score higher than the majority of their randomised controls, but the two smallest sets do not perform above random expectation. The HPRD scores relatively lower than the fly and worm sets, but still above the majority of its controls. HPRD, Human Protein Reference Database; HT, high throughput.
In contrast to the high throughput results from fly and yeast, the HPRD results do show a large discrepancy between the benchmark results and the novel gene prediction results. In the latter the enrichment of interactors in disease loci is much smaller than in the former. This suggests that the majority of disease genes which could be found using HPRD protein–protein interactions have already been detected by the community, which is unsurprising given that all these interactions have previously been reported. Some of the interactions in the HPRD are even based on research on disease genes in the first place.20–23 Thus the HPRD benchmark results are not representative for its novel gene prediction results.
The two smallest high throughput interaction sets, human and worm, show no signal for the prediction of novel disease genes. It should be noted that the candidate gene prediction disease dataset contains fewer target loci (432) than the benchmark dataset (1114). One explanation for this might be that the combination of a small number of interactions and a small number of target loci prevents the two smallest sets from showing any signal here.
The full list of predicted candidate disease genes and their corresponding interactions are given in supplementary table 1 (the supplementary table can be viewed on the journal website (http://www.jmedgenet.com/supplemental)..
Confirmed and refuted predictions
A few candidate disease gene predictions could be confirmed or refuted because the disease causing genes are known but absent from the list of known disease genes used in the study (table 2). These disease loci were treated as having unidentified causative genes during the study, but manual inspection of the results led to their identification as disease loci with known causative genes.
Confirmed and refuted candidate disease gene predictions
It is encouraging to see that so many of these predictions were confirmed, though these are generally from the HPRD interaction set (of which 10 were confirmed and five refuted). From the high throughput sets there were two confirmed and 13 refuted predictions, which is consistent with their benchmark results (fig 2). This list may not be exhaustive owing to the complexities of thoroughly investigating all these predictions by hand, but we do not expect these proportions to change substantially. In any case the benchmark results remain valid, as the known gene disease loci are not susceptible to this misannotation problem.
Promising leads
In addition to these confirmed prediction the protein interaction sets also led to several plausible but unconfirmed candidate gene predictions. For instance, the AKAP6 (A-kinase (PRKA) anchor protein 6) gene is predicted as a candidate gene for arrythmogenic right ventricular dysplasia 3 (OMIM 602086), based on an HPRD interaction with RYR2 (ryanodine receptor 2). A-kinase anchor proteins are involved in cardiac myocyte contractility and possibly also in heart failure.27,28 SYN3 (synapsin III) was predicted as a candidate gene for familial partial epilepsy with variable foci (OMIM 604364) based on an HPRD interaction with SYN1 (synapsin I), which is causative for epilepsy, X linked, with variable learning disabilities and behaviour disorders (OMIM 300491). There are several other interesting examples, which can be viewed in supplementary table 1 (http://www.jmedgenet.com/supplemental).
The HPRD interaction set is biased toward disease proteins
As it is based on interactions described in published reports, the HPRD interaction set is expected to be biased toward known disease genes. These proteins would be better studied, and known interactions with candidate disease proteins would have been investigated by the community already. This bias can already be seen in the HPRD benchmark results, but it can be quantified more directly by the proportion of the interacting proteins that are known disease proteins. Here once again the bias is clear—the proportion of interacting proteins that occurs in the heterogeneous disease protein set is twice as high for the HPRD set as for the high throughput sets, and is well over twice the proportion of Ensembl proteins in the disease protein set (table 3).
Overrepresentation of heterogeneous disease genes in HPRD protein interaction set (χ2 test).
Interestingly, even the high throughput sets are enriched for disease genes. This suggests that genetically heterogeneous disease proteins are more likely to have protein–protein interactions, or that they have more easily detectable interactions.
Protein–protein interactions add as much information as localization
Hereditary diseases do not always have genetic loci associated with them. It is therefore interesting to see how much protein–protein interactions can at all predict the candidate disease gene pool in the absence of any genetic localisation data. When disregarding localisation information entirely in the benchmark disease gene set, the combined high throughput protein–protein interaction set still has a prediction accuracy of 0.7%. This is two orders of magnitude higher than the chance of randomly picking the disease protein from the entire genome and is of the same order of enrichment as genetic localisation, which generally reduces the candidate gene pool from ∼20 000 to ∼100. Combining these two information sources enriches the candidate gene pool a further order of magnitude to a one in 10 chance (12%) of picking the right disease gene (fig 2), which corresponds to a 1000-fold enrichment relative to the entire genome.
Needless to say, the HPRD interaction set performs much better than the combined high throughput set, resulting in a prediction accuracy of 6.6% when localisation data are disregarded. This corresponds to a 1000-fold enrichment even before localisation is taken into account. Once again, combining this with localisation information leads to a further 10-fold enrichment resulting in the 58% accuracy found in this study.
DISCUSSION
The hypothesis being investigated here is that interacting proteins would often lead to similar disease phenotypes when mutated, enabling the usage of protein–protein interactions to suggest candidate disease genes. Our results suggest that this is indeed the case. Given the average locus size of close to 100 genes and high throughput interaction benchmark accuracies of 9–17%, positional candidate genes that interact with known disease genes have a more than 10-fold higher likelihood of being disease causing genes than random locus genes.
There are several practical limitations to the degree to which protein–protein interactions can predict disease gene candidates. To begin with, high throughput protein–protein interaction sets—especially yeast two-hybrid sets—are inherently noisy and contain a lot of interactions with no biological relevance.10,11,13,14 Therefore we might be predicting a disease gene based on an interaction that does not occur in vivo, but which did erroneously appear in a yeast two-hybrid assay. Indeed, only 5.8% of the human, fly, and worm Y2H interactions were confirmed by the HPRD, even among proteins common to both sets. However, given the Y2H set prediction accuracies of over 10% and the fact that the HPRD is not exhaustive, the proportion of Y2H interactions that are genuine is probably substantially higher than this figure suggests. Nevertheless, these high noise levels could reduce the accuracy of the Y2H based predictions relative to other techniques, as evidenced by the higher performance of the mainly protein complex purification based yeast interaction set.
Another practical limitation is the mapping of the high throughput interactions from other species to human proteins. In this study, when a protein in the other species had multiple human orthologues, the interaction was transferred to all of them. However, this need not be the case in reality. Encouragingly, we have previously shown that interactions between proteins are quite conserved across species and that conserved interactions tend to involve functionally related proteins.29 Also, the yeast set outperforms the other sets despite its evolutionary distance to humans—though this may reflect the fact that most yeast interactions were from more reliable protein complex purification experiments rather than yeast two-hybrid assays.
Apart from the protein interactions, the designation of the candidate disease loci can also be a source of noise. Some of the candidate disease loci were designated based on incorrect reasoning, or faulty linkage assignment. For instance, we have recently shown that a family with EEC syndrome linked to chromosome 19 (EEC2, OMIM 602077)30 actually has a mutation in the P63 gene denoted EEC3 (OMIM 604292) which is localised on human chromosome 3q27.31 However, the EEC2 locus remains in OMIM as a separate EEC locus with unidentified causative gene.
Furthermore, the use of cytogenetic bands to designate disease loci in OMIM Morbid Map can lead to problems in locating the genes in the Ensembl database.
Though they do not have sharp boundaries in reality, the Ensembl database uses specific base pair positions (rounded off to the nearest 100 kb) as band boundaries. Thus genes lying in the vicinity of a band boundary could easily be assigned to separate bands in published reports and in the Ensembl database. Indeed over 20% of the known disease genes in OMIM Morbid Map are associated with loci that differ from their Ensembl annotation. Most of these genes lie between 1 Mb and 10 Mb of their Morbid Map annotated loci on the same chromosome. The use of markers instead of cytogenetic bands could improve this; however, OMIM Morbid Map does not include marker information.
Finally, phenotypically similar diseases can be functionally related, even though they are classified as different diseases. As this study used pre-existing disease classifications rather than systematic phenotypic similarity analysis, potential links between disease genes causing similar but differently classified disease phenotypes would be overlooked. This would reduce the number of predictions made, without affecting the accuracy of those predictions that have been made.
All these practical limitations reduce the accuracy of the predictions, meaning that the true degree to which proteins involved in the same genetic disease interact is likely to be much higher. With higher quality protein interaction sets, more precise locus demarcation, and more systematic disease phenotype descriptions the value of this approach to disease gene prediction should increase even further.
Apart from the practical limitations, there are fundamental limits to the prediction capacity of protein–protein interactions. Two interacting proteins need not lead to similar disease phenotypes when mutated—for instance, they may have different but overlapping functions or one may be more dispensable than the other. Also, disease proteins may lie at different points in a molecular pathway and need not interact with each other directly. Disease mutations need not even involve proteins, as is the case with TERC (telomerase RNA component) in congenital autosomal dominant dyskeratosis (see table 2). Protein–protein interactions will thus not be capable of detecting every novel disease protein. Despite these fundamental limitations, the high proportion of disease proteins among correctly localised HPRD interaction partners is promising, although this interaction set is biased. And despite their practical limitations, even the high throughput datasets have prediction accuracies of up to 17%. Thus, in the absence of practical limitations, these fundamental limitations should result in a prediction accuracy that lies between these two values.
Outlook
This study provides evidence that the systematic use of protein–protein interaction data may lead to an approximately 10-fold improvement in positional candidate gene prediction. At the same time, the quality and quantity of the data available can be much improved. Though around 73 000 interactions between almost 11 000 proteins were used in this study, the actual number of interactions between these proteins should be much greater as all interaction assaying techniques miss large numbers of interactions.6,7 In addition, a more systematic phenotypic classification of diseases, such as our recently developed text mining approach,32 may lead to more interactions between related disease genes being identified. With increasing quantity and quality of interaction and phenotypic data and more dense interaction networks, the performance and utility of this approach to disease gene prediction should improve even further.
Acknowledgments
We thank Bas Dutilh for doing the orthology determination, and Gert Vriend, Marc van Driel, René van der Heijden, Vera van Noort, and Toni Gabaldon for discussions and suggestions. This work is part of the BioRange programme of the Netherlands Bioinformatics Centre (NBIC), which is supported by a BSIK grant through the Netherlands Genomics Initiative (NGI).
REFERENCES
Supplementary materials
Files in this Data Supplement:
Footnotes
-
Published Online First 12 April 2006
-
Conflicts of interest: none declared.