Article Text

Abstract
Background Genomic CNVs increase the risk for early-onset neurodevelopmental disorders, but their impact on medical outcomes in later life is still poorly understood. The UK Biobank allows us to study the medical consequences of CNVs in middle and old age in half a million well-phenotyped adults.
Methods We analysed all Biobank participants for the presence of 54 CNVs associated with genomic disorders or clinical phenotypes, including their reciprocal deletions or duplications. After array quality control and exclusion of first-degree relatives, we compared 381 452 participants of white British or Irish origin who carried no CNVs with carriers of each of the 54 CNVs (ranging from 5 to 2843 persons). We used logistic regression analysis to estimate the risk of developing 58 common medical phenotypes (3132 comparisons).
Results and conclusions Many of the CNVs have profound effects on medical health and mortality, even in people who have largely escaped early neurodevelopmental outcomes. Forty-six CNV–phenotype associations were significant at a false discovery rate threshold of 0.1, all in the direction of increased risk. Known medical consequences of CNVs were confirmed, but most identified associations are novel. Deletions at 16p11.2 and 16p12.1 had the largest numbers of significantly associated phenotypes (seven each). Diabetes, hypertension, obesity and renal failure were affected by the highest numbers of CNVs. Our work should inform clinicians in planning and managing the medical care of CNV carriers.
- cnv
- UK biobank
- medical
Statistics from Altmetric.com
Introduction
Genomic CNVs are structural alterations to chromosomes of >1000 bases in length that can intersect multiple genes.1 Specific CNVs have been shown to increase risk for autism spectrum disorders,2 developmental delay and other neurodevelopmental disorders,3 and schizophrenia.4 Apart from their association with neurodevelopmental and psychiatric outcomes, these CNVs can lead to medical disorders. Several CNVs, for example, deletions at 22q11.2,5 have been extensively studied on hundreds of carriers and their medical consequences are well established. However, for CNVs with lower penetrance, very rare CNVs or several reciprocal deletions/duplications of known genomic disorders, the associated medical phenotypes have not been identified. Moreover, most research has been performed on children and young people referred to genetic clinics,3 6 creating a strong referral bias towards recording high rates of developmental delay, early-onset medical conditions and more adverse outcomes. Most CNVs display incomplete penetrance,7 resulting in apparently unaffected adult carriers in the general population. The rate of medical outcomes in later life of CNV carriers, or in the general population as a whole, has not been addressed in adequately powered studies to date.
The establishment of the UK Biobank presents a unique opportunity to examine the spectrum of medical outcomes of CNVs in middle-aged and old-aged people, as all half a million participants have been assessed with identical methods and blindly to their CNV status. The Biobank collects longitudinal data from hospital admissions, self-report, death certificates, cancer registries and primary care (general practitioners’) records. Here, we report on the medical consequences of carrier status for 54 CNVs that are recognised as associated with clinical phenotypes or genomic disorders,3 6 8 including their reciprocal deletions/duplications.
Methods
Participants
The UK Biobank recruited just over half a million people from the general population of the UK, using National Health Service patient registers, with no exclusion criteria. Participants have consented to provide personal and health information, urine, saliva and blood samples, and to have their DNA tested. We obtained approval from the UK Biobank to analyse the CNVs in project 14421: ‘Identifying the spectrum of biomedical traits in adults with pathogenic copy number variants (CNVs)’.
Participants were between 40 and 69 years of age at the time of recruitment between 2006 and 2010. As the lifetime prevalence of disorders often varies by ancestry, we restricted the analysis to those participants who declared themselves as ‘white British or Irish’: 421 268 participants who passed our genotyping quality control (QC) filters (CNV calling). After exclusion of first-degree relatives, 396 725 subjects were retained for analysis, 53.8% of whom were female. The mean age at the end of the current follow-up interval for medical outcomes (in 2016) was 64.7 years, SD=8.0 years.
CNV calling
Samples were genotyped at the Affymetrix Research Services Laboratory, Santa Clara, California, USA, on two arrays with 95% common content between them: around 50 000 samples were genotyped on the UK BiLEVE Array (807 411 probes) and the remaining samples on the UK Biobank Axiom Array (820 967 probes).9 We downloaded the anonymised genotypic data from the UK Biobank as 488 415 raw (CEL) files and analysed them with the methods we reported previously.10 Briefly, we generated normalised signal intensity data, genotype calls and confidences, using ~750 000 biallelic markers. These were then processed with PennCNV-Affy software.11 Individual samples were excluded if they had >30 CNVs, a waviness factor >0.03 or <−0.03, a call rate <96% or log R ratio SD >0.35. A total of 25 069 files were excluded after this QC (5.1%). Individual CNVs were excluded if they were covered by <10 probes or had a density coverage of less than one probe per 20 000 base pairs.
Choice of CNVs
We compiled a list of 92 CNVs in 47 genomic locations from two widely accepted sources that proposed largely overlapping sets of CNVs (online supplementary table 1 in supplementary material).3 6 The authors of these studies used information from databases, reviews and publications to produce lists of CNV regions that lead to genomic disorders, congenital malformations, neurodevelopmental or other clinical phenotypes. We refer to this set of 92 CNVs as ‘pathogenic’, consistent with the criteria proposed by the American College of Medical Genetics standards which describe as pathogenic those CNVs that have been documented as clinically significant in multiple peer-reviewed publications, even if penetrance and expressivity of the CNV are known to be variable.12 Many (but not all) have been shown to statistically increase the risk for developmental delay.3 Online supplementary table 1 lists the sources for selection and our criteria for inclusion in analysis. Several overlapping or adjacent CNVs listed as separate loci in the original publications were grouped together (eg, the ‘small’ and the ‘common’ 22q11.2 or the ‘small’ and the ‘large’ 16p13.11 deletions/duplications). As a rule, the reciprocal deletions/duplications of known genomic disorders were also included by the above authors and by us, in order to examine their medical consequences, even if the evidence for their pathogenicity has not been established.
Supplementary file 1
The criteria for calling CNVs that do not span the full critical region are given in online supplementary table 2. As a rule, a CNV had to intersect at least 50% of the critical region, marked as ‘Location (hg19)’, and intersect the relevant candidate genes, if known. For single gene CNVs, we required deletions to intersect at least one exon, and duplications to span the whole coding region, as the functional consequences of partial gene duplications can be unpredictable, while deletions of any part of the coding sequence of a gene are likely to act as loss-of-function mutations. We observed several loci, mostly telomeric, where a number of small CNVs were preferentially called on arrays that failed QC (marked ‘Unreliable’ in online supplementary table 1). We excluded these loci from analysis in order to avoid potential false-positives on this genotyping platform. We also excluded from analysis CNVs with fewer than five observations in the full sample, as being too rare for statistical analysis (marked ‘Rare’ in online supplementary table 1). The above filtering left 54 CNVs for analysis (table 1).
List of 54 CNVs analysed in this study
Choice of medical phenotypes
Data on health outcomes were collected from several sources. Self-declared illnesses were disclosed by participants at their initial assessments and coded into 445 distinct categories. Hospital discharge diagnoses (primary and secondary) and death certificates contain over 11 000 International Statistical Classification of Diseases and Related Health Problems, 10th revision (ICD-10) codes assigned to at least one participant. Analysing each individual code separately against 54 CNV loci would result in small numbers of participants with each code and fail to provide the statistical power needed to detect true associations. To reduce the dimensionality of the data and therefore increase power and provide more meaningful results, we grouped together discrete disease entities into broader disease groups. A participant was coded as a ‘case’ if he/she had a relevant diagnosis on at least one occasion, in any of the above sources of information. We gave preference to common conditions and grouped disorders into recognised categories, based on organ, system or aetiology, while excluding from the current analysis infectious diseases, injuries and neuropsychiatric disorders (the latter being analysed separately). The disease codes used to construct each phenotype group are listed in online supplementary table 3. For myocardial infarction and stroke, we used the ‘adjudicated’ data provided by the UK Biobank (data fields 42 000 to 42 013). Phenotype groups found in fewer than 2000 participants were not included. The final list of disease groups contains 58 entities, including ‘death during follow-up’ obtained from the death registries. Data on cancer were taken only from the UK cancer registries, as collected and supplied by the UK Biobank, as this is the most reliable and complete resource for cancers in the UK. For the current work we considered all malignant cancers as a single phenotype. As risk for cancer was not significantly affected by CNVs as a group, and because most individual cancers affected relatively small numbers of patients, we did not analyse the cancers further by subtype.
Supplementary file 2
Statistical analysis
Analyses were performed in the statistical package R (version 3.3.2) using a Linux server. We examined the effect of the presence of a CNV on each medical phenotype with logistic regression analysis. As covariates, we used age, gender, array type (Axiom/BiLEVE), Townsend deprivation index (as a measure of the socioeconomic status) and the first 15 principal components from the genetic analysis, as provided by the UK Biobank. We used Firth’s bias-reduced logistic regression method,13 with the R library ‘logistf’, as it better handles cells with small numbers. We report the resulting p-values, ORs and 95% CIs for the ORs. We also report the uncorrected relative risk (RR), for having the phenotype in carriers of a specific CNV and non-carriers of any of the 54 CNVs. (RR is used for the additional images on our website (http://kirov.psycm.cf.ac.uk/), as it returns the more intuitive value of zero for associations with zero CNVs in cases.) Conservative Bonferroni correction for the testing of 54 CNVs×58 phenotypes gives a p<1.6×10⁻⁵ as a project-wide significance level. As many true-positive associations were expected, it is more appropriate to use the Benjamini-Hochberg false discovery rate (B-H FDR) for correction of p-values.14 Our preferred B-H FDR is 0.1.
Results and discussion
Quality control
The Affymetrix arrays produced reliable calls for the 54 CNVs. This is not surprising, given the large size and good probe coverage of these CNVs. This impression is confirmed by the remarkably similar CNVs frequencies, compared with those reported by us in previous control populations (online supplementary table 4 and supplementary figure 1). There were no apparent batch effects affecting the calls: the distribution of each CNV in the 106 batches produced no outliers from the expected Poisson distribution, after taking into account the multiple testing for 54 CNVs (online supplementary table 5). The best confirmation of the data quality would be the identification of well-known phenotypes associated with specific CNVs. This was indeed the case (table 2), as we identified, for example, the known associations of neuropathies and 17p12 deletions/duplications,15 obesity and deletions at 16p11.2 and 16p11.2 distal,16 17 diabetes and 17q12 deletions (also called ‘renal cysts and diabetes syndrome’).18 This increases our confidence that the newly identified associations are also real.
Supplementary file 3
CNV/Phenotype associations significant at FDR=0.1
Effects of CNVs on medical phenotypes
Each of the 54 CNVs was tested for association with each of the 58 medical phenotypes (a total of 3132 tests). Results are presented as ORs for risk of developing the phenotype, corrected for age, sex and the other covariates detailed in the Methods section. All results are presented in online supplementary table 6 (grouped by CNV) and in online supplementary table 7 (grouped by phenotype).
Supplementary file 4
Supplementary file 5
The top 14 significant phenotype/CNV associations (table 2) survive a Bonferroni correction for 3132 tests (a project-wide significant p-value threshold of 1.6×10⁻⁵). This correction is overconservative, due to medical comorbidities (eg, people with diabetes also have increased rates of heart attacks, stroke and others). A more appropriate correction of statistical significance for this analysis is the B-H FDR.14 There are 46 CNV/phenotype comparisons that were significant at an FDR=0.1 (table 2). Most of these are novel associations and none are protective for the tested phenotypes (all have OR >1).
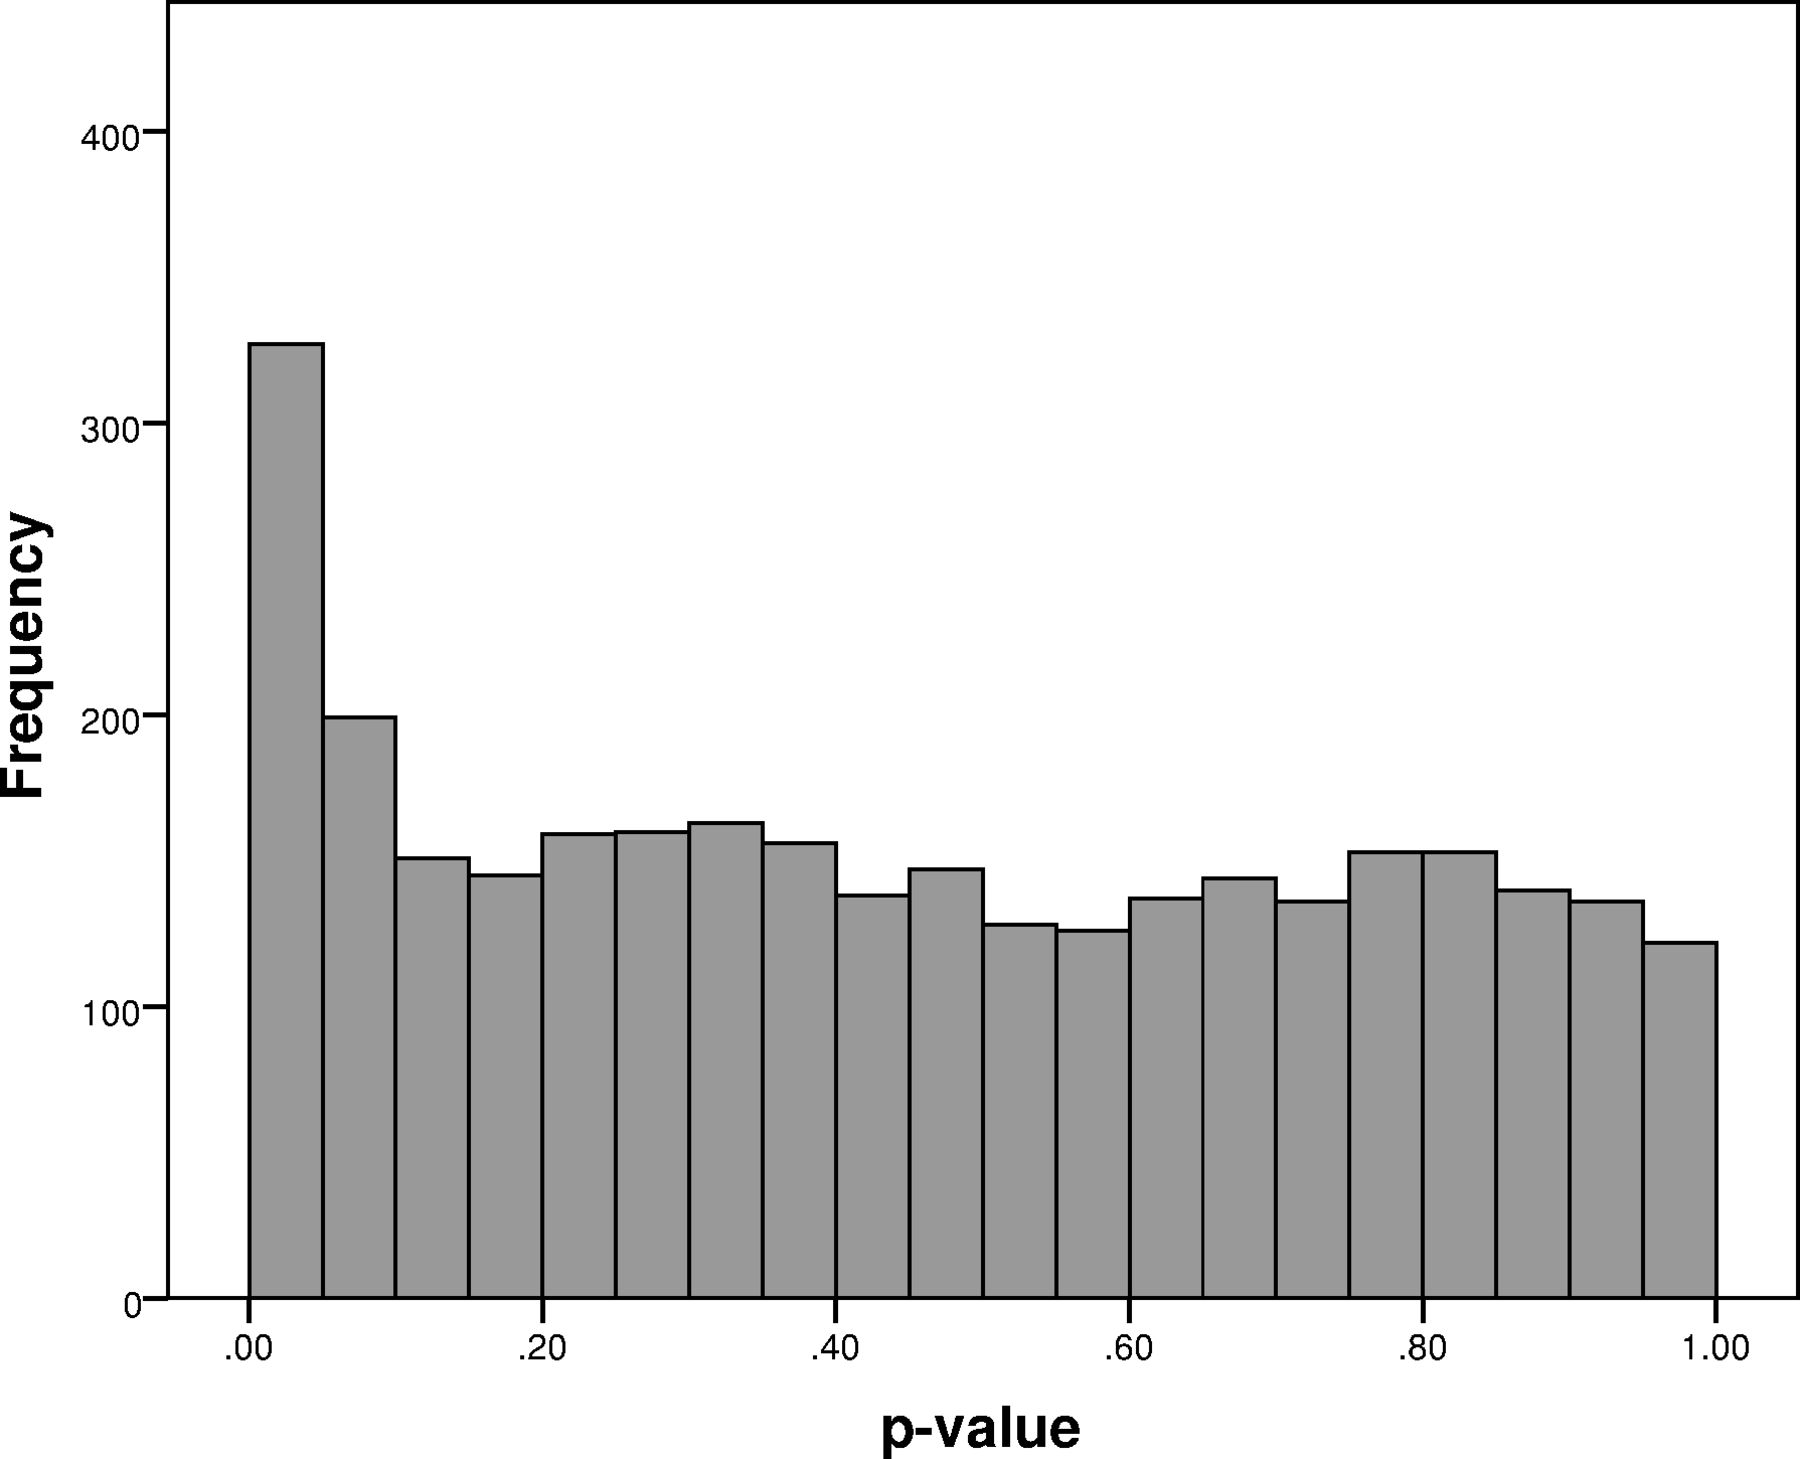
A total of 330 tests were nominally significant (at p<0.05), instead of the expected 157. Figure 1 shows the distribution of p-values, with a clear trend for over-representation below the p<0.1 level. This suggests that there are many more real associations, than those presented in table 2, but they cannot be identified with sufficient statistical significance in a sample of this size. Clinicians might therefore decide to also consider consequences of CNVs that do not survive our corrections.

Distribution of all 3132 p-values from CNV/phenotype associations. There are 330 nominally significant CNV/phenotype associations (p<0.05), instead of the 157 expected by chance.
Deletions at 16p11.2 and 16p12.1 had the largest numbers of significantly associated phenotypes (seven each). Deletions at 16p11.2 are a known risk factor for obesity.16 We now provide data showing that adult carriers also have a high incidence of diabetes, osteoarthritis and hypertension, possibly as expected consequences/comorbidities of obesity. Other associated phenotypes are not necessarily linked to a high body mass index (BMI), such as asthma, anaemia and renal problems, suggesting that this and other CNVs have pleiotropic effects (see conditional analysis below). This should be expected from CNVs intersecting multiple genes. This has already been shown for some large CNVs, for example, 22q11.2 deletions, where highly variable phenotypic presentations are the norm.5
We should point out that CNVs with higher numbers of significant results are not necessarily the most pathogenic ones, as significance depends also on CNV frequency, which is low for the most pathogenic CNVs in this population. Such CNVs are under-represented in the UK Biobank, as the participants are middle-aged and participation is subject to ‘healthy volunteer’ selection bias.19 For example, 22q11.2 deletions are highly pathogenic,5 but there were only 10 such carriers in the Biobank, instead of the expected ~100 (the rate of this deletion among newborns is ~1:4000).7 These 10 carriers were not sufficient to produce significant results at FDR=0.1, even for ORs>10 (online supplementary table 6). The more informative data from our research is on CNVs with lower penetrance, as they are more common.
The increased risk for medical morbidities or mortality observed in CNV carriers is unlikely to be due to the presence of early neurodevelopmental disorders or schizophrenia in carriers, as the UK Biobank population has largely escaped such conditions: only 34 of the 14 791 people who had one of the tested CNVs had schizophrenia, 17 had developmental delay and 4 had autism. Accidental death or death in epilepsy cannot account for the increased death rate in CNV carriers: out of the 504 CNV carriers who had died during follow-up, only 1 had ‘sudden unexpected death in epilepsy’ and another 4 had accidental deaths (motor/pedal cyclist acidents and falls from a high place). All death causes in CNV carriers, according to the death registries, are listed in online supplementary table 8.
Supplementary file 6
Phenotypes most likely to be affected by CNVs
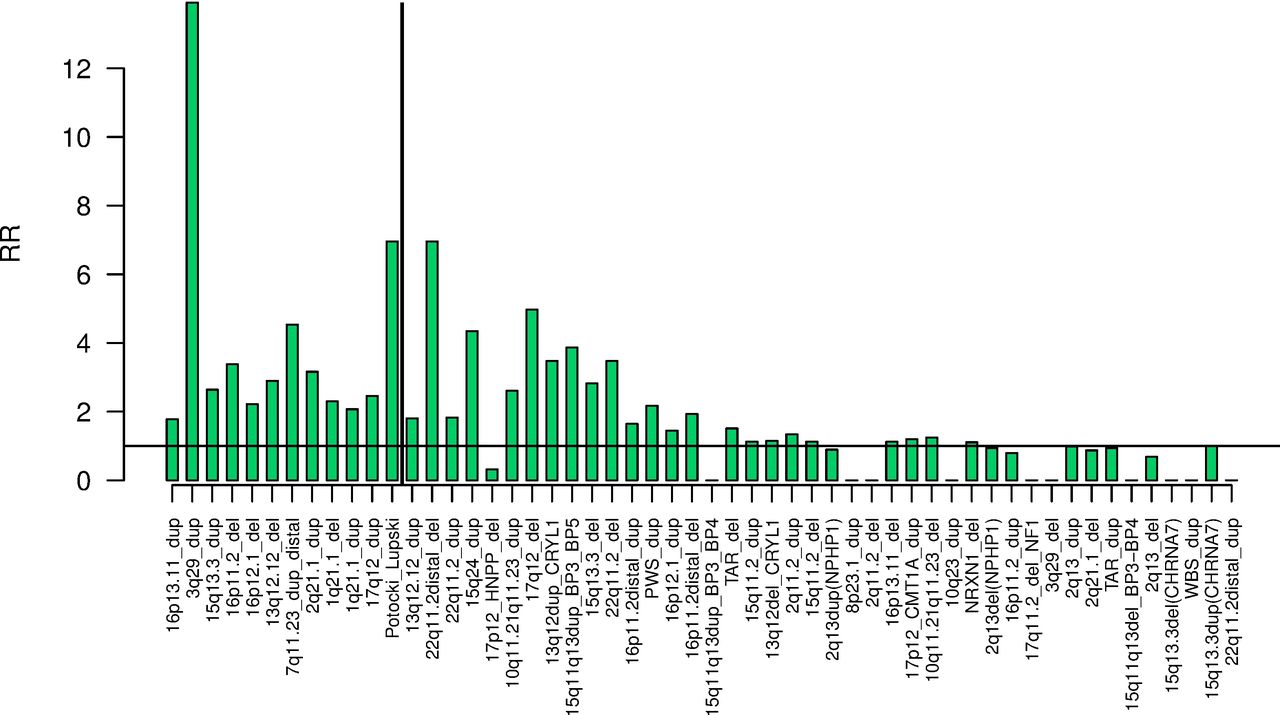
Diabetes, hypertension, obesity and renal failure were the phenotypes affected by the highest number of CNVs (table 2). The real number of affected phenotypes by the CNVs is probably much higher, as suggested in figure 1. We can provide further evidence for this, by testing the effect on the phenotypes in the group of pathogenic CNV carriers as a whole, thus substantially increasing the statistical power. After excluding the five relatively common CNVs : deletions and duplications at 15q11.2 and 2q13(NPHP1) and duplications at 15q13.3(CHRNA7) (as they would determine the results due to their high frequencies), the remaining 4782 carriers of 49 rare CNVs had significantly increased risk for developing 26 of the 58 tested phenotypes (figure 2). Hypertension, diabetes, cardiac, respiratory and renal disorders dominate the top results. These are common phenotypes that increase mortality. We do indeed observe an increased death rate among CNV carriers during the follow-up period of Biobank participants (death was the second most-significant phenotype, figure 2). The RR of death from each CNV is presented in figure 3, where the RRs are ordered by the statistical strength of the association (strongest p-value on the left). The vertical line demarcates the 12 CNVs that are nominally significantly associated with increased mortality (p<0.05). Not surprisingly, the more pathogenic CNVs were also associated with increased mortality. The top significant CNV was, unexpectedly, the relatively common duplication at 16p13.11, found in ~0.2% of the general population, an association that has not been outlined before.

ORs and 95% CI for the ORs for developing the 58 tested phenotypes in carriers of any one of the 49 rare pathogenic CNVs. The phenotypes are ordered by the strength of the p-value. COPD, chronic obstructive pulmonary disease; MI, myocardial infarction, WBC, white blood cell count.
Relative risk (RR) for dying during the follow-up to 2016 for carriers of the 54 CNVs. The CNVs are ordered by the strength of the significance (strongest result on the left, for 16p13.11 duplications). The vertical line demarcates the nominally significant results (p<0.05). Due to zero observations in cases for some CNVs, RRs are shown, instead of ORs.
Most of the reported associations are novel, although some of them can be explained as logical adult medical consequences of known, early-onset phenotypes, for example, obesity leading to diabetes, hypertension and increased cardiovascular mortality. In order to test this possibility, we performed a conditional analysis of three CNVs and two phenotypes, where obesity is most likely to account for some or all of the associations, by adding the BMI as a new covariate to the original analysis. This analysis amounted to 276 independent tests, to which we applied again the Benjamini-Hochberg FDR method to establish which associations remained significant at FDR=0.1, after controlling for BMI. Obesity is a well-established phenotype of 16p11.2 classic and distal deletions. The results and comparisons with the original analysis for all phenotypes and these two CNVs are shown in online supplementary tables 9 and 10 and supplementary figures 2 and 3. For 16p11.2 classic deletion, four of the six originally significant associations at FDR=0.1 remained significant (excluding obesity from these numbers). The changes in the ORs give a better global impression of the changes (online supplementary figure 2) and indicate that several associations are much reduced: diabetes type 1 and 2, hypertension, high cholesterol, gout and ostheoarthritis. This indicates that these disorders are, to a large extent, consequences of obesity. However, the ORs for anaemia and asthma did not change substantially. 16p11.2 distal deletions showed smaller reductions in the ORs (online supplementary figure 3) and four phenotypes (excluding obesity) remain significant at FDR=0.1. This pattern suggests that other factors also play a role in the causation of phenotypes in carriers of this CNV. Although deletions at 16p12.1 have not been an established cause for obesity, the pattern of results (table 2) also raised the question as to whether the multiple associated phenotypes could be explained by obesity. Therefore, we included this CNV in the conditional analysis (online supplementary table 11 and supplementary figure 4). Increased BMI appeared to play a smaller role in the causation of disease phenotypes for this CNV, with small changes in the ORs and the number of significant results.
Somewhat counterintuitively, the association with obesity does not get fully abolished when the analysis is corrected for BMI. There are, however, several factors that can explain this apparent anomaly. Most relevantly, the phenotype ‘obesity’ is not equivalent to high BMI. It is a hospital ICD-10 diagnosis, made on a small proportion of people who have a BMI>30. In fact, 24.3% of the Biobank population has a BMI>30, qualifying them for a diagnosis of obesity, but only 9.2% of them received this diagnosis. Furthermore, obesity is a categorical variable, while BMI is a continuous one, making them not equivalent from a statistical point of view, and therefore adjusting an analysis of one for another does not necessarily remove all evidence for association. The distribution of BMI values is very different in the three CNVs tested: 71.6% of 16p11.2 deletion carriers had a BMI>30, compared with 55.6% of 16p11.2 distal deletion carriers and 37% of 16p12.1 deletion carriers (online supplementary figure 5a–c). ICD-10 diagnosis of ‘obesity’ was given to correspondingly smaller proportions of carriers: 18.6%, 16.7% and 9.8%. These differences could explain why correcting for BMI does not lead to identical changes to the associations of the three CNVs.
We also tested whether increased BMI accounted for associations of diabetes type 2 or mortality with any of the 54 CNVs (online supplementary tables 12 and 13 and supplementary figures 6 and 7). As already reported above, this was the case for diabetes and the ‘classic’ and ‘distal’ 16p11.2 deletions. However, for 1q21.1and 2q13 duplications, 22q11.2 distal deletions and 17q12 deletions (also known as ‘renal cysts and diabetes syndrome’), the ORs for diabetes increased, suggesting that these CNVs have a more direct effect on the development of diabetes. In total, six CNVs were significantly associated with diabetes, after controlling for BMI (online supplementary table 12). The associations with mortality remained essentially unchanged after correction with BMI, with four significantly associated CNVs (online supplementary table 13) and very similar ORs (online supplementary figure 7), indicating that obesity is only one of many consequences that shortens the lives of CNV carriers.
Homozygous deletions and more than one CNV per person
Only four carriers of homozygous deletions were found, perhaps not surprisingly for this relatively healthy population. Three of these clustered in a single locus, 2q13 (11 086–11 098 kb), affecting the gene NPHP1. Homozygous deletions at this locus are known to cause the kidney disorder juvenile nephronophthisis. All three Biobank individuals with homozygous deletions at NPHP1 had renal failure (Fisher’s exact test p=9×10⁻⁶). We also examined the data for the occurrence of two CNVs in the same person. 264 people carried two of these CNVs, not significantly different from the 249 expected by chance. All combinations of two CNVs observed in the same person are presented in online supplementary table 14.
Monitoring of CNV carriers
Our results indicate a need for regular medical monitoring of apparently healthy carriers of specific pathogenic CNVs. Examples include monitoring for blood pressure, kidney function and glucose levels for carriers of 16p12.1 and 16p11.2 deletions, and for cancer in 3q29 duplication carriers. Apart from specific medical phenotypes, it appears that such carriers require enhanced medical monitoring in general, as their health can be affected in multiple ways. Our results should enable clinicians to better plan the medical management of CNV carriers.
Finally, the reported CNV morbidity map can provide researchers with another avenue for the elucidation of pathophysiological disease mechanisms.
Acknowledgments
This research has been conducted using the UK Biobank Resource under Application no: 14421.
References
Footnotes
Contributors KC, MB-S and DO analysed the data; KMK, ER and MB-S called the CNVs; AFP and ME contributed to the bioinformatics and website design; VE-P, JTRW, MCO’D and MJO contributed to the statistical analysis; JTRW, MCO’D and MJO edited the paper; GK conceived the project, drafted the paper and took part in all analysis steps.
Funding The work at Cardiff University was funded by the Medical Research Council (MRC) Centre Grant (MR/L010305/1) and Programme Grant (G0800509).
Competing interests None declared.
Patient consent Not required.
Ethics approval Ethical approval for the study was granted by the North West multi-centre ethics committee.
Provenance and peer review Not commissioned; externally peer reviewed.
Data sharing statement All CNV calls will be made available to the UK Biobank, in accordance with their requirements, within 6 months of the first publication of results.