

Abstract
The arrival of farming in Europe beginning around 8,500 years ago required adaptation to new environments, pathogens, diets, and social organizations. While evidence of natural selection can be revealed by studying patterns of genetic variation in present-day people1-6, these pattern are only indirect echoes of past events, and provide little information about where and when selection occurred. Ancient DNA makes it possible to examine populations as they were before, during and after adaptation events, and thus to reveal the tempo and mode of selection7,8. Here we report the first genome-wide scan for selection using ancient DNA, based on 83 human samples from Holocene Europe analyzed at over 300,000 positions. We find five genome-wide signals of selection, at loci associated with diet and pigmentation. Surprisingly in light of suggestions of selection on immune traits associated with the advent of agriculture and denser living conditions, we find no strong sweeps associated with immunological phenotypes. We also report a scan for selection for complex traits, and find two signals of selection on height: for short stature in Iberia after the arrival of agriculture, and for tall stature on the Pontic-Caspian steppe earlier than 5,000 years ago. A surprise is that in Scandinavian hunter-gatherers living around 8,000 years ago, there is a high frequency of the derived allele at the EDAR gene that is the strongest known signal of selection in East Asians and that is thought to have arisen in East Asia. These results document the power of ancient DNA to reveal features of past adaptation that could not be understood from analyses of present-day people.
We analyzed genome-wide data from 83 ancient individuals who lived in Europe over the last eight thousand years. The data for 64 samples was obtained by using in-solution hybridization with synthesized oligonucleotide probes to enrich ancient DNA libraries for 394,577 single nucleotide polymorphisms (SNPs), including 29,075 chosen based on evidence of functional importance9. We merged this data with shotgun sequence data from 19 published samples7,10-13 and co-analyzed these ancient samples with 503 present-day European samples from five populations from phase 3 of the 1000 Genomes Project14. After quality control, we were left with 364,618 SNPs genome-wide, and a mean effective sample size of 81 chromosomes at each SNP (Table 1, Methods).
Samples analyzed in this study. Population: samples grouped by a combination of date, archaeology and genetics. Population: Labels used in Ref. 9. Location: Present-day country where samples originated. In the main text, we refer to samples from present-day Spain, Germany, Hungary and Sweden as Iberian, Central European, Eastern European and Scandinavian, respectively. Sample size: Number of individuals sampled. Majority size: Average over sites of the number of chromosomes observed at each SNP targeted, if we make a single majority call at each site for each individual. Equivalently, the average number of samples hit at least once. Diploid size: Average over sites of the effective number of chromosomes when we use genotype likelihoods. Computed as 2 per sample for samples with genotype calls, or 2 − 0.5(c−1) for samples with read depth c. Date: Mean of the best date available for the samples in each population, thousands of years before present. Reference: Original reference for each sample (and specific sample names, where appropriate).
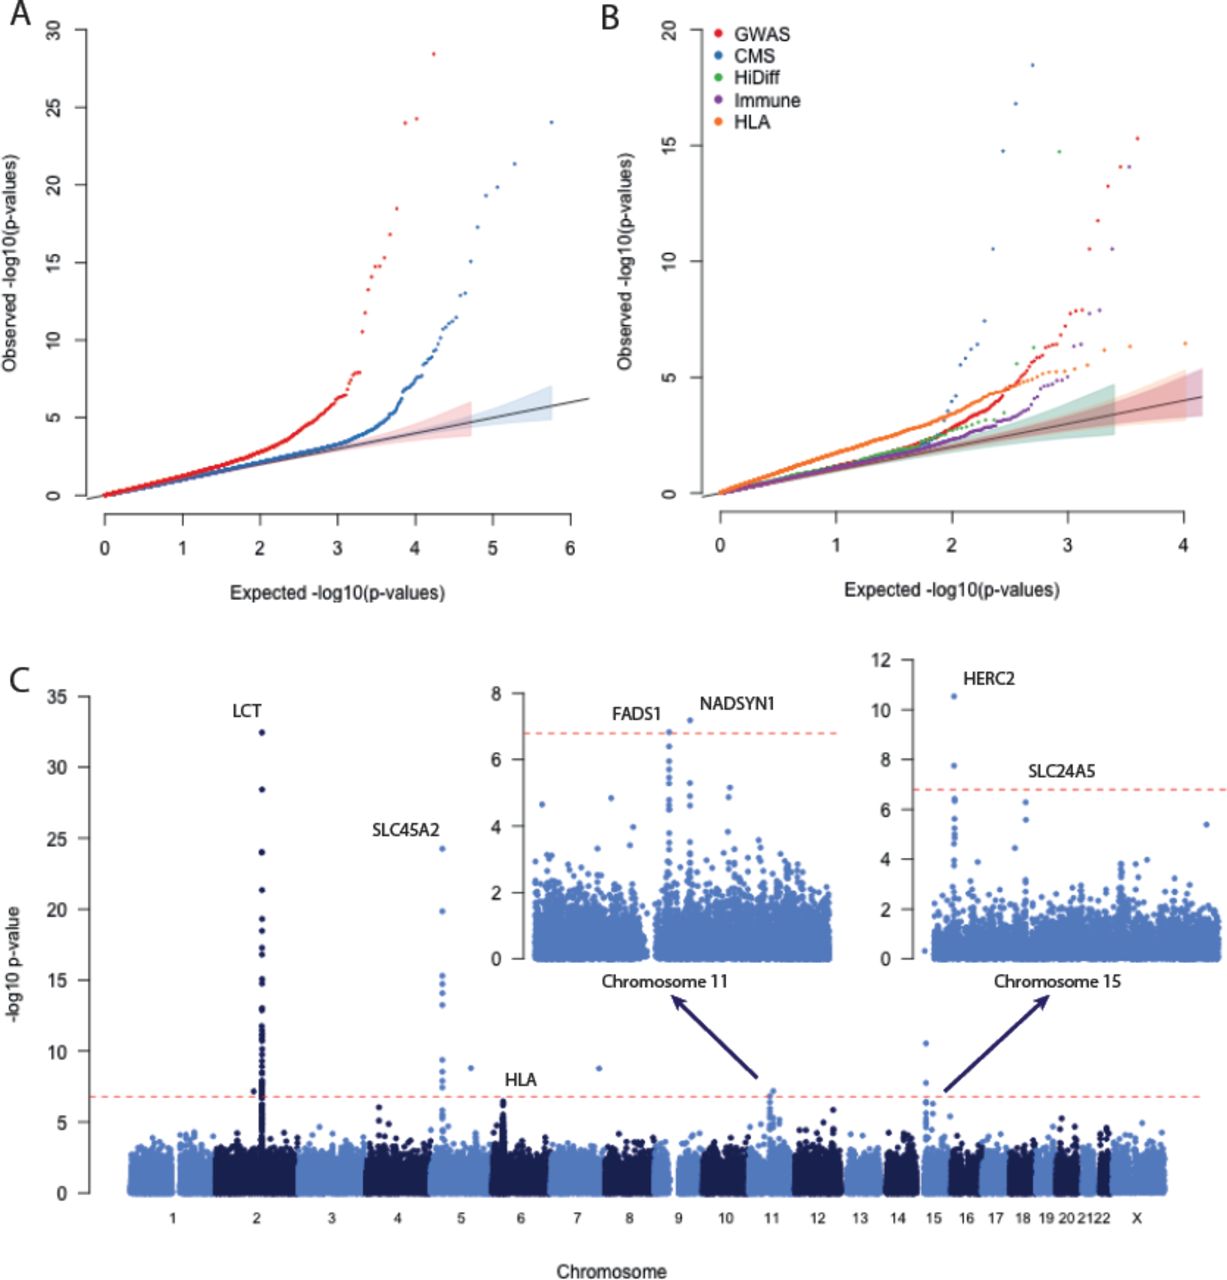
Present-day European populations can be modeled as a mixture of three ancient populations: western hunter-gatherers, early European farmers, and Yamnaya pastoralists from the Pontic-Caspian steppe9,11, all of which are represented by samples in our study. To scan for selection, we tested every SNP to evaluate whether its observed frequency distribution across present-day Europeans from the 1000 Genomes Project was consistent with this model (Figure 1, Extended data Figure 1, Methods). SNPs with frequencies in present-day populations that are inconsistent with a neutral mixture of the ancestry of the ancient populations are likely to be influenced by selection. A strength of this test is that it does not make the simplifying assumption of population continuity over time, which is problematic in light of the population replacements that are now known to have occurred in many places in the world including in Europe9,11,15. Of the 307,494 non-monomorphic SNPs that we tested, the 25,017 that were in the set of potentially functional SNPs were, as a group, significantly more inconsistent with the model than neutral SNPs (Figure 1A). This result held across all SNP categories, including genome-wide association study (GWAS) hits and human leukocyte antigen (HLA) haplotype tag SNPs (Figure 1B), suggesting pervasive selection on polymorphisms of biological importance.

Fine scale maps of genome wide significant signals of selection. In each case, the most significant SNP is labeled, and other SNPs are colored according to their LD with the most significant SNP. The blue line shows the recombination rate and the lower panel in each plot shows gene locations.

Genome-wide scan for selection. A: Quantile-quantile (QQ) plot of -log10 p-value for potentially functional SNPs (red) and probably neutral SNPs (blue), after genomic control (GC) correction. B: QQ plots for different categories of potentially functional SNPs (Methods). All curves are significantly different from neutral expectation. C: Plot showing the GC-corrected –log10 p-value for each marker. The red dashed line represents a genome-wide significance level of 10-6.79. Insets show chromosomes 11 and 15 on a larger scale.
Using a conservative significance threshold of p=1.6× 10⁻⁷ (0.05/307,494), and a genomic control correction of 1.21 (Ref. 16), we identified five loci that contained SNPs achieving genome-wide significance. Three of these have previously been identified as targets of selection8,17-19: the LCT lactase persistence locus (rs4988235, p=4.8× 10⁻³³), the SLC45A2 pigmentation locus (rs16891982, p=6.9× 10⁻²⁵) and the HERC2/OCA2 eye color locus (rs12913832, p=3.2× 10⁻¹¹). We also identified two novel signals at NADSYN1 (rs7940244, p=7.1× 10⁻⁸) and FADS1 (rs174546, p=1.6× 10⁻⁷) (Figure 2C, Extended Data Figure 1). All of these signals except FADS1 remained significant in a less powerful but more robust analysis in which we called a single majority allele for each sample at each site instead of computing genotype likelihoods (Extended Data Figure 2).

Genome wide scan for selection using majority called alleles. As Figure 1 in the main text but calling a single majority allele for each site for the ancient samples. A: QQ plot of neutral (blue) and possibly functional (red) sites. B: QQ plot of possibly functional sites broken down by category. C: ManhaDan plot of scan results.

Time series of derived allele frequencies for alleles with genome-wide significant signals of selection, or otherwise mentioned in the text. A: Estimated mainland European frequencies. Boxes show the estimated frequency and approximate time range of the observations. Small numbers give the effective sample size as described in Table 1. B: Frequencies in other ancient populations. C: Frequencies in modern European populations from the 1000 Genomes Project.
The SNP (rs4988235) responsible for lactase persistence in Europe20,17 gives the strongest signal in our analysis. We estimated the selection coefficient on the derived allele to be 0.015 (95% confidence interval; CI=0.010-0.034) using a method that fits a hidden Markov model to the population allele frequencies as they change over time21. Our data strengthens previous reports of the late appearance of lactase persistence in Europe7,22, with the earliest appearance of the allele in a central European Bell Beaker sample (individual I0112) who lived approximately 4,300 years ago. We detect no evidence of lactase persistence in Early Neolithic farming populations like the Linearbandkeramik (LBK), or in the steppe pastoralist Yamnaya, despite their use of domesticated cattle (Figure 2).
We also found evidence of selection at two loci that affect skin pigmentation. The derived alleles of rs1426654 at SLC24A5 and rs16891982 at SLC45A2 are, respectively, fixed and almost fixed in present-day Europeans23,24. As previously reported7,11,12, both derived alleles are absent or very rare in western hunter-gatherers. suggesting that mainland European hunter-gatherers may have had dark skin pigmentation. SLC45A2 first appears in our data at low frequency in the Early Neolithic, and increases steadily in frequency until the present, when it has frequency 1 in all populations except Spanish (IBS, Figure 2; estimated selection coefficient ŝ =0.020, CI=0.011-0.031). In contrast, the derived allele of SLC24A5 increases rapidly in frequency to around 0.9 in the Early Neolithic, suggesting that most of the increase in frequency of this allele is due to its high frequency in the early farmers who migrated to Europe from the southeast at this time, although there is still strong evidence of ongoing selection after the arrival of farming (p=5.5× 10⁻⁷, ŝ =0.025, CI=0.003-0.21).
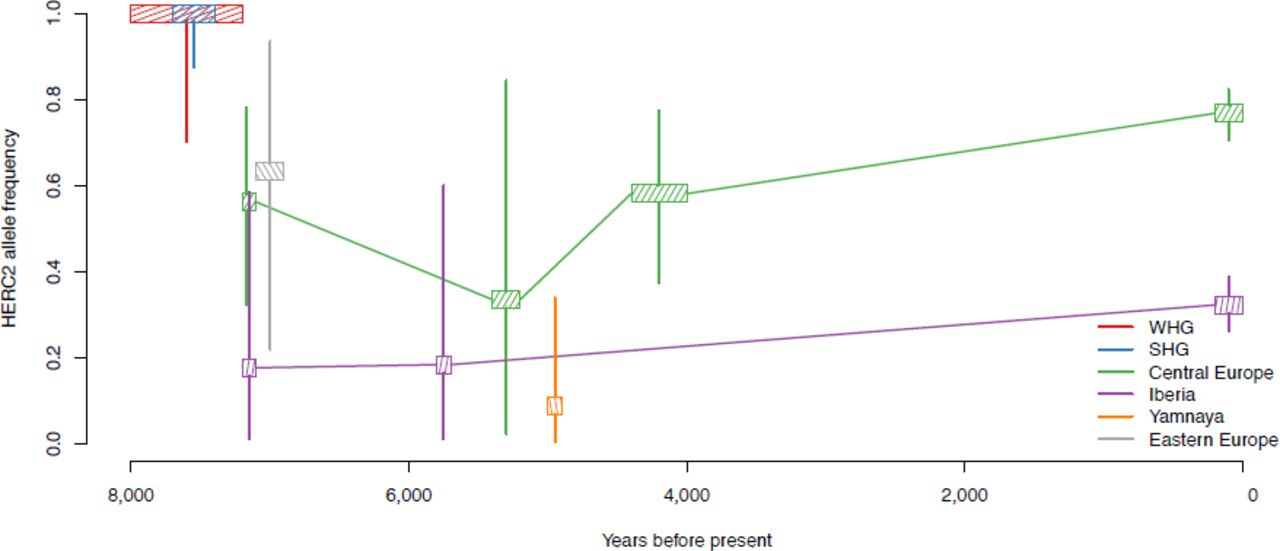
The derived allele of rs12913832 at the HERC2/OCA2 locus is the primary determinant of blue eyes in Europeans, and may also contribute to light skin and hair pigmentation25-28. Our analysis detects a genome-wide signal of selection at this locus, but instead of the signal being one of positive selection with a coefficient of 0.036 as in a previous study of ancient DNA in the eastern Europe steppe8, our signal is of weakly negative selection (ŝ =-0.007, CI = -0.011 to -0.001). One possible explanation is local adaptation: that the allele is advantageous in the north and disadvantageous in the south of Europe. This hypothesis is supported by the fact that our data shows that an extreme north-south gradient in allele frequencies has been maintained in Europe for the last 8,000 years (Figure 2C, Extended data Figure 3).

Estimated frequencies of the derived allele of rs12913832 in HERC2. We divided our samples by date and location. Boxes show the maximum likelihood estimate of the frequency as in main text Figure 2 and vertical lines show approximate 95% confidence intervals.
The remaining two genome-wide signals are both located on chromosome 11 in the genes FADS1 and NADSYN1. FADS1 (and its linked family member FADS2), are involved in fatty acid metabolism, and variation at this locus is associated with plasma lipid and fatty acid concentration29-31. The derived allele of the most significant SNP in our analysis, rs174546, is associated with decreased triglyceride levels31. This locus is therefore a plausible target of selection related to changes in diet. Variants at NADSYN1 (and the nearby DHCR1), have been associated with circulating vitamin D levels32,33 and the most associated SNP rs7940244 in our dataset is highly differentiated across closely related Northern European populations34,35, suggesting the possibility of selection related to variation in environmental sources of vitamin D.
We find a surprise in seven Scandinavian hunter-gatherers from the Motala site in southern Sweden who lived around 7,700 years before present. While the western hunter-gatherers of central and southern Europe largely have the ancestral allele at the two major European skin pigmentation loci, the closely related Scandinavian hunter-gatherers have both the derived alleles contributing to light skin pigmentation at high frequency (Figure 2B). Thus, the derived allele of SLC24A5 was common in both the Scandinavian hunter-gatherers and Early European farmers, but not in the geographically intermediate western hunter-gatherers. Further, in four out of seven Motala samples, we observe the derived allele of rs3827760 in the EDAR gene, which has effects on tooth morphology and hair thickness36,37 This allele has been the subject of a selective sweep in East Asia38, and today it is at high frequency in East Asians and Native Americans. The EDAR derived allele is largely absent in present-day Europe except in Scandinavia, which is plausibly due to Siberian movements into the region associated with the arrival of the Finno-Ugric languages many millennia after the date of the Motala samples - we estimate a date of admixture of East Asian and Sardinian like ancestry in present-day Finns at 56 ± 7 generations using ALDER39. The derived allele in the Motala samples lies on the same haplotype as in modern East Asians (Extended Data Figure 4) implying a shared origin. The statistic f4(Yoruba, Scandinavian hunter-gatherers, Han, Onge Andaman Islanders) is significantly negative (Z=-3.9) implying gene flow between the ancestors of Scandinavian hunter-gatherers and Han so this shared haplotype is likely the result of ancient gene flow between groups ancestral to these two populations.

Motala haplotypes carrying the derived, selected EDAR allele. This figure compares the genotypes at all sites within 100kb of rs3827760 (in blue) for the 7 Motala samples and 20 randomly chosen CHB (Chinese from Beijing) and CEU (Central European) samples. Each row is a sample, and each column is a SNP. Grey means homozygous for the minor (in CEU) allele. Pink denotes heterozygotes and red homozygotes for the other allele. For the Motala samples, an open circle means that there is only a single read, otherwise the circle is colored according to the number of reads observed. Note that the original haplotype on which rs3827760 arose appears to be common in CEU (marked with arrows on the right). Four of the Motala samples appear to be heterozygous for the rs3827760 haplotype, and one of the samples carries the original haplotype without the derived rs3827760 allele.
We also tested for selection on complex traits, which are controlled by many genetic variants, each with a weak effect. Under the pressure of natural selection, these variants are expected to experience small but correlated directional shifts, rather than any single variant changing dramatically in frequency, and recent studies have argued that this may be a predominant mode of natural selection in humans40. The best documented example of this process in humans is height, which has been shown to have been under recent selection in Europe41. At alleles known from GWAS to affect height, northern Europeans have, on average, a significantly higher probability of carrying the height-increasing allele than southern Europeans, which could either reflect selection for increased height in the ancestry of northern Europeans or decreased height in the ancestry of southern Europeans. To test for this signal in our data, we used a statistic that tests whether trait-affecting alleles are more differentiated than randomly sampled alleles, in a way that is coordinated across all alleles consistent with directional selection42. We applied the test to all populations together, as well as to pairs of populations in order to localize the signal (Figure 3, Extended Data Figure 5, Methods).

Test for polygenic selection using frequencies estimated from majority-called alleles rather than genotype likelihoods. As panels A-C in main text Figure 3. Comparisons with bootstrap p<0.01 are in red and labeled. A: Z scores for tests relative to CEU. B: Z scores for tests between populations that exist at the same times. C: Z scores for tests between populations that exist in the same place.

Evidence for polygenic selection in Europe. A-C: Each row represents a different trait (Height, body mass index, waist-hip ratio, type 2 diabetes, irritable bowel disease, and lipid levels), and each point represents a test statistic. Red, labeled points have bootstrap p-values < 0.01. A: Z scores for each population tested against CEU B: Z scores for the difference between populations existing at approximately the same time. Populations ordered so the difference is positive. C: Z scores for the difference between populations existing at the same location. Populations ordered so the difference is positive. D: A hypothesis, based on these results, for when selection on height may have occurred (see Table 1 for abbreviations).
We detect a significant signal of directional selection on height in Europe (p=0.002), and our ancient DNA data allows us to determine when this occurred and also to determine the direction of selection. Both the Iberian Early Neolithic and Middle Neolithic samples show evidence of selection for decreased height relative to present-day European Americans (Figure 3A; p=0.002 and p < 0.0001, respectively). Comparing populations that existed at the same time (Figure 3B), there is a significant signal of selection between central European and Iberian populations in each of the Early Neolithic, Middle Neolithic and present-day periods (p=0.011, 0.012 and 0.004, respectively). Therefore, the selective gradient in height in Europe has existed for the past 8,000 years. This gradient was established in the Early Neolithic, increased into the Middle Neolithic and decreased at some point thereafter. Since we detect no significant evidence of selection or change in genetic height among Northern European populations, our results further suggest that selection operated mainly on Southern rather than Northern European populations. There is another possible signal in the Yamnaya, related to people who migrated into central Europe beginning at least 4,800 years ago and who contributed about half the ancestry of northern Europeans today9. The Yamnaya have the greatest predicted genetic height of any population, and the difference between Yamnaya and the Iberian Middle Neolithic is the greatest observed in our data (Z=6.2, p<0.0001, Extended data Figure 6). This observation is consistent with archaeological evidence that the Yamnaya were taller than populations contemporary to them43.

Predicted genetic heights for populations split up by region and date. We computed the maximum likelihood allele frequencies for each SNP that was significant in the analysis in Ref. 44 and multiplied by the effect size from that study. The genetic height here is expressed in terms of regression effect sizes (roughly, number of standard deviations after correction for age and sex), translated so that the mean across populations is zero.
We also detect a significant signal of selection on body mass index (BMI) around the central European Late Neolithic/Bronze Age (LNBA; selection for increased BMI in CEU, Central_LNBA-CEU, p=0.022), although this does not persist when analyzed with the more weakly powered majority-called data (Extended Data Figure 5) and when we test all populations together the result is not significant (p=0.14). This could be due to reduced power for BMI relative to height, since the variance explained by the tested BMI SNPs is much lower than that is explained by the height SNPs. We observe no other significant signals of polygenetic selection among the six complex traits we tested, which included not just height44 and BMI45, but also waist-hip ratio46, type 2 diabetes47, inflammatory bowel disease48 and lipid levels31.
Our results show that ancient DNA can be used to perform genome-wide scans for selection, and to reveal the histories of phenotypically important alleles. This study has power to detect strong selection, with selective advantages greater than one percent, over the last eight thousand years of European history (Extended Data Figure 7). The negative results – the fact that we detect only five alleles with genome-wide evidence of selection – are equally interesting, as they suggest that there were only a small number of strong selective sweeps on single alleles since the advent of agriculture in Europe. None of these strong sweeps involved immune-related loci despite the fact that it has been argued that very strong selection on disease resistance would be common following the introduction of agriculture. However there are signs in our analysis of weaker selection on immune phenotypes, for example at the HLA or in the region around TLR1 and TLR6 (rs7661887, p=9.8× 10⁻⁷). From the genome-wide analysis we also see evidence for a long tail of more weakly selected alleles implying that, with additional ancient samples, similar studies would identify many loci with smaller or more complex effects. These results demonstrate the power of ancient DNA to reveal the nature of natural selection, and highlight the importance of applying approaches such as the one here beyond Europe, and to non-human species.

Power and robustness of the selection scan. A: Estimated power to detect selection at genome-wide significance under different scenarios, as a function of selection coefficent. Dashed lines indicate slelection in all populations and dotted lines indicate selection in only a single population. Different colors indicate selection over different periods of time: 50, 100 and 200 generations. B: Effect of misspecifying the mixture matrix C, over 10,000 simulations. In blue (left hand axis), the genomic inflation factor as a function of the proportion of the matrix that is random. In orange (right hand axis), the corresponding power, for a selection coefficient of 0.02 over a period of 100 generations. C: Genomic inflation constant as a function of admixture from Yoruba into a random modern population.
Methods
Selection of potentially functional sites
The in-solution capture reagent targets 394,577 SNPs9. Of these, 34,747 are “potentially functional” sites chosen as follows: 1,290 SNPs identified as targets of selection in Europeans by the Composite of Multiple Signals (CMS) test2; 14,814 SNPS identified as significant hits by genome-wide association studies, or with known phenotypic effect (GWAS); 1,289 SNPs with extremely differentiated frequencies between HapMap populations49 (HiDiff); 9,116 immunochip SNPs chosen for study of immune phenotypes and largely centered at the HLA locus (Immune); 347 SNPs phenotypically relevant to South America (mostly altitude adaptation SNPs in EGLN1 and EPAS1) and 5,387 SNPs which tag HLA haplotypes (HLA). The reagent also targets 2,524 Y chromosome SNPs, which we do not analyze in this study.
Sample selection and merging
From the set of 69 ancient samples first published by Ref. 9, we excluded five from our main analyses. Two of these were Eastern hunter-gatherers (I0061 and I0124), two were relatives of others in the set (I0411 and I0114) and one had low coverage and uncertain assignment (I0550). The Loschbour and Stuttgart samples had been genotyped at every callable site in the genome so we took the intersection of these sites with the 394,577 targeted sites9. For other published samples we obtained shotgun sequence data from the authors and counted reads at the 394,577 sites.
For the western hunter-gatherer sample from La Braña in present-day Spain12, we generated additional data beyond the published data, using the extraction, library preparation and capture protocols described in Ref. 9. We generated a total of 94,246,843 sequences passing standard Illumia filters, of which 42,952,907 mapped to the SNP targets and 22,389,493 remained after removing duplicate molecules. The fraction of terminal sites that were C→T substitutions from the reference sequence (indicating authentic ancient DNA) was 12.3%, and the average coverage on the SNP targets was 58.8-fold. The BAM file associated with these data is available at xx.
We downloaded integrated phase 3 variant calls from the 1,000 Genomes ftp site (ftp://ftp-trace.ncbi.nih.gov/1000genomes/ftp/release/20130502/; downloaded on 17th September 2014) and merged these with the ancient data. This resulted in a loss of 29,995 sites that were not present in the 1,000 Genomes VCF. For each sample we took the midpoint of its date range (usually calibrated 14C dates) as a point estimate of its age. For each population, we took the mean of the sample age estimates and used that as the age of the population.
Genotype calls and likelihood
For most ancient samples we did not have sufficient coverage to make reliable diploid calls. We therefore used the read counts at each SNP to compute the likelihood of the allele frequency in each population. Suppose that at a particular site, for population i, we have N samples with read level data, and M samples for which we made hard genotype calls (Loschbour, Stuttgart and the 1,000 Genomes samples). For samples i = 1 … N, with genotype data, we observe X copies of the reference allele out of 2N total chromosomes. For each of samples i = (N + 1) … (N + M), with read data, we observe Ri reads with the reference allele out of Ti total reads. Then, the likelihood of the population reference allele frequency, p given data  is given by
 where
where  is the binomial probability distribution and ε is a small probability of error, which we set to 0.001. We write ℓ(p; D) for the log-likelihood. To estimate allele frequencies, for example in Figure 2 or for the polygenic selection test, we maximized this likelihood numerically for each population.
We also constructed a dataset where we called a single allele at each site for each sample by choosing the allele most commonly seen in the reads mapped to that site. This results in a reduction in effective sample size of around 40% but should be more robust to small levels of contamination. We reran our main analyses on this “majority-called” dataset to check that they were not confounded by systematic contamination.
Genome-wide scan for selection
To scan for selection across the genome, we used the following test. Consider a single SNP. Assume that we can model the allele frequencies pmod in A modern populations as a linear combination of allele frequencies in B ancient populations pmod. That is, pmod = Cpanc, where C is an A by B matrix with columns summing to 1.We have data Dj from population j which is some combination of read counts and genotypes as described above. Then, writing  the log-likelihood of the allele frequencies equals the sum of the log-likelihoods for each population
To test for deviations in allele frequency, we test the null hypothesis H0: pmod = Cpanc against the alternative H0: pmod unconstrained. We numerically maximized this likelihood in both the constrained and unconstrained model and used the fact that twice the difference in log-likelihood is approximately  distributed to compute a test statistic and a p-value.
As in Ref. 9, we used western hunter-gatherers, Early Neolithic, and Yamnaya as the ancient source populations and the 1000 Genomes CEU, GBR, IBS and TSI as the present-day populations. We did not use FIN, because they do not fit this three-population model well. We estimated the proportions of (western hunter-gatherers, Early Neolithic, Yamnaya) to be CEU=(0.164, 0.366, 0.470), GBR=(0.213,0.337,0.450), IBS= (0, 0.773, 0.227) and TSI=(0, 0.712, 0.288). In practice we found that there was substantial inflation in the test statistic, most likely due to unmodeled ancestry or additional drift. To correct for this we applied a genomic control correction, dividing all the test statistics by a constant, λ chosen so that the median p-value matched the median of the null  distribution16. Excluding sites in the potentially functional set, we estimated λ = 1.21 and used this value as a correction throughout.
To estimate the power of this test, we randomly sampled allele counts from the full dataset, restricting to polymorphic sites with a mean frequency across modern populations of less than 0.1. We then simulated what would happen if the allele had been under selection in one of the modern populations by simulating a Wright-Fisher trajectory for 50, 100 or 200 generations. We took the final frequency from this simulation, sampled observations to replace the actual observations in that population, and counted the proportion of simulations that gave a genome-wide significant result after GC correction. We also performed a similar simulation, assuming that the site was selected in every population (Extended data Figure 7A).
We investigated how robust the test was to misspecification of the mixture matrix C. We reran the power simulations using a matrix C′ = pC + (1 − p)R for p ∈ [0,1] where R was a random matrix chosen so that for each modern population, the mixture proportions of the three ancient populations were jointly normally distributed on [0,1]. Increasing p increases the genomic inflation factor and reduces power, demonstrating the advantage of explicitly modeling the ancestries of the modern populations (Extended data Figure 7B). Finally, we investigated how the genomic control correction responded when we simulated small amounts of admixture from a highly diverged population (Yoruba; 1000 Genomes YRI) into to a randomly chosen modern population. The genomic inflation factor increased from around 1.2 to around 1.6 with 10% admixture (Extended data Figure 7C).
Estimating selection coefficients
Using the time-serial component of this dataset, we investigated in detail the trajectories of loci which were genome-wide significant, or for which strong evidence of selection in Europe had previously been reported. We estimated selection coefficients by fitting a hidden Markov model to the observed allele counts using an EM algorithm21. Since this model relies on a binomial sampling likelihood, we used the majority call alleles for this analysis. While this model assumes a continuous, constant size population, which is not the case for Europe, we reasoned that the effect of turnover and admixing populations would be to increase the variance of the allele frequency trajectory, and that we could compensate for this to some extent by excluding western hunter-gatherers and estimating the effective population size from neutral sites. Using 1,000 randomly sampled sites, the maximum likelihood estimate of the diploid effective population size 2Ne was 5,998 (95% confidence interval, CI=5,199-6,979). For each sample we assumed its age was given by the midpoint of the estimated age range (archaeological or 14C), and converted to generations by assuming a mean generation time of 29 years.
Test for polygenic selection
We implemented the test for polygenic selection described by Ref. 42. This test evaluates whether trait-associated alleles, weighted by their effect size, are overdispersed compared to randomly sampled alleles, in the directions associated with the effects measured by genome-wide association studies (GWAS). For each trait, we obtained a list of significant SNP associations and effect estimates from GWAS data, and then applied the test both to all populations combined and to selected pairs of populations. We estimated frequencies in each population by computing the MLE, using the likelihood described above. For each test, we sampled SNPs frequency matched in 20 bins, computed the test statistic Qx and for ease of comparison, converted these to Z scores, signed according the direction of the genetic effects. Theoretically Qx has a χ2 distribution but in practice it is overdispersed so we report bootstrap p-values computed by sampling 10,000 sets of frequency matched SNPs. For this analysis we grouped populations together by period and location so, for example, “Central_MN” means all Middle Neolithic populations from Central Europe (present-day Germany, see Table 1). We repeated the analysis using the majority-called dataset.
Acknowledgments
We thank Paul de Bakker, Joachim Burger, Christos Economou, Elin Fornander, Fredrik Hallgren, Karola Kirsanow, Alissa Mittnik, Adam Powell, Pontus Skoglund and Shervin Tabrizi for helpful discussions, suggestions about SNPs to include in the capture reagent, or contribution to sample preparation. We also thank Julio Manuel Vidal Encinas and María Encina Prada for allowing us access to the La Braña sample and the 1000 Genomes Project for allowing use of the phase 3 data. IM is supported by a long-term fellowship from the Human Frontier Science Program. DR is supported by U.S. National Science Foundation HOMINID grant BCS-1032255, U.S. National Institutes of Health grant GM100233, and the Howard Hughes Medical Institute. This research was supported by an Australian Research Council grant to WH and BL. (DP130102158).


